Mapbox Boundaries
Global boundary datasets for analytics, mapping, and data enrichment
Global coverage
Over 5 million boundaries worldwide for countries, postal codes, statistical regions, and local administrative areas.

Flexible formats
Use boundaries via vector tiles, API, or flat files to support workflows in the cloud, locally, or offline.
Reliable analysis
Topologically correct, edge-matched geometries for seamless borders and strict hierarchical nesting.
Global boundaries at scale
Analyze and visualize any dataset by country, region, or postal code with edge-matched global boundary data.
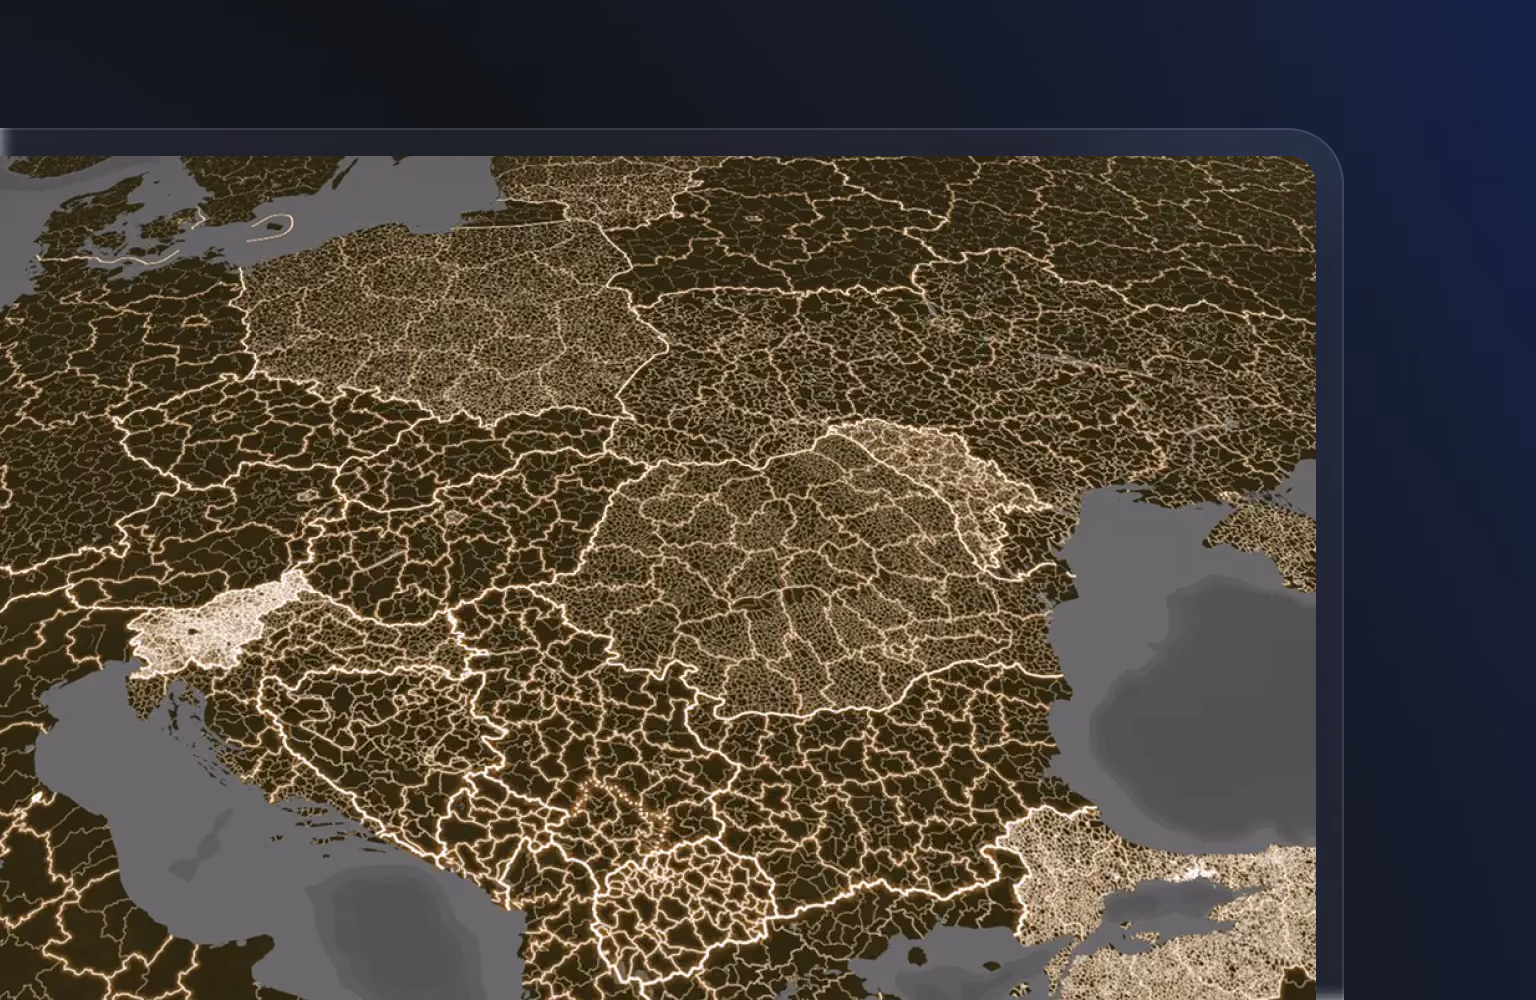
5M+ high-accuracy boundaries worldwide
Trust high-resolution boundaries across countries, statistical regions, cities, and custom administrative levels, expertly built and continuously updated from over 2,000 authoritative sources for reliable analysis at scale.
Flexible data formats for API access or self-hosting
Vector tilesets offer quick and lightweight API access. Flat files allow for self-hosted deployments, air-gapped environments, and advanced geospatial analysis in data science and business intelligence settings. See the flat files in action.
Built for performance at scale
Run fast data joins, aggregations, and rendering in production environments. Mapbox Boundaries powers dashboards, analytics, and applications without bottlenecks.
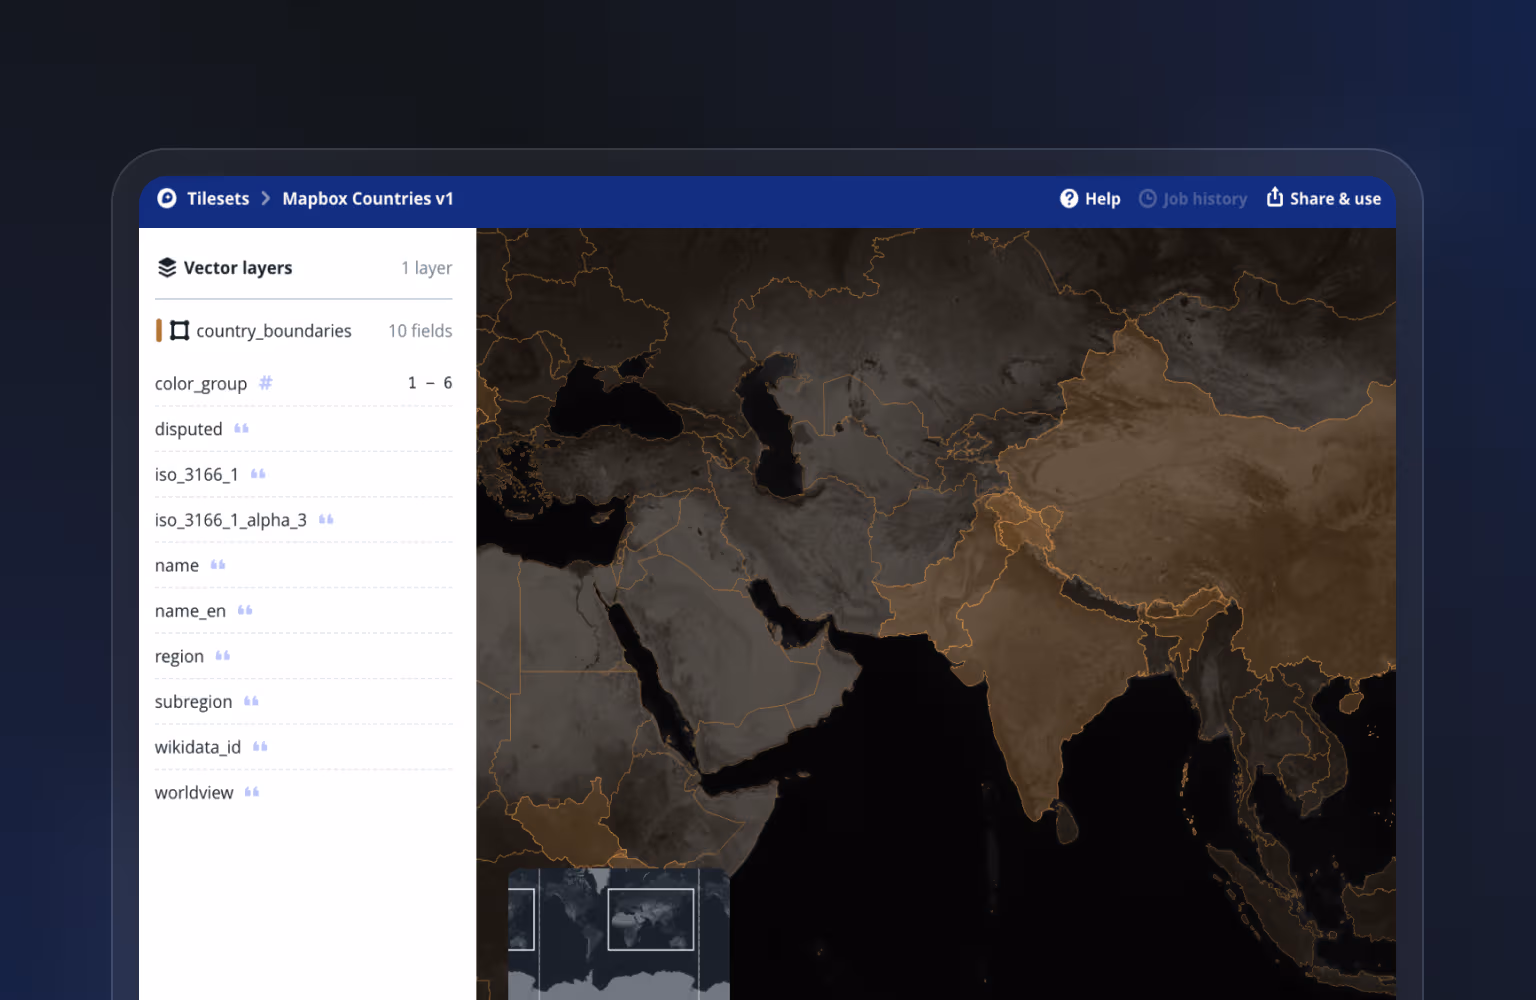
High-resolution country polygons
Admin 0 level country boundaries are available through the countries-v1 tileset at no cost. The high-resolution polygons include data on disputed areas and multiple worldviews, making it easier to design map styles and data visualizations to match specific boundary styling requirements.
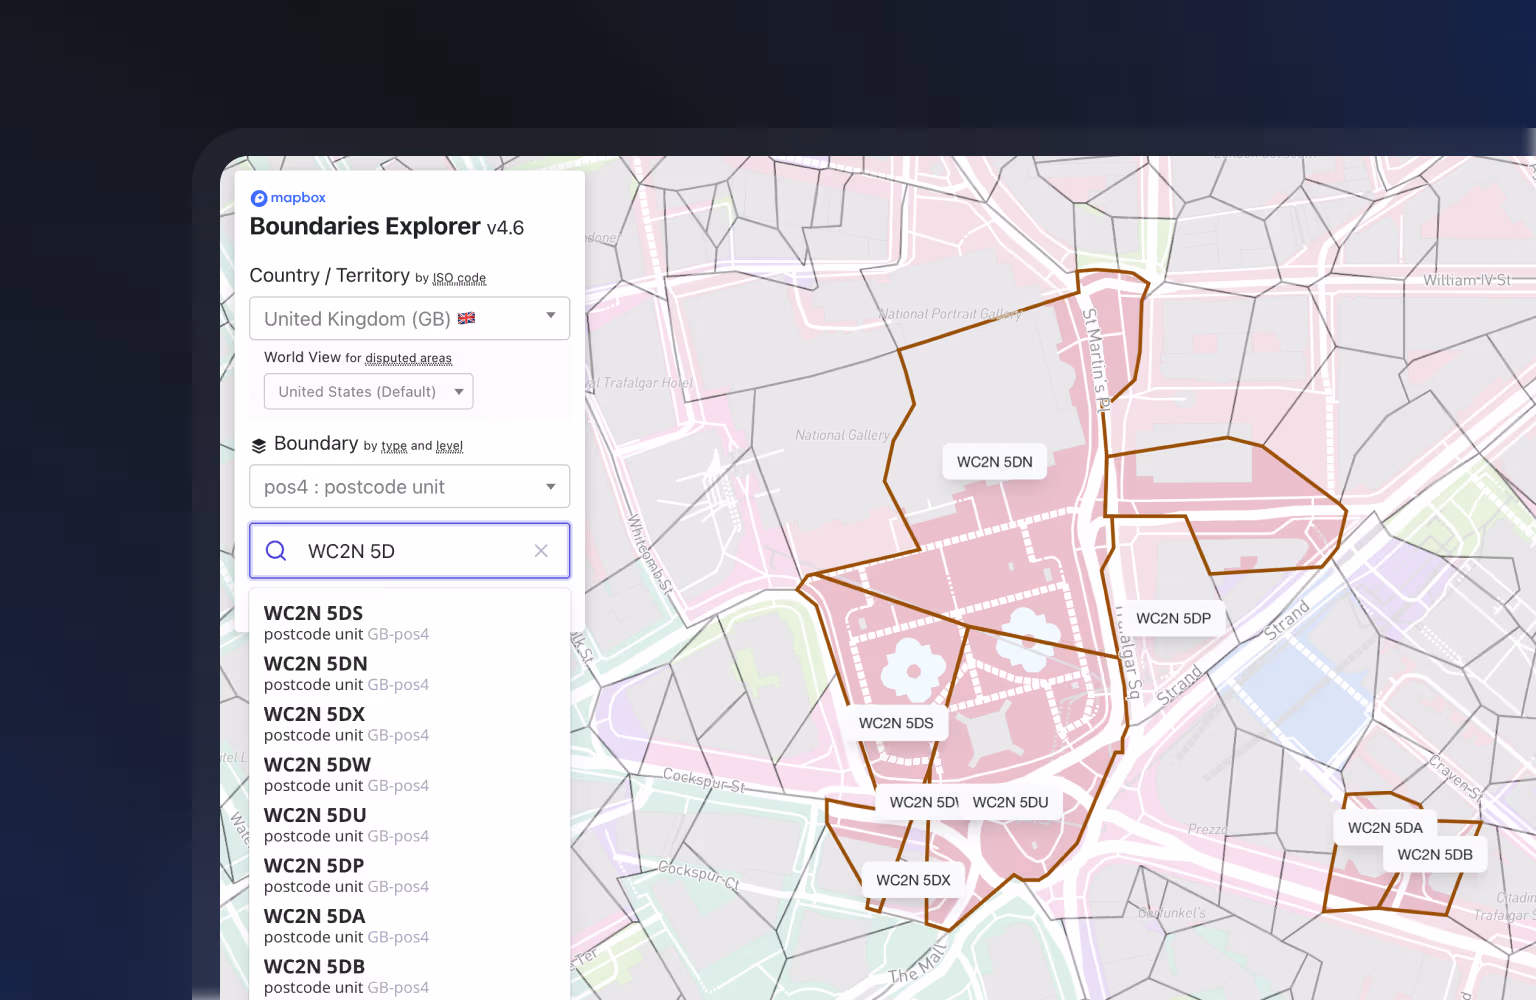
Boundary types for every use case
Access administrative, legislative, locality, postal, or statistical boundaries to support analysis, visualization, and decision-making. Choose layers that match how people, governments, and systems define geographic areas.
Clean, consistent geometries
Work with smooth edge-matched boundaries and seamless hierarchies. Human-reviewed geometries ensure accurate borders and strict relationships across administrative levels, reducing the need for data cleanup.
Pricing tailored to needs
Pay for only the tilesets and places that you use. Boundaries licenses are based on data type, geographic scope, and use case, with flexible tiers to match requirements.
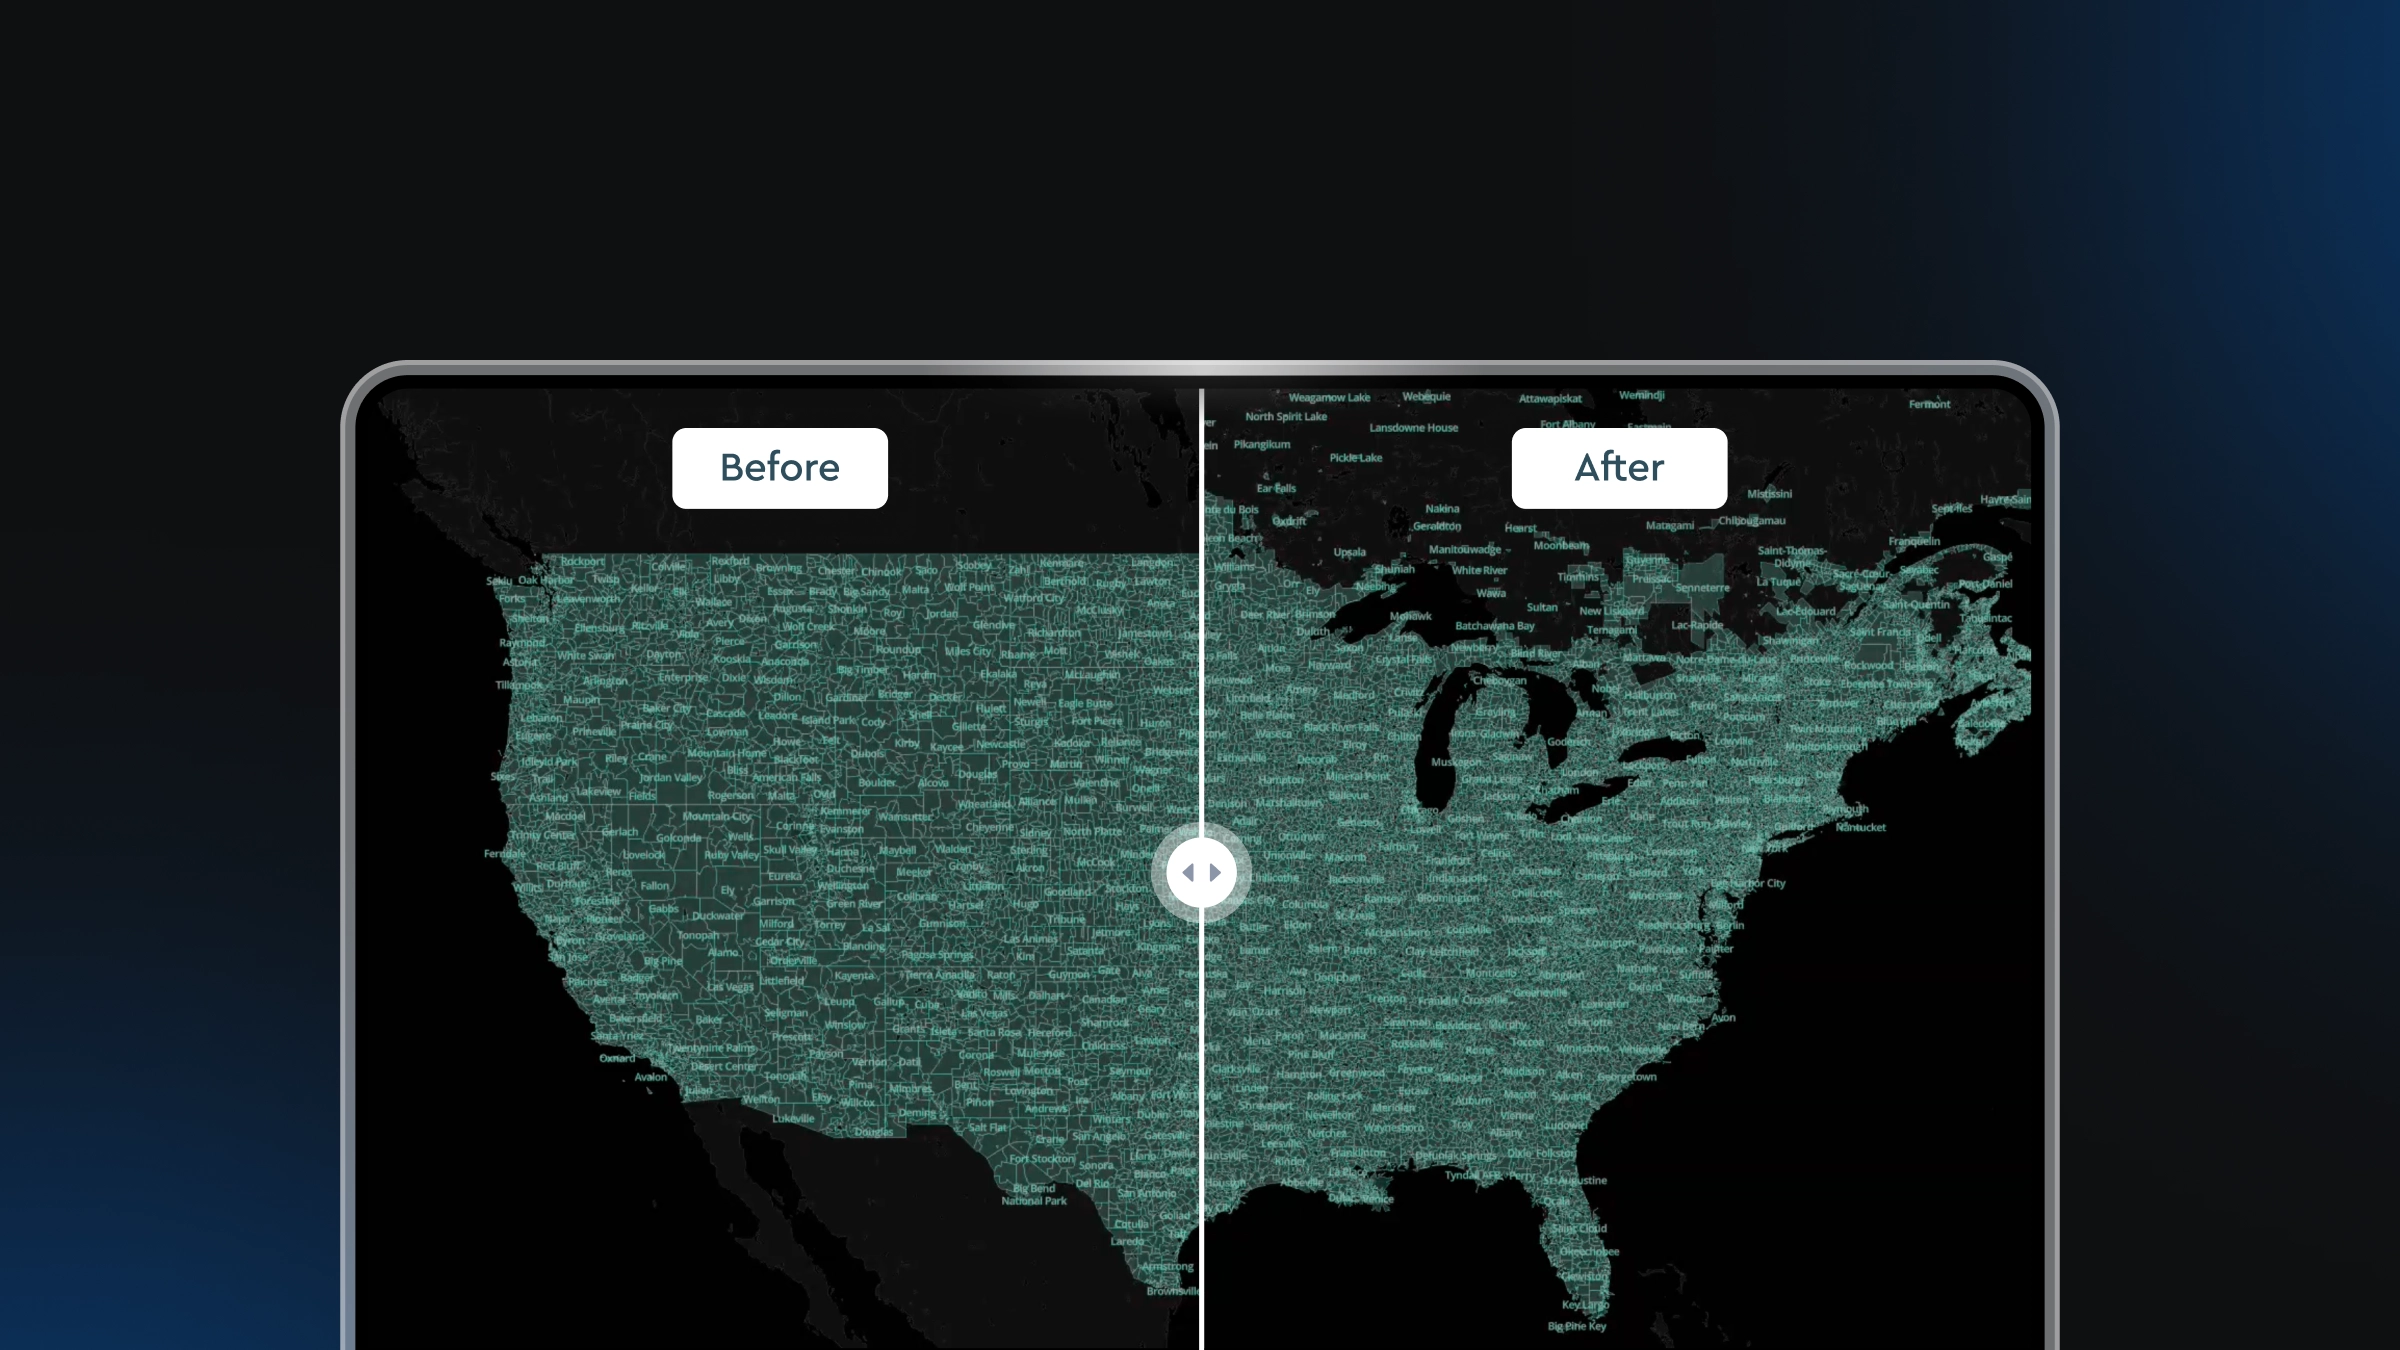
Mapbox Boundaries 4.6: Expanded global coverage with major updates across the Americas
75,000+ new boundaries and 88,000+ updates across 37 countries and regions
Highly adaptable to custom use cases
Mapbox Boundaries powers data analysis, visualization, and
operational decision-making across industries.
Business intelligence and analytics
Enrich datasets with consistent geographic boundaries to support reporting, segmentation, and spatial analysis across regions and markets.
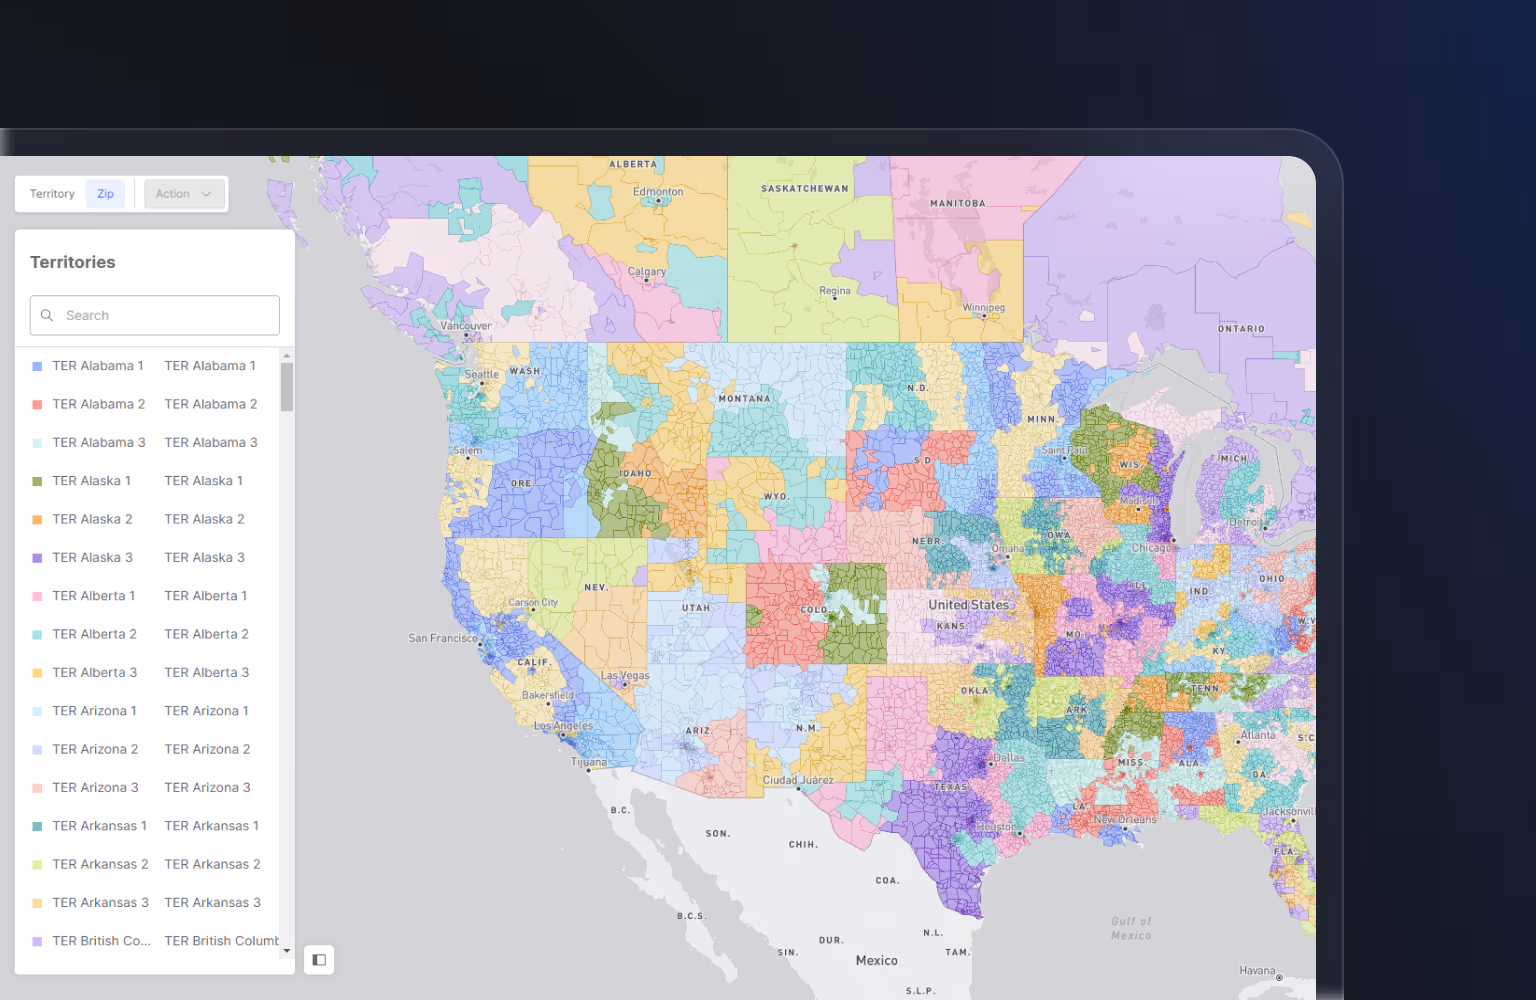
Territory planning
Define and optimize sales, service, or operational territories using accurate administrative and postal boundaries.
Data visualization
Build clear, reliable maps and dashboards with boundary data designed for choropleths and geographic comparisons.
Metadata and content tagging
Assign geographic context to content, assets, or events using structured boundary hierarchies for improved organization and discovery.
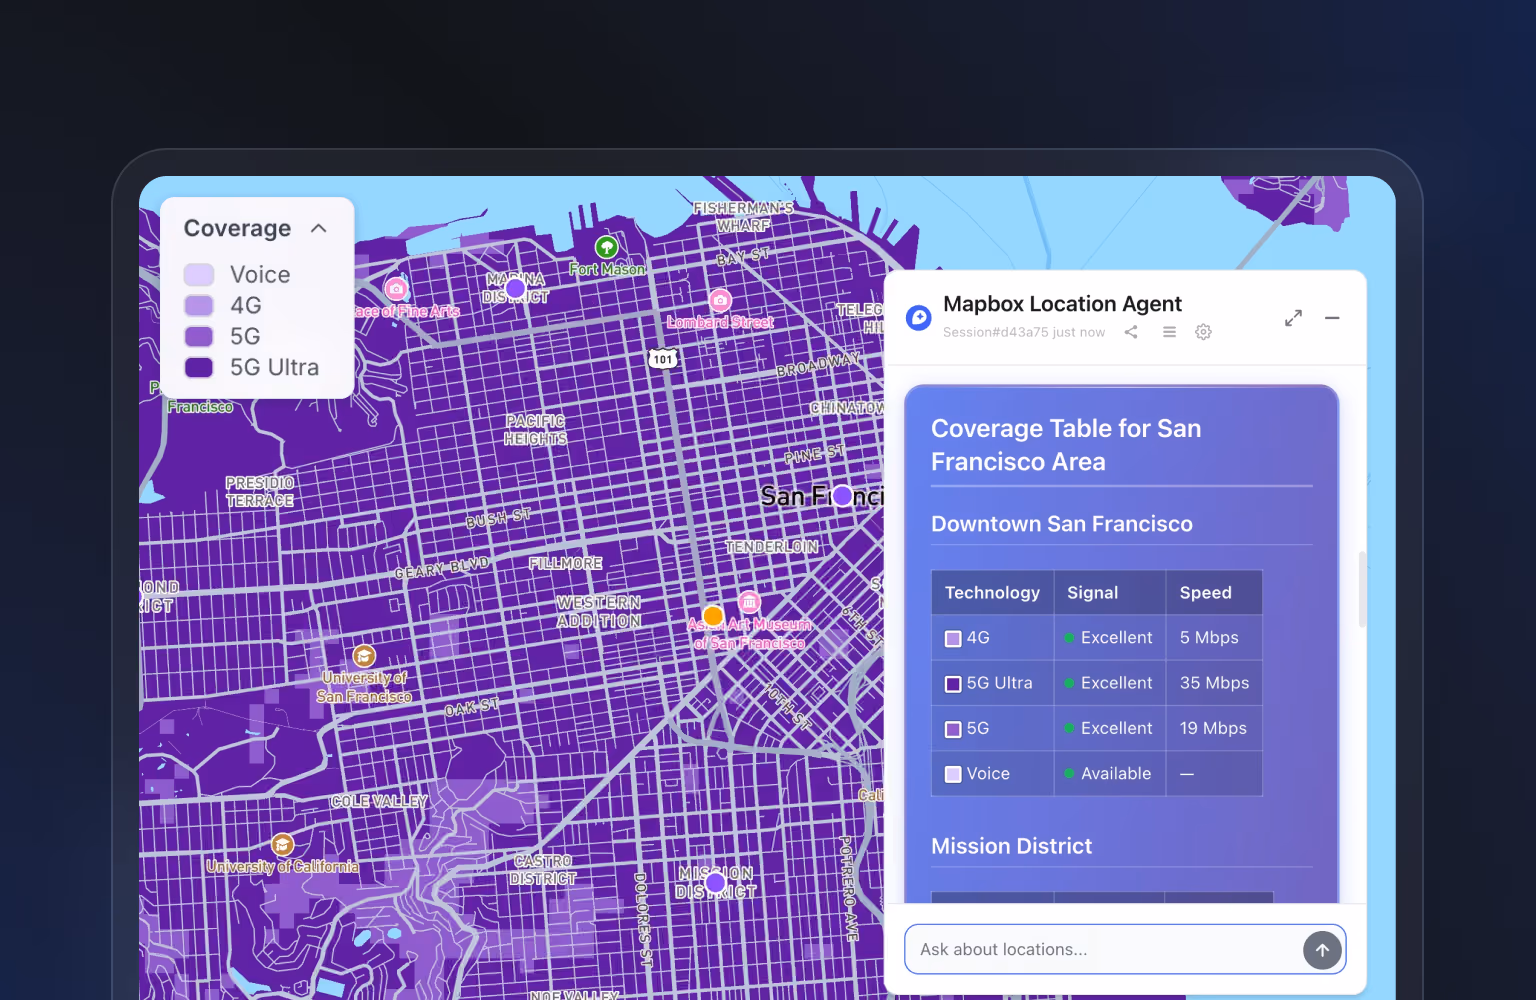
Service coverage and resource planning
Assess service coverage and resource allocation by combining data with precise geographic boundaries.
Customer stories


Developer resources
See what Mapbox is made of with key developer tools and community resources.
Webinar: How to Build Election Data Maps with Precise Boundaries and AI
Learn practical techniques for building election data maps with high-precision boundaries, dynamic data integration, and AI-powered workflows.
Introducing Mapbox Boundaries flat file format: Advanced analysis & data-driven decisions
Learn how the new flat file format makes it easier to access, analyze, and integrate boundary.
Webinar: How Mapbox interactive boundaries and mapping solutions empower election storytelling
See how interactive boundaries and mapping tools help visualize election data and create compelling, data-driven stories.
Boundaries documentation
Get started with Mapbox Boundaries, including data structure, access methods, and guides for integrating boundary data into your applications.
Mapbox Boundaries 101: Data quality and business impact
Understand how high-quality boundary data improves decision-making and drives business outcomes across industries and use cases.
Geospatial storytelling with Tableau and Mapbox Boundaries
Discover how to combine Mapbox Boundaries with Tableau to create rich, interactive visualizations for geospatial storytelling.
Frequently Asked Questions
Mapbox Boundaries is an expertly curated set of global boundary data that allows you to add boundaries to your maps, dashboards, and data visualizations. Mapbox Boundaries consists of multiple data layers that come cartographically-matched, georeferenced, and processed as a Mapbox vector tileset ready for integration with your maps and data.
Mapbox Boundaries makes maps more useful by enablinginteraction with worldwide polygons, adding valuable context to your maps and supporting comprehensive analysis. This added coverage can help:
- A sales team visualizing revenue by US state to determine territories.
- A real estate firm counting POIs by US zip code to build a “livability” index.
- A regional disaster response center using city and county boundaries to determine jurisdiction for emergency response.
- A utility or energy company visualizing and assessing localities affected by transmission infrastructure planning.
There are currently five data types in Mapbox Boundaries:
- Administrative: Divisions within a country or territory delineated for the purpose of general administration. These usually have a capital and some type of government of their own, with the power to set laws and collect taxes throughout the division.
- Legislative: Constituency areas for various types of legislative assemblies or regional councils. Typically voters elect a single representative to a larger body from each of these areas.
- Locality: These are types of places that do not necessarily represent any official boundaries, but are nonetheless commonly used as definitions of “place.”
- Postal: These are approximate areas of mail delivery based on national postal code systems.
- Statistical: These are non-administrative boundaries that are most commonly used for statistical purposes. These might be officially defined by a governmental statistical bureau, or historical administrative boundaries that are still relevant for statistical uses (e.g. Census blocks in the US).
Mapbox Boundaries is a world wide, curated data product that covers everything from Chinese prefectures and Japanese 7-digit postal codes to French arrondissements and US neighborhoods. Exact coverage varies by country and we encourage you to explore the Mapbox Boundaries country explorer to see all of the data available to you.
Additionally, Mapbox Boundaries has worldviews for Chinese, Japanese, Indian, and US or International audiences, so you can provide localized context for data to your customers wherever they do business.
Follow this getting started guide to begin building maps with Mapbox Boundaries.
All of Mapbox Boundaries are available via Mapbox vector tiles or in flat file GeoJSON format.
The vector tileset format offers quick and lightweight API access. The flat file format allows for self-hosted deployments, air-gapped environments, and advanced geospatial analysis in data science and business intelligence settings. See the flat files in action or Request flat file sample data.
Mapbox Boundaries facilitates data driven decision making by enabling you to join custom data with boundary polygons. The data product also allows you to visualize your data by areas such as country, region, sub-region, or post code to unlock insights within your application. You can:
- Group and aggregate statistics by any type of boundary, including easy drill down, with Data-Joins.
- Match point features - any longitude & latitude - to any boundary from our Tilequery API.
- Extend Mapbox Boundaries with any custom polygons you need for your application.
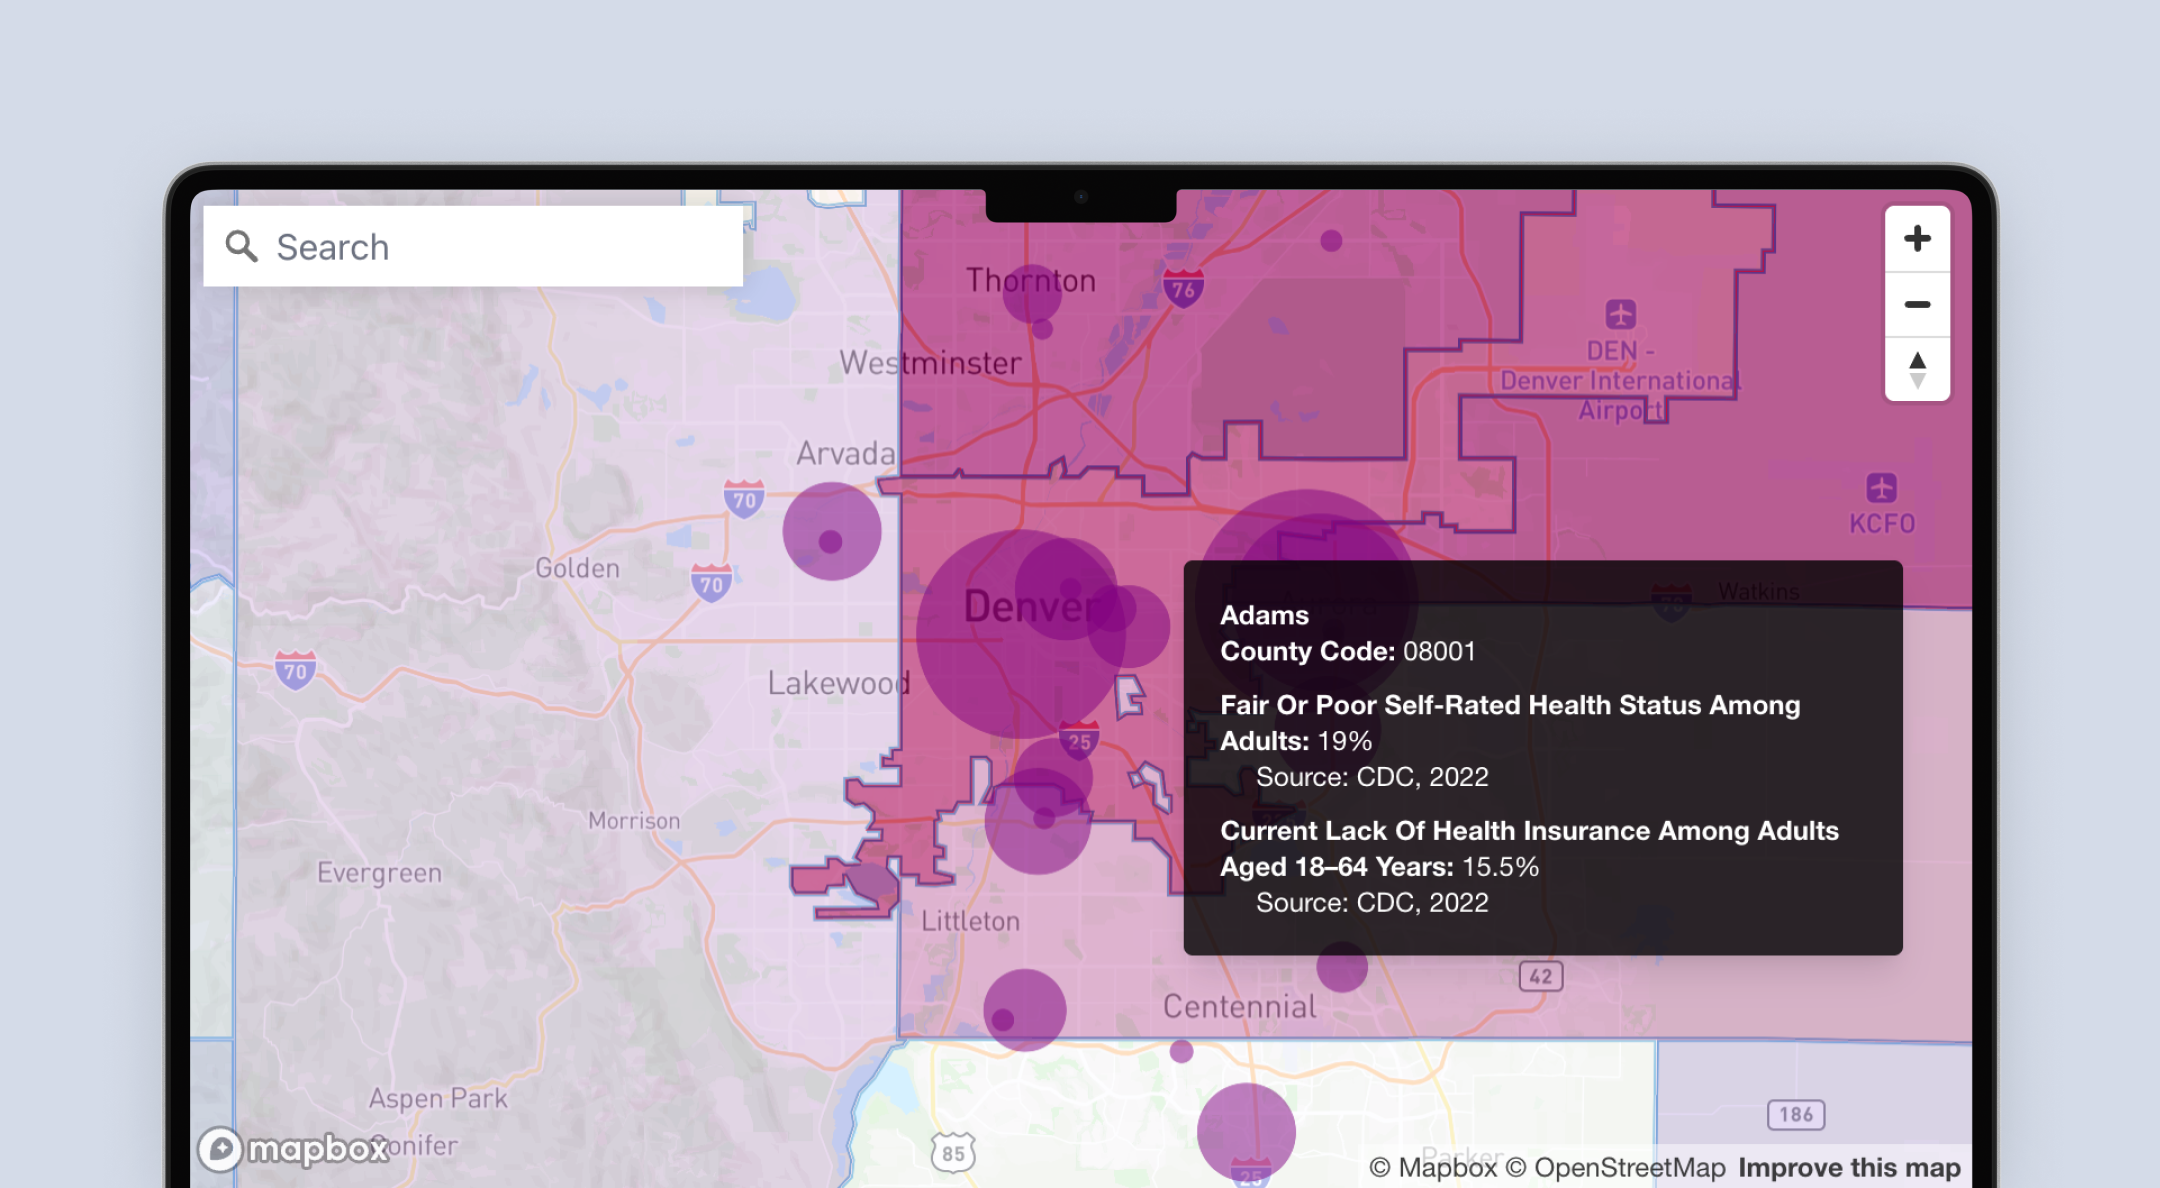
Here is an example that demonstrates how a user can aggregate point data into polygon hierarchies (using the data join technique and the Tile Query API) to analyze hospital charges in the US - all rendered through an interactive map with GL JS.
Please refer to the feature lookup tables that can be found in our Mapbox Boundaries getting started guide.
To purchase a Mapbox Boundaries license, please contact our sales team or your assigned Mapbox representative.
To add Mapbox Boundaries to a map style in Mapbox Studio, select the “Add Layer” button and view the “Sources” tab. Next, add the desired tilesets as a layer within a map by selecting specific boundary tilesets from the list of Mapbox Boundaries tilesets. Except for the countries-v1 tileset, access to the Mapbox Boundaries tilesets is controlled by your Mapbox account access token and requires a license. To start a trial of Boundaries, please contact our sales team.
Ready to get started?
Create an account or talk to one of our experts.