Boundaries 4.6: Expanded global coverage with major updates across the Americas
75,000+ new boundaries and 88,000+ updates across 37 countries and regions
Mapbox Boundaries 4.6 is now available, adding over 75,000 new and over 88,000 updated boundaries across the Americas, Europe, and Asia-Pacific, with particular expansion of postal, locality, and statistical layers. The 4.6 release builds on the 160,000 boundaries across Europe added last year in version 4.5.
Countries with the most significant 4.6 updates include the United States, Canada, Brazil, Mexico, and Puerto Rico. The latest release highlights how Mapbox Boundaries tilesets make it easier for teams to use current and complete geographic reference data for analytics, reporting, and operational planning.
What’s new in Mapbox Boundaries 4.6
Mapbox Boundaries 4.6 introduces enhancements across administrative, postal, locality, and statistical boundary layers. The updates reflect recent geographic, administrative, and postal changes and support more accurate analysis across regions. Read the full changelog of 4.6 here, with particular emphasis on the following highlights:
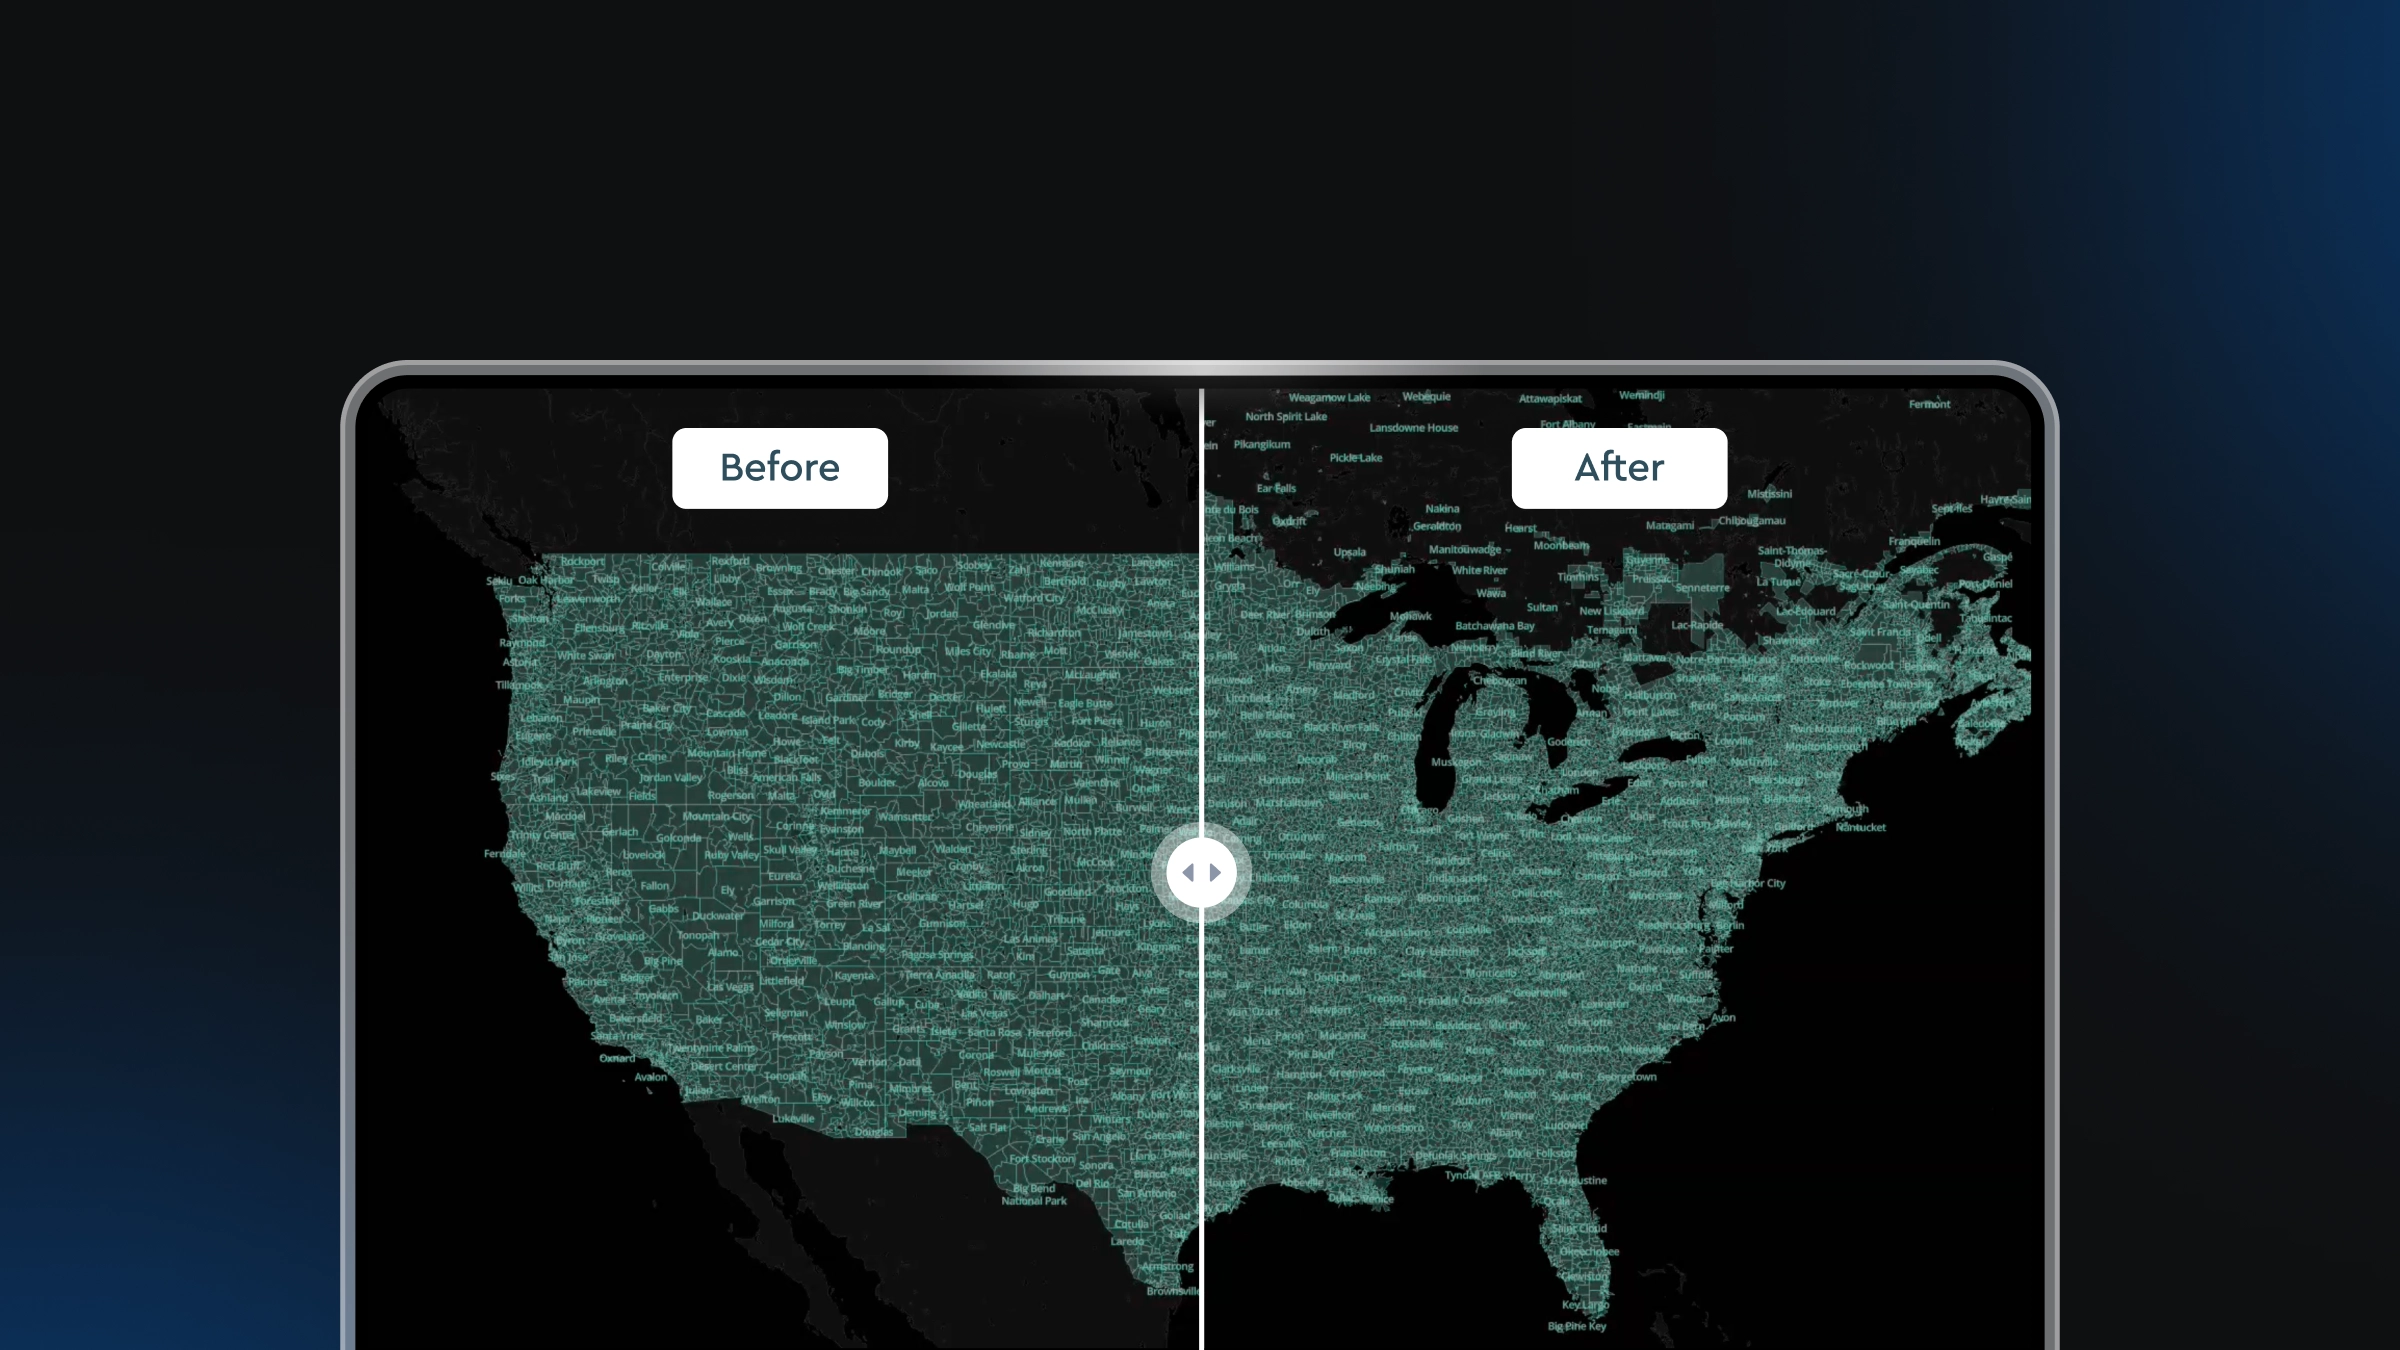
Expanded locality coverage in Canada
Mapbox Boundaries 4.6 adds a new locality layer for Canada, contributing approximately 20,000 new features. The update improves the representation of cities, towns, and local population centers, supporting clearer analysis for regional planning, demographics, and service coverage.
Improved postal coverage in Mexico
The 4.6 release adds approximately 12,000 new postcode features and expands postal coverage across Mexico. The additions fill in much of the remaining rural coverage, supporting better delivery analysis, regional reporting, and market segmentation.
Postal updates in Brazil
Brazil now includes approximately 1,000 new postcode features, filling gaps across the 83*–87* postcode range. The update improves alignment between postal boundaries and current addressing practices.
Updated locality and postal data for the U.S. and Canada
The 4.6 release refreshes locality and postal boundaries across the United States and Canada using the most recent official data from 2024, improving consistency for address-based and regional analysis.
In addition, all U.S. administrative, legislative, and statistical boundary layers are now updated with the most recent available official data from the 2024 census. The release also replaces Connecticut county boundaries with Councils of Government planning regions to align with the state’s current planning structure. Together, the updates support more accurate population analysis, district reporting, and regional planning.
Updated country boundaries in South America and beyond
The release also updates country boundaries across South America, including Argentina and Chile, along with worldview-aligned updates for Serbia and Türkiye. The changes support consistent boundary interpretation across different geopolitical views.
Administrative restructuring in Vietnam
Provinces and major cities in Vietnam are consolidated to reflect the 2025 administrative restructuring. The updates help maintain consistency with current government designations and reporting standards.
Precise boundary data supports reliable geographic analysis
Geospatial boundaries define how regions are measured, compared, and understood, whether they represent national borders, administrative regions, postal delivery areas, statistical reporting zones, or locally recognized places.
Boundaries change over time. District lines are redrawn, postal systems evolve, cities grow, border disputes evolve, and administrative regions reorganize. When boundary data falls out of date, organizations risk basing decisions on inaccurate assumptions.
For teams working in analytics, planning, and reporting, outdated boundaries can lead to misaligned regional metrics or inconsistent reporting over time. Accurate boundary data helps organizations align analyses with how regions are defined today, not how they were defined years ago.
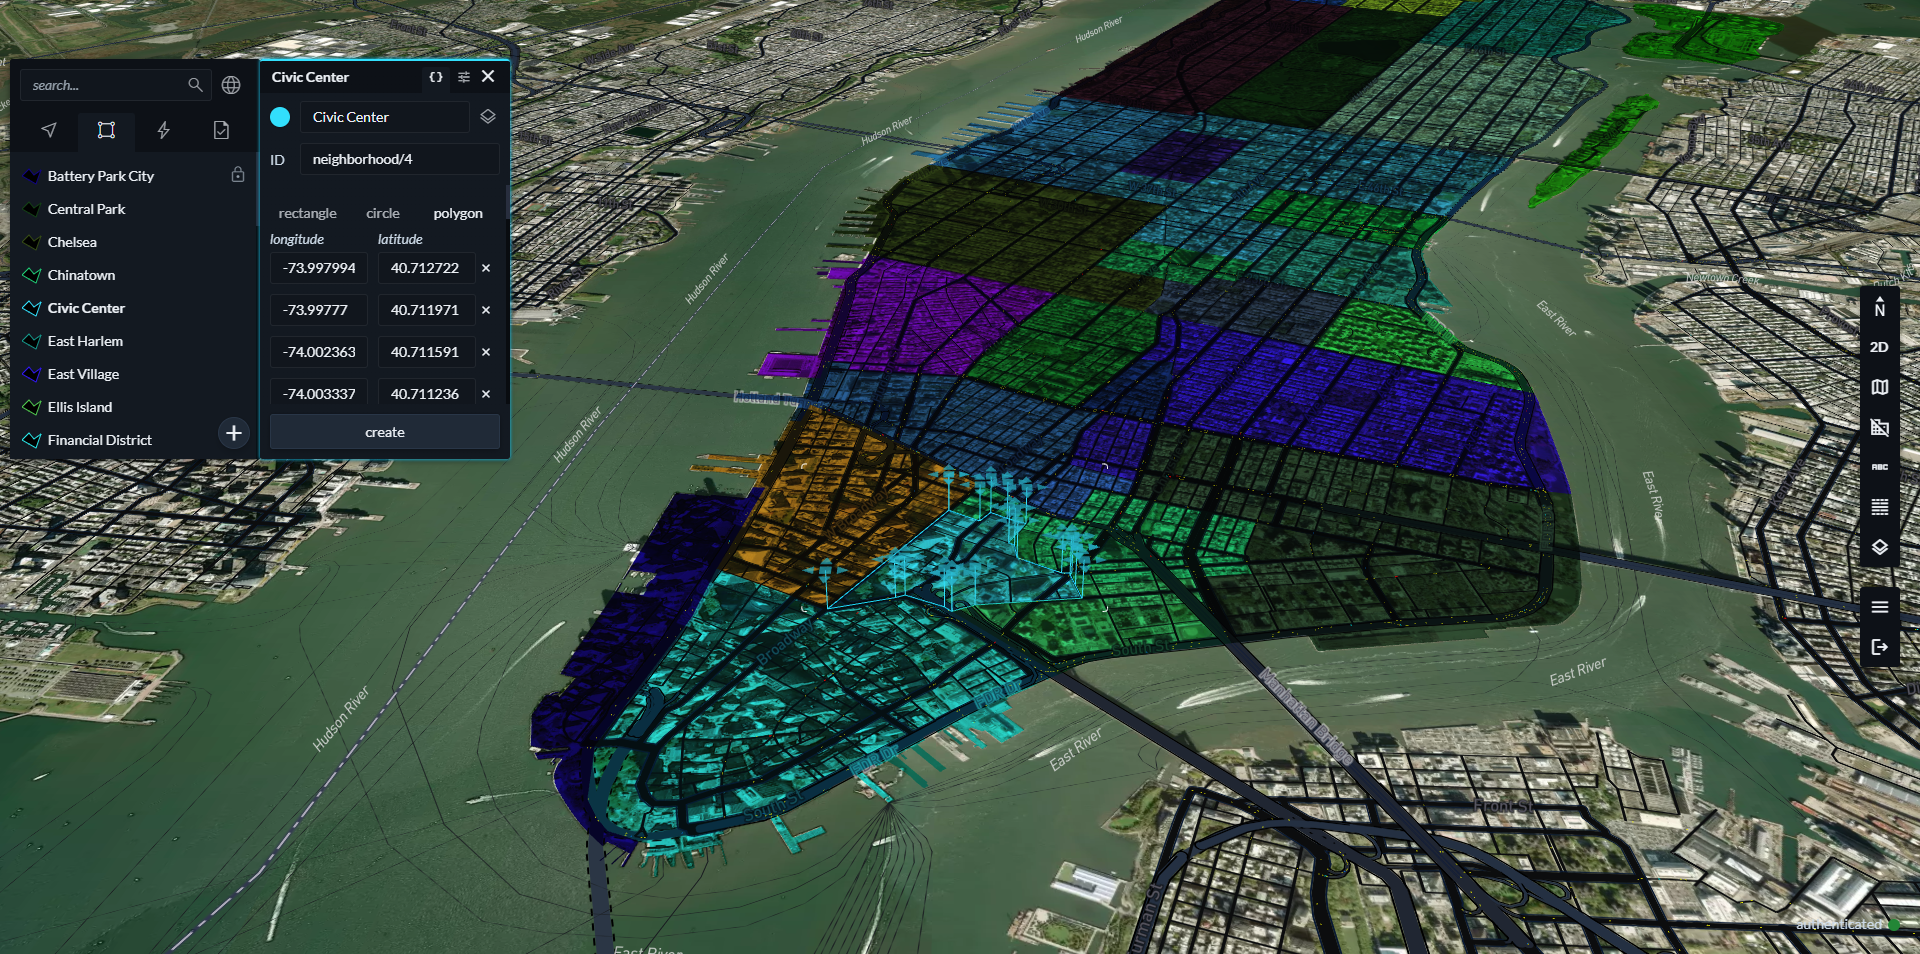
Mapbox boundaries data is expertly curated for each country, with over 5 million boundaries covering political, statistical, state, county, city, and zip code areas worldwide. As district lines and metadata shift, Mapbox continuously refreshes the Boundaries tilesets to reflect changes and keep analytics accurate.
Mapbox Boundaries enable smarter decisions across industries
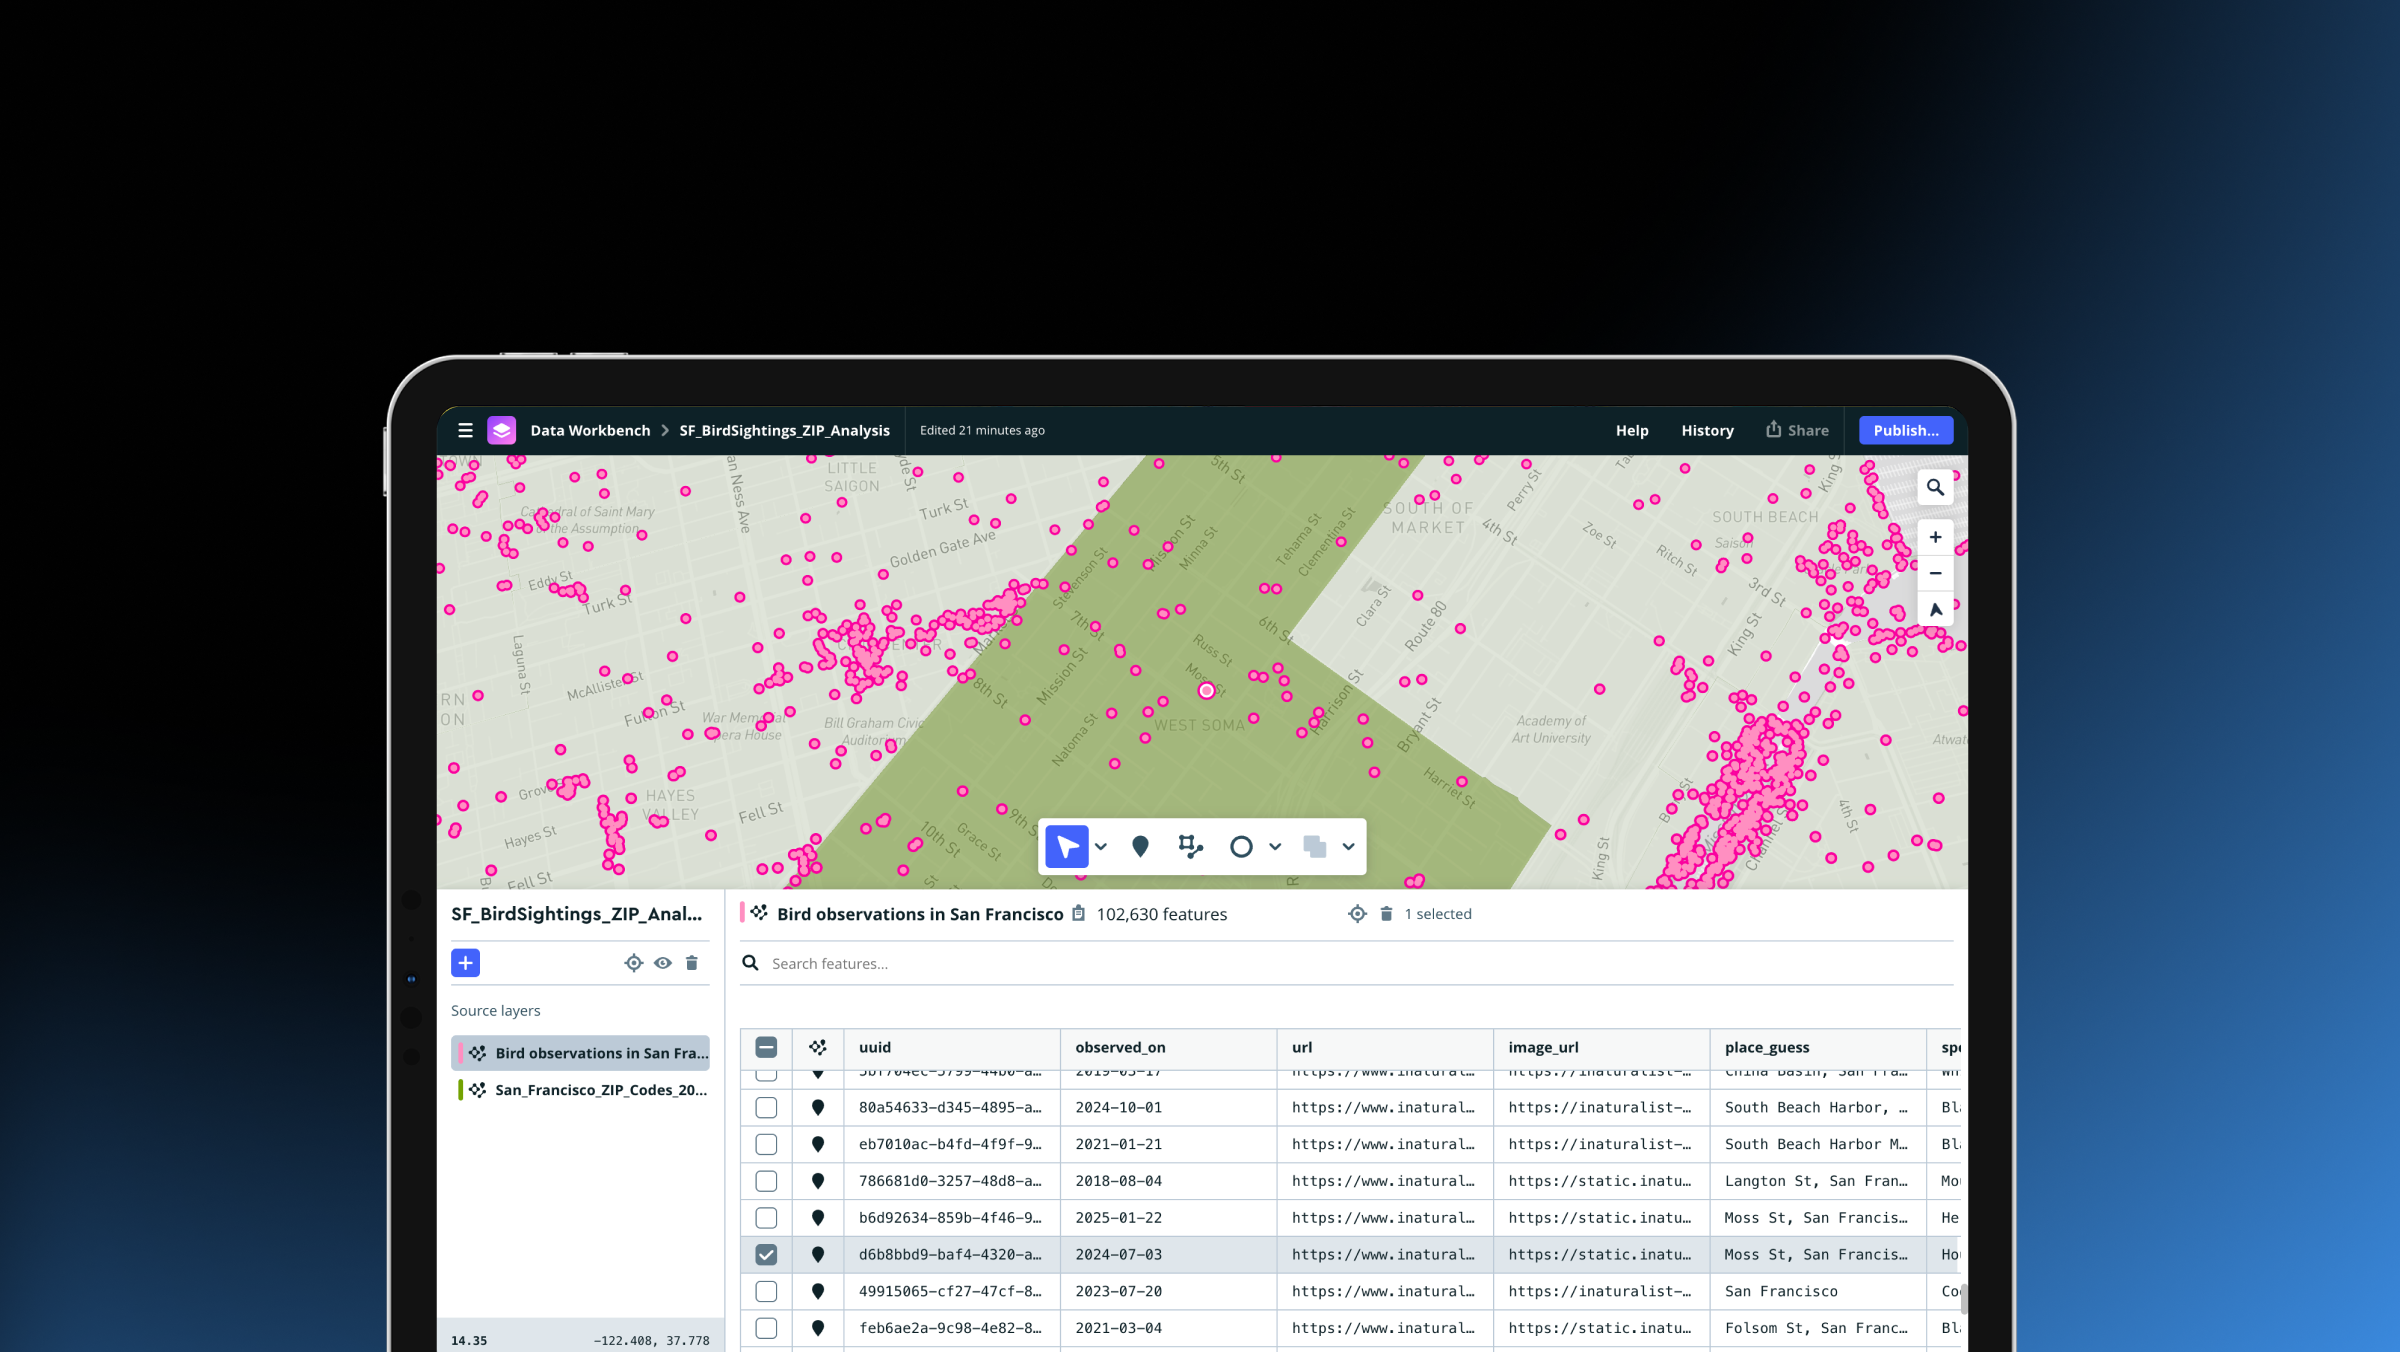
Mapbox Boundaries tilesets support a wide range of industries and use cases, including geospatial analysis, business intelligence, service territory planning, supply chain analysis, and content tagging. Organizations across different industries rely on boundary data to group, compare, and visualize information by region.

The nonprofit organization DataKind uses Mapbox Boundaries to support accessible data analysis and insight delivery. With Mapbox Boundaries tilesets, DataKind achieved 50% faster map load times and 58% higher engagement.
“Mapbox boundaries data performance is unbeaten. Mapbox handles massive datasets at highly granular boundary levels without blinking, and resolved [our] performance issues – clearing the path for future products that put mapping analysis at the center.” – Sophia Harms, Director, Engineering, U.S. Community Products, DataKind
Access the latest Mapbox Boundaries tilesets via API or self-hosted files
Mapbox Boundaries datasets are available on an annual license. Contact Mapbox to access the tailored package of Boundaries tilesets most applicable to any use case or geography.
Mapbox offers Boundaries in two formats to support different technical needs. The vector tileset format offers lightweight, scalable access via API, supporting production applications that need fast boundary rendering and interaction. Explore the Mapbox Boundaries vector tiles in an interactive playground. The flat GeoJSON file format supports self-hosted environments and advanced analysis workflows that require full geometry and metadata access, such as those used in data science, analytics, and BI environments. Request a flat file sample dataset for evaluation.
Frequently asked questions
What is included in Mapbox Boundaries 4.6?
Boundaries 4.6 includes new and updated administrative, postal, locality, and statistical boundaries across 37 countries and regions, with expanded coverage in the Americas and updates across Europe and Asia-Pacific. Here is the boundary data changelog.
Does Mapbox Boundaries provide global coverage?
Yes. Mapbox Boundaries includes more than five million boundaries worldwide, covering countries, regions, cities, and other administrative levels. The data is built and updated by Mapbox using over 2,000 authoritative sources to support accurate, large-scale geographic analysis. For more detail, see Mapbox Boundaries 101: Data Quality and Business Impact.
How often is boundary data updated?
Boundary data is refreshed regularly to reflect changes in administrative structures, postal systems, and geographic definitions as they evolve.
Can I use Mapbox Boundaries for business intelligence?
Yes. Mapbox Boundaries is commonly used in BI platforms to support regional reporting, segmentation, and geographic analysis.
Are flat files available for self-hosted use?
Yes. Flat GeoJSON boundary files are available for self-hosted environments and advanced analysis workflows. Sample datasets can be requested for evaluation.
How is Mapbox Boundaries priced?
Mapbox Boundaries pricing is based on the boundary layers you use (such as administrative, postal, or statistical), the geographic coverage, and how the data is accessed. This lets teams pay only for the data they need. Contact the Mapbox team to discuss pricing options for your specific use case. Contact our team for pricing.


Related articles
Drag, drop, edit, publish: A simplified workflow for custom data
Mission-ready mapping: Securely bring together maps, AI, and response