Geospatial storytelling with Tableau and Mapbox Boundaries
At BUILD with Mapbox 2025, Tableau Principal Solutions Engineer Ross Paulson shared recommendations for how analysts can move from basic map visualizations to insightful interactive map dashboards. The secret ingredient? Mapbox Boundaries, a global dataset of geopolitical, postal, administrative, statistical, and legislative polygons that makes it easy to pair datasets with geospatial polygons around the world. Watch the BUILD with Mapbox recording here.
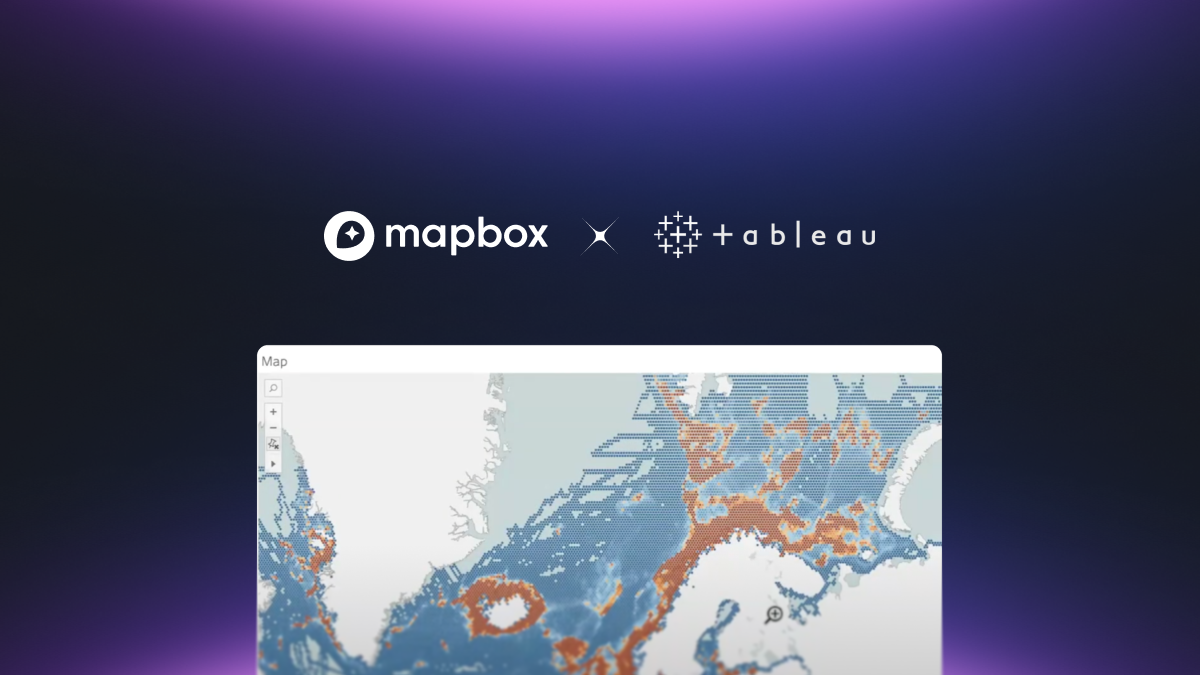
Mapbox maps and geospatial data drive deeper insights in Tableau
Since 2017, Tableau and Mapbox have partnered to deliver delightful and powerful capabilities for building map-based data visualizations within the Tableau platform. From highly customizable map designs, to fast-loading vector tiles, Mapbox unlocks a highly extendable map-building toolkit for Tableau users.

Comprehensive boundaries data in Tableau is powered by Mapbox Boundaries – for everything from expected data like states and counties in the US, to highly detailed data like communes in France, kampungs in Indonesia, and fine postal levels in places like Canada and the UK. The dataset is carefully curated to avoid gaps and overlaps and is worldview-aware for disputed borders. Within Tableau, Boundaries data helps to not only visualize tabular data by linking it to geospatial features, but also can support data enrichment and analysis.
For Tableau users, Mapbox capabilities are especially popular for visualizations, flexible data engineering paths, and customizable basemap designs.
Ready to use polygons for visualizations
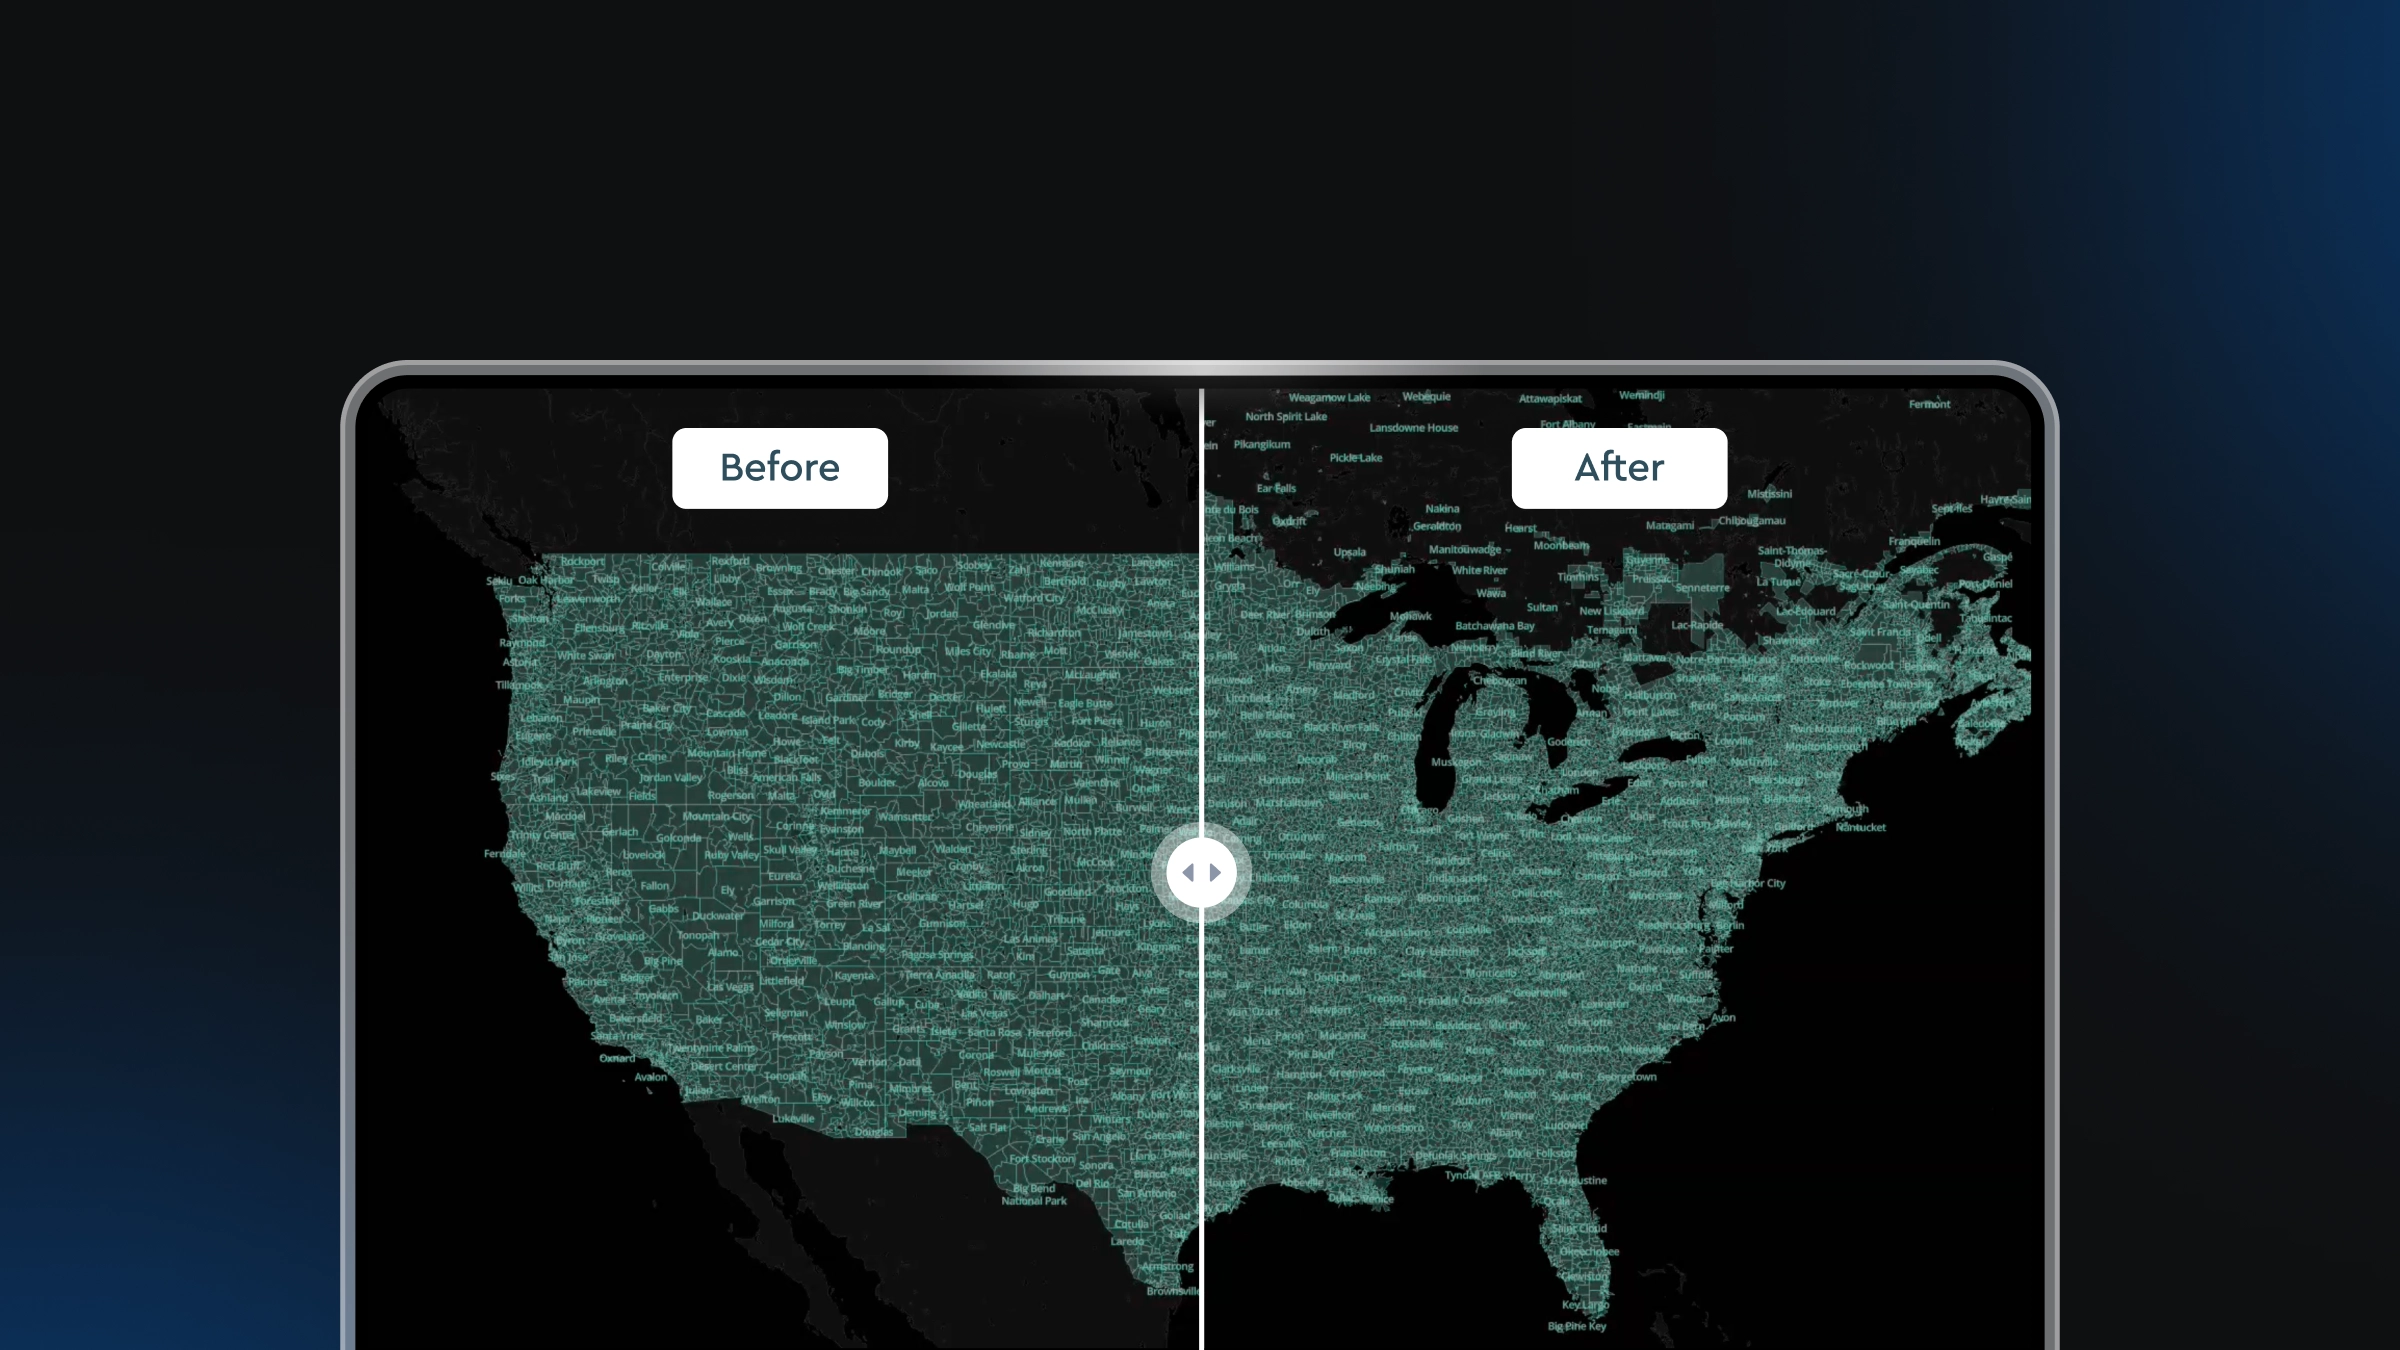
In Tableau, a simple measure can create choropleth visualizations without downloading and cleaning numerous shapefiles or KMLs, because the map references Mapbox Boundaries directly. The Boundaries tileset is also designed to be lightweight and fast, so even dense layers (like Canadian block-level postcodes) remain responsive.
Flexible data engineering paths
Mapbox Boundaries are available two ways: via API as vector tiles, or as flat GeoJSON files. Tableau utilizes both of these for lightning-fast vector tile based maps for analysis with the flexibility of flat file data in the back-end, with access to geometry for custom simplification or combination of data.
Customizable basemap designs and additional dataviz layers
Custom styles from Mapbox Studio drop into Tableau, so teams can align oceans, land, labels, and more with a brand or dataviz palette. Using custom styles is a clever way to extend the data visualization options within Tableau by creating a canvas for data visualization layers that do not need to take up space within the Tableau layers. Tableau also offers base styles (light, dark, satellite, offline) and supports additional layers like WMS.
Mapbox and Tableau in action
Tableau Principal Solutions Engineer, Ross Paulson, showcased several workflows and useful techniques in Tableau Desktop.
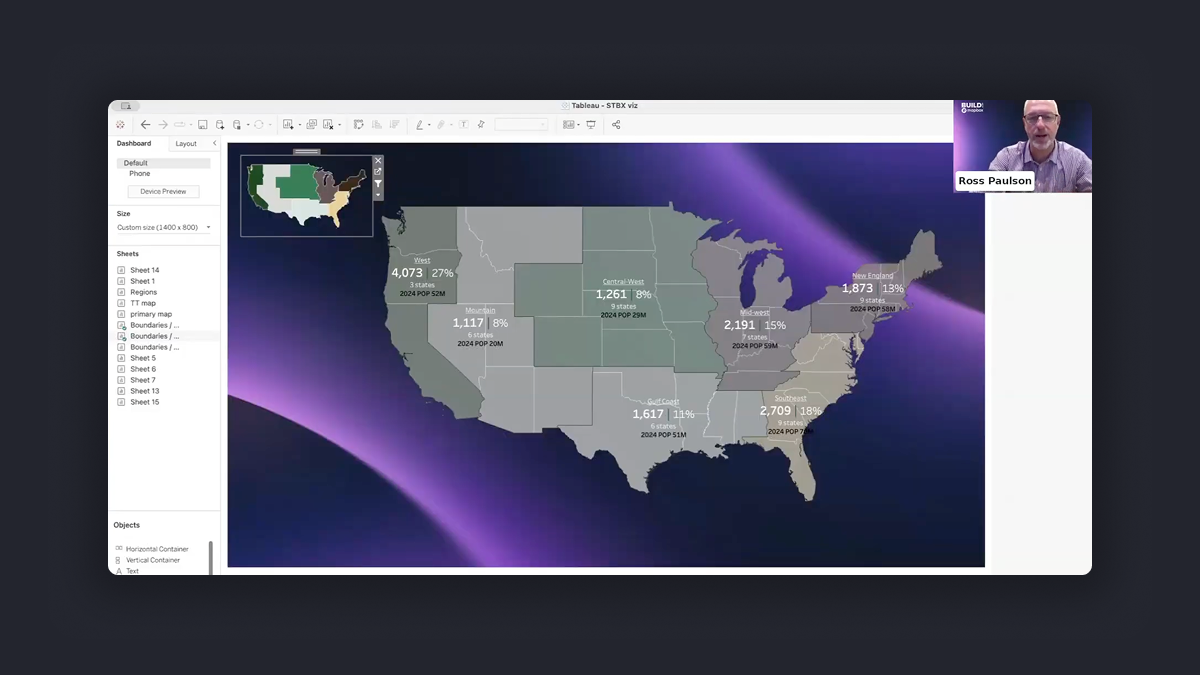
Retail footprint by state
.gif)
Starting from a simple points-on-a-map view, Ross created a state-level choropleth using Mapbox Boundaries - no external boundary files required. He then grouped the states into custom regions (example: “Central West”) to compare counts across analyst-defined territories.
Layered analysis
After this, Ross added exact store locations as a layer on top of polygons for deeper context. The dashboards blended multiple zoom levels (example: a U.S. outline beneath regional detail) for better orientation.
Styling and reuse
Ross applied the brand colors through a Mapbox Studio style and brought them into Tableau. He also showed how Tableau Public workbooks can be downloaded to inspect how a favorite map was built and reuse those styles as a TMS in Tableau.
Massive datasets

A visualization of 226 million rows of global fishing vessel positions highlighted how Tableau focuses on data while Mapbox provides performant basemaps and boundaries. For heavy boundary layers (like congressional districts), placing them in the background map shifts rendering work off the workbook and keeps the experience smooth. Parameters controlled endpoints and symbol sizes to explore density hot spots, such as the area between China and Taiwan.
Hexbin maps
Lastly, Ross called out density maps (hexbins) for fast, clear pattern detection on large point datasets.
Learn more about Mapbox Boundaries
Tableau pairs intuitive analytics with Mapbox maps and datasets to enhance tabular data with spatial insights – and Mapbox Boundaries tilesets are at the core of how the business intelligence platform achieves its remarkably user-friendly map-making capabilities.
Explore what is included within the Mapbox Boundaries datasets using the Mapbox Boundaries Explorer or request free sample data today.


Related articles
Drag, drop, edit, publish: A simplified workflow for custom data
Mission-ready mapping: Securely bring together maps, AI, and response