How to select a point of interest (POI) data provider
A practical framework for evaluating POI data quality, accuracy, and coverage to choose the best provider for location-based applications.

With the widespread adoption of AI technologies and the rapid pace of change in the data landscape, questions around data provenance and quality have become more critical than ever. Poor-quality data can significantly hinder performance in increasingly competitive environments. This blog outlines an approach to understanding and evaluating Points of Interest (POI) data, along with a framework for assessing data providers.
What is POI data?
Point of interest (POI) data is any set of data that pertains to a location that holds some value or significance due to their distinct characteristics or relevance to users - such as a café, hotel, fuel station, or landmark. POI data is typically considered to include more than just address data, with most providers including at least three basic attributes:
- Name: A label that can be used to refer to the POI, typically in a natural language way.
- Location: Data on the physical location of the POI, typically a set of geospatial coordinates, from which other geospatial information can be derived.
- Category: A label for the nature or type of POI. This can range from as simple and generic as just ‘POI’ through to a detailed category hierarchy e.g. Food > Restaurant > Japanese Restaurant > Ramen Restaurant. The POI category may be more or less important, depending on the use case.
Beyond these basic attributes, POIs can have a variety of additional metadata associated with them such as address, hours of operation, and popularity, among others.
Key questions when evaluating POI providers
Before assessing POI data providers, establish a clear evaluation framework. Helpful questions to consider include:
What problem(s) should the data solve?
The nature of the use case often dictates which data attributes are critical. For example, a navigation app has different needs than a platform focused on market segmentation. Navigation apps depend on comprehensive coverage of popular POIs with accurate routable points to help drivers choose and reach destinations with confidence. For market segmentation, rich brand and category metadata—ideally paired with popularity or traffic data—enables smarter audience targeting and location-based insights
What data provides the most value for end users?
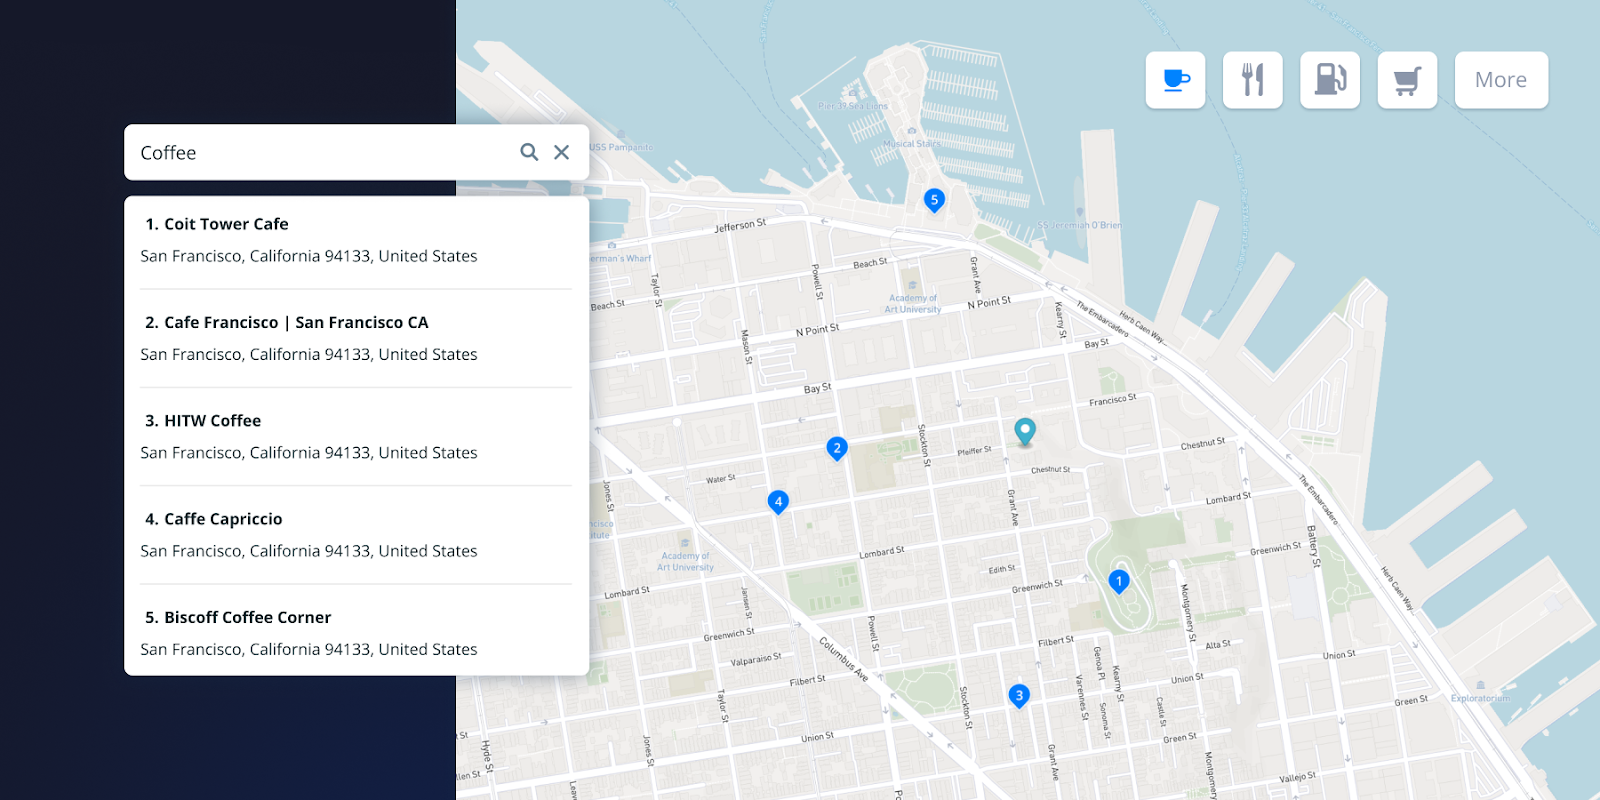
A restaurant finder app may need detailed data on restaurant business hours and pricing, but have no need for data on other categories of POIs like landmarks or parks. Telemetry mapping may prioritize location accuracy – ensuring the restaurant’s coordinates reflect its true physical location – while placing less emphasis on metadata such as pricing. A coffee shop locator may only require highly detailed data on cafes, making other POI categories irrelevant. Not all data is equally useful in every scenario; aligning POI attributes and categories with end-user goals is essential for building impactful experiences.
What coverage is required?
Global versus local needs can drastically change the expectations for POI data. If the focus is one city or region, data quality elsewhere may be less relevant.
What is the cost of data errors?
Consider the impact of inaccuracies. What happens if 10% of POIs have location coordinates that are off by more than 50 meters? Or if a POI is incorrectly shown as open when it is closed? Estimating error tolerance helps identify data risks and plan remediation strategies.
How to evaluate POI data
With a clear evaluation plan in place, the next step is to request sample datasets from potential data providers. Ideally, samples should come from regions relevant to the intended application and familiar enough to validate against ground truth. Avoid allowing providers to select sample regions, as this can result in skewed or unrepresentative datasets.
After receiving the samples, assessing their quality becomes essential. To guide this process, Mapbox Search Product Manager Cris Byers developed a practical framework for evaluating POI data—one that helps teams quickly identify strengths, weaknesses, and gaps in coverage or accuracy. The key principles are outlined below.
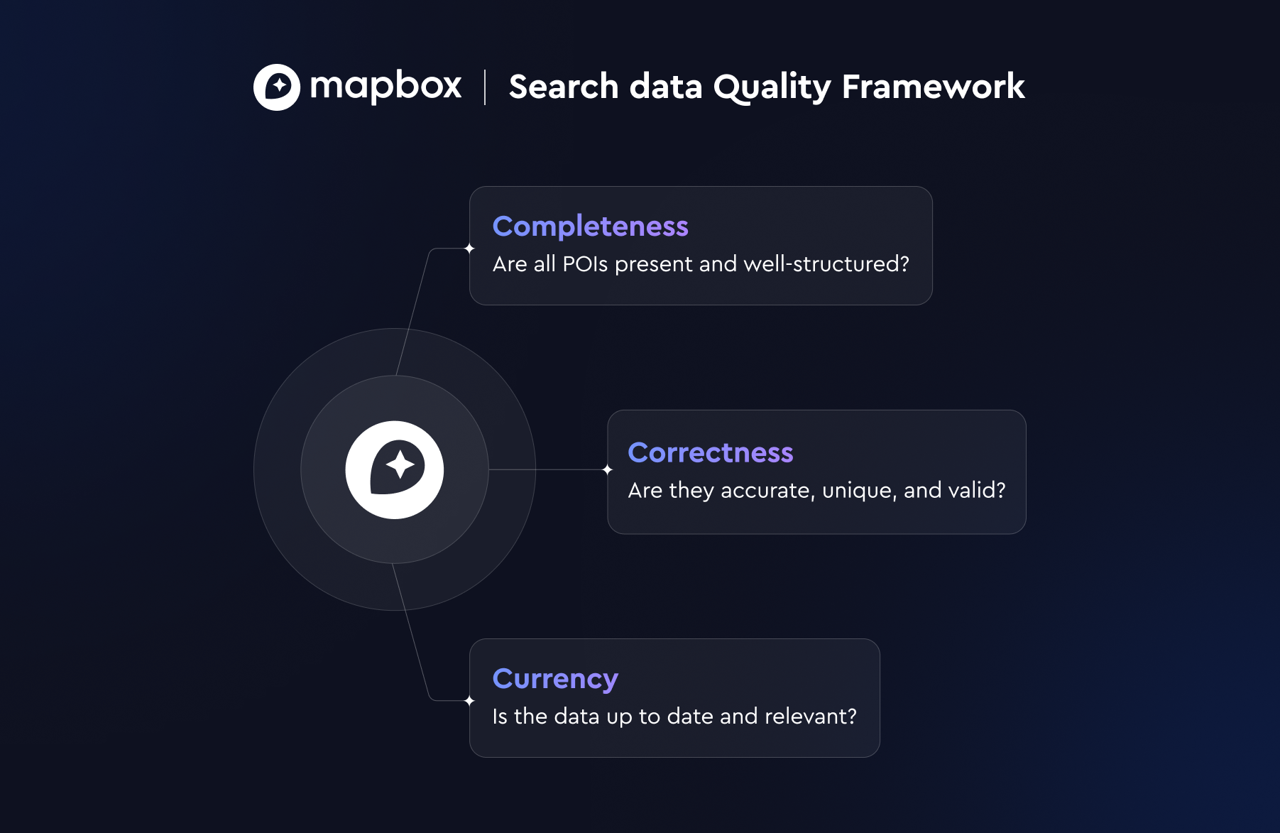
How Mapbox measures POI data quality with the 3 C’s Framework
Mapbox evaluates POI data quality using the 3 C’s Framework: Completeness, which assesses whether the dataset includes the full universe of expected POIs within a given geography along with all required attributes; Correctness, which examines how accurately the data reflects reality; and Currency, which considers how recently the data was updated and whether it reflects real-world changes such as store closures or new developments.
POI data quality #1 factor: Data completeness
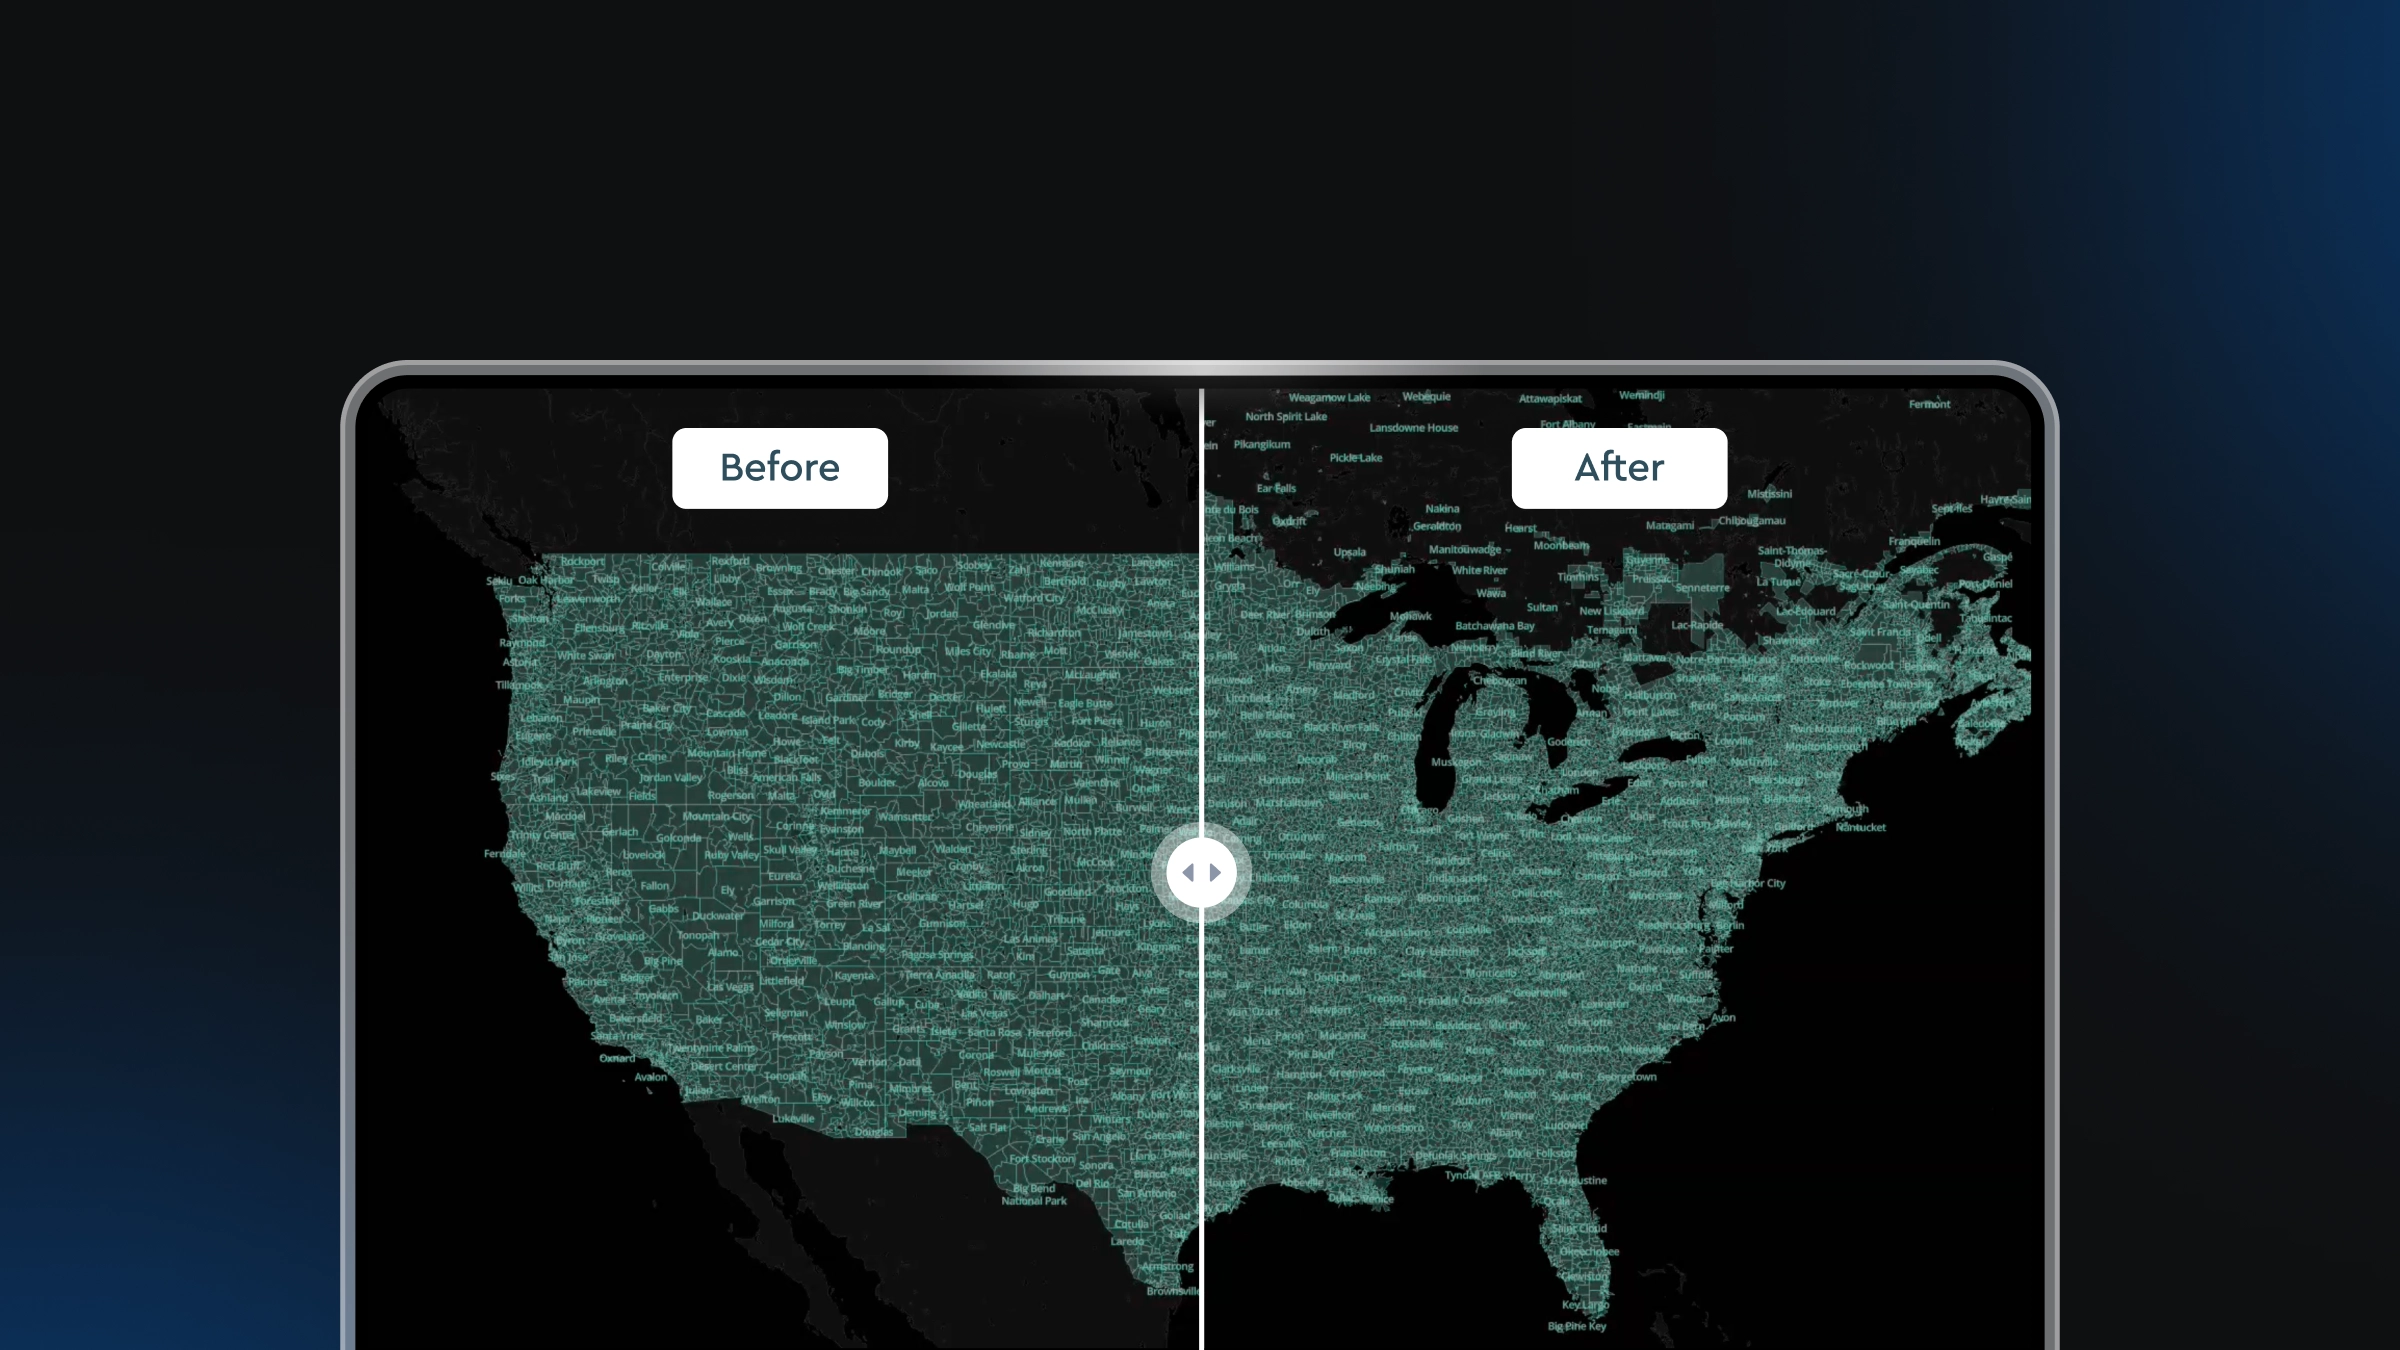
Completeness is often associated with the concept of coverage. However, completeness is not only about measuring the volume of data for a given area. Instead, the assessment should consider the unique records within a dataset compared to the full set of POIs that are expected to exist within a given geography.
Completeness also extends beyond the existence of records. For example, an address that includes a house number and street but omits city, state, or postal code is considered incomplete and may require additional processing to be usable. Attribute fill rates serve as one method for assessing whether records are sufficiently complete.
Fill rates and coverage numbers can be misleading if inflated by irrelevant or low-quality data. Therefore, completeness must be evaluated in conjunction with the next core metric of quality: correctness.
POI data quality #2 factor: Correctness
To evaluate data correctness, consider the quality of data in terms of accuracy, validity, and uniqueness.
Accuracy reflects how closely the data matches real-world conditions. Examples of accurate data include a location coordinate that precisely aligns with the rooftop of the associated building. A counterexample would be an address containing the wrong street name relative to the building it represents. In practice, address interpretation often exists within a quasi-subjective reality, where multiple “correct” versions may coexist—such as streets known by both local and official names, or neighborhoods lacking clearly defined boundaries. In such cases, accuracy often comes down to identifying which version users are more likely to seek.
Measuring accuracy is challenging, as true ground-truth data can be difficult to obtain. Comparisons are frequently made against third-party sources; however, these references are not always reliable unless they serve as the canonical authority. It's important to select comparative sources carefully, prioritizing those with verified accuracy and official recognition.
Validity refers to adherence to expected data formats and rules. Common validity issues include reversed geospatial coordinates or inconsistent formatting in street names and house numbers. Variations often occur across regions; for instance, address ordering differs between francophone and anglophone countries. For each geography, a formatting standard should be defined and used to assess conformity. If the overall dataset quality is acceptable, transformation logic can be applied to align with internal standards during ingestion.
Uniqueness assesses the degree to which the POI data includes duplicate records. Duplicate entries may erode user trust and artificially inflate coverage statistics. Uniqueness should be assessed based on the data’s hierarchical level. For example, multiple valid unit addresses may exist for a single street address and share coordinates. Establishing the hierarchy early in the evaluation process helps ensure consistent analysis.
POI data quality #3 factor: Data currency (or Freshness)
Currency of POI data refers to the freshness of data updates. Location data such as addresses, POIs, and boundaries change regularly, sometimes very frequently. Cities expand, new neighborhoods are built, streets are renamed, businesses close and open. For instance, approximately 137,000 new businesses launch globally each day.
Currency can be measured by checking the timestamps for the most recent update in the dataset. However, update frequency is often uneven: a database may show a recent refresh date, while only a small subset of records has actually changed. To properly assess currency, sample records should be compared to alternative data sources on real-world changes. Restaurants represent a particularly effective category for evaluating currency, as they frequently open and close. For example, comparing a list of new restaurants that opened within the last six months with the list of restaurant POIs present in the POI dataset can provide a practical benchmark of overall data currency.
Because geospatial data is inherently impermanent, currency should be regularly re-evaluated, which requires maintaining an up-to-date reference set.

Putting the framework into practice
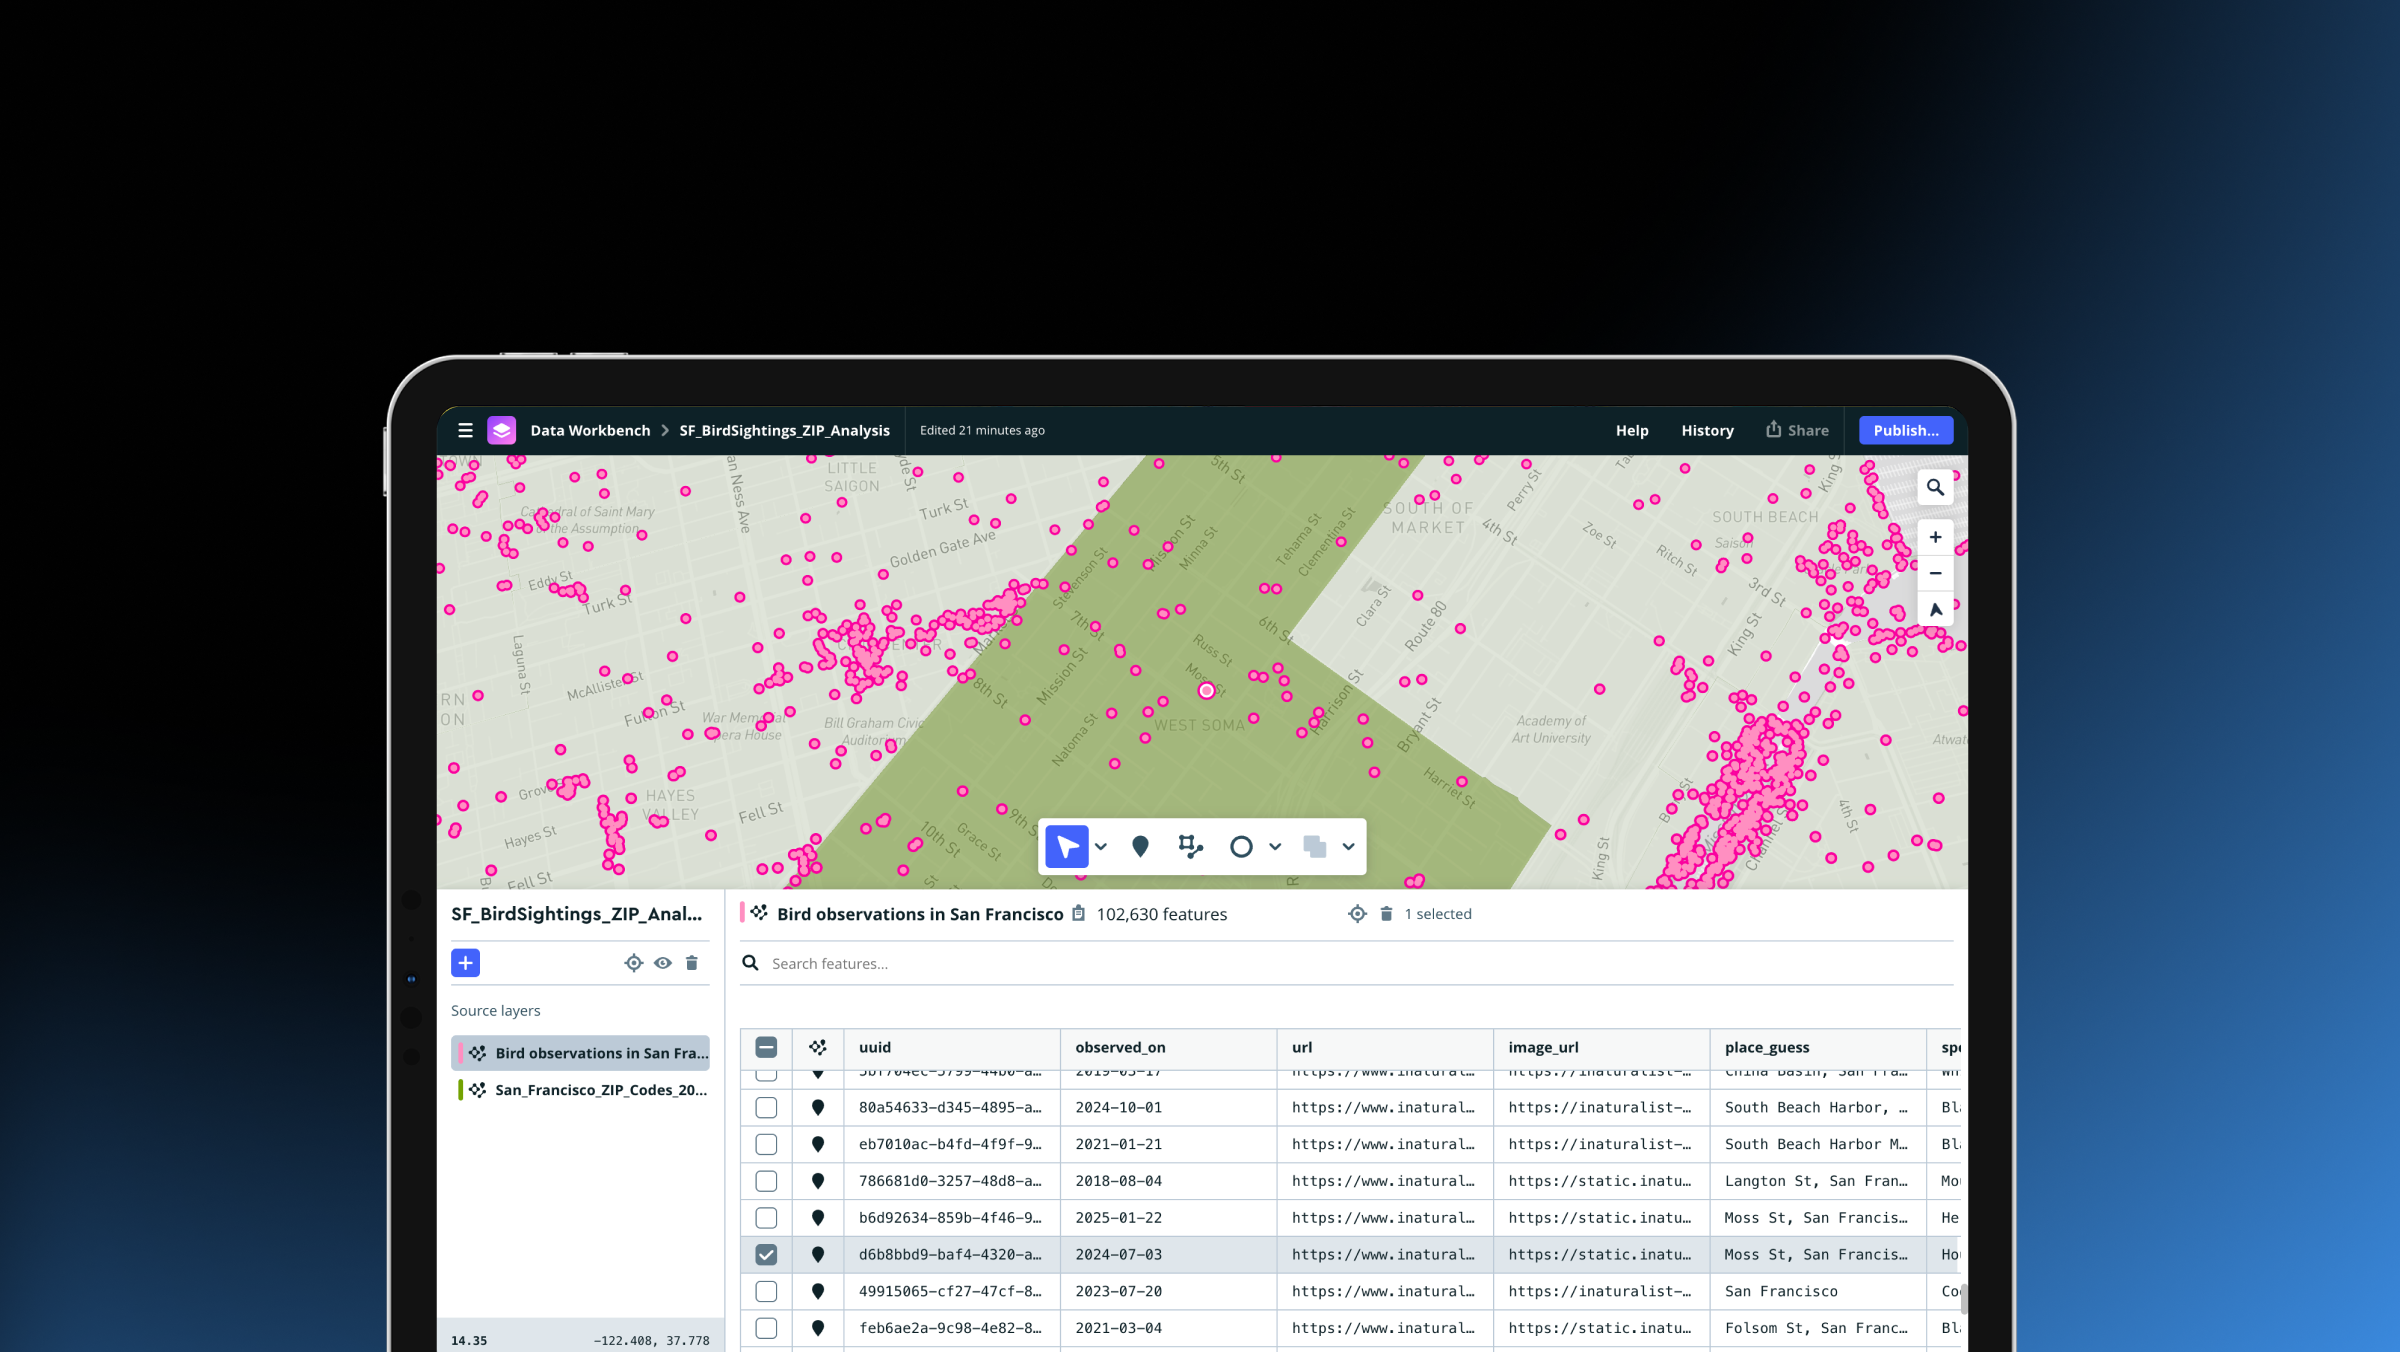
Now that the metrics are defined, the next step is to apply them. Load the data sample – ideally from a familiar area – into a map visualization tool such as kepler.gl. Visual inspection often reveals issues quickly. With the map in view, begin evaluating the dataset using the 3 C’s.
- Completeness: Are there missing POIs? Are there POIs that were never really there to begin with? Do the missing or junk POIs share a particular category?
- Correctness: Are the POIs in the right locations? Do they have the right category/icons?
- Currency: Are there POIs missing that recently opened? Are there POIs displayed that are no longer there or moved?
A visual inspection can provide an initial sense of a dataset’s strengths and weaknesses, but it is only a starting point. The next step is a deeper analysis informed by those visual observations. Run targeted tests to uncover specific issues or validate assumptions — using the 3 C’s as a guide:
Completeness
- Do the counts of POIs for each category align with a trusted canonical source (e.g., US census numbers, verified business listings)?
- How does the number of POIs compare to the population of the corresponding geographic area?
- Are known POIs within a given category represented in the dataset?
- When sorting the dataset by name, are duplicate entries present?
- What are the fill rates for key attributes across the dataset?
Correctness
- Do basic pattern-matching tests confirm that address formats adhere to expected standards? Are postal codes properly formatted?
- When sorting text attributes such as category or brand, do edge values reveal typographical errors (e.g., the error “retsaurant” appearing near the correct “restaurant”)?
- Are there attribute values that fall outside logical ranges (e.g., negative prices, operating hours exceeding 24 or 12 inconsistent with AM/PM conventions)?
- How many POIs share identical coordinates — commonly referred to as “point piles” or “stacked points” — suggesting potential duplicates or location precision issues?
- Are any well-known POIs incorrectly categorized? If so, how many?
Currency
- Are recently opened restaurants or other frequently changing POIs included in the dataset? What is the most recent addition?
- Are closed or relocated venues still represented in the data? What is the oldest outdated POI still present?
Once testing is complete, evaluate whether the dataset meets the application’s needs or would require significant cleanup. In addition to data quality there are some things to consider:
- License terms: Ensure the data can be used as intended, and understand implications for derivatives or modified versions.
- SLAs and support: What remediation timelines and guarantees are offered?
- Data update frequency: How often is the dataset refreshed and how quickly are corrections made?

Building with Mapbox POI data
Armed with this framework, informed decisions can be made about POI data selection. For teams evaluating POI search solutions, Mapbox Search Box offers a dependable, developer-friendly option. With over 375 million addresses and 170 million POIs globally, Search Box delivers high-quality data refreshed weekly – including addresses, places, and POIs – to power smarter, more reliable location experiences. Learn more at mapbox.com/search.

Related articles
Drag, drop, edit, publish: A simplified workflow for custom data
Mission-ready mapping: Securely bring together maps, AI, and response