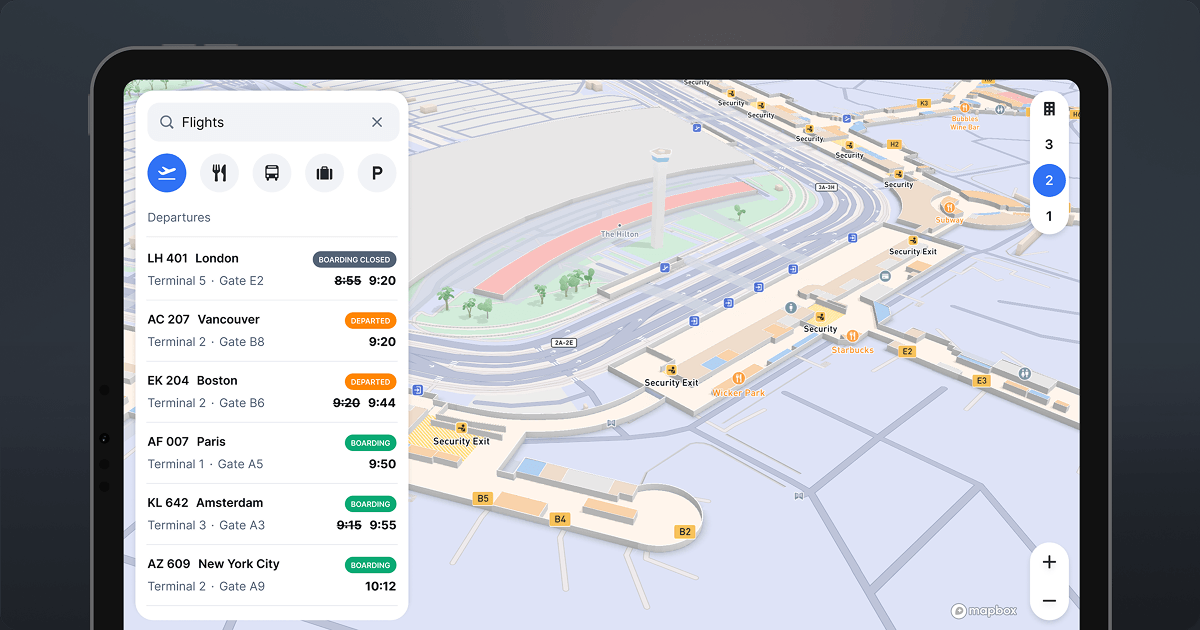
Create web maps
with GL JS

Mapbox GL JS is a JavaScript library for vector maps on the web. Its performance, real-time styling, and interactivity features set the bar for anyone building fast and immersive web maps.

Getting started is easy

Start building a web map in minutes using our quick start example.

let map = new mapboxgl.Map({
    container: 'map',
    center: [-123.1121, 49.2569],
    zoom: 10,
    style:
    'mapbox://styles/mapbox/streets-v11',
    accessToken: '<your_access_token>'
});

map.addControl(
    new mapboxgl.NavigationControl());
Quick start example

3D Maps

GL JS is engineered to render even the most detailed, feature-dense maps at 60 FPS on both desktop and mobile devices. The v2 release takes it even further, introducing 3D into any map seamlessly. Improved tile load times and progressive rendering ensure optimized performance across devices.

Design without limits

Style your map with lines, polygons, labels, icons, patterns, extrusions, raster & terrain with hundreds of options and a powerful expression language, not only controlling all visual aspects through the zoom range but having the freedom to change them at any time dynamically.

Globe view

With Globe view, you can realistically display phenomena that are continental in scale, from tracking the worldwide movement of ships, planes, and packages, to visualizing weather and climate data.

Localize your maps with internationalization

Reduce custom styles, save time, and deliver web maps to a global audience based on the system level settings for local language and worldview. 34 languages and eight worldviews supported. Internationalization is currently in Private Preview. If you’d like access to the feature please reach out to your Account Manager or contact us.

Read more

Adaptive projections

Present your data accurately with a range of projections such as Albers, Lambert and Winkel Tripel, now reimagined for the modern interactive maps era. Adaptive projections drastically reduce the distortion of the world, gently adapting to zoom level to maximize precision across all zoom levels.

3D Terrain and Camera API

Every map is automatically adjusted and aligned with terrain and markers clamp to the ground. Touch and mouse gestures adjust for 3D terrain to provide a smooth and predictable user interaction. Low-level camera code allows developers to fine-tune details where the map can be tightly coordinated with other UI elements, transitioning smoothly and precisely.

Faster map load performance

GL JS has improved map load by 30% on average, and in some styles more than 50%. With improved prioritization of resource loading and task distribution, maps load faster and leave more CPU resources available for the web application.

Two charts comparing map load time for GL JS v1 and v2.

Fully interactive

Create rich, powerful interactive mapping experiences by smoothly adjusting your map to changing context and exposing any map features for user interaction or data analysis.

Data visualization at scale

Use heatmaps, clustering, data-driven expressions and other GL JS features to visualize your data at scale never possible before, while keeping it fully interactive. The library uses high-performance algorithms to be able to process millions of features for rendering, coming both from vector tile sources & external GeoJSON files.

A graph comparing effectiveness of the new Digital Elevation Model to previously used terrain-rgb data.

High performance DEM

The new Mapbox Raster Data API service provides high performance Digital Elevation Model (DEM) tiles to power the terrain elevation and hillshade rendering. Terrain tile sizes are now reduced by 50% compared to the legacy terrain-rgb data, corresponding to a 35% improvement in hillshade layer rendering -- all part of the new GL JS web SDK.

3D environment and lighting

Add depth and realism to your maps with the sky, fog and sun position APIs.

trusted by the industry leaders

Frequently Asked Questions

What is Mapbox GL JS?

Mapbox GL JS is a JavaScript library for interactive, customizable vector maps on the Web. It renders map data from Mapbox Vector Tiles, using the Mapbox Style specification and hardware-accelerated graphics (WebGL).

Mapbox GL JS is part of a cross-platform ecosystem, which also includes native SDKs for applications on Android and iOS. Map styles can be authored and edited using Mapbox Studio.

What are the use cases for Mapbox GL JS?

Mapbox GL JS is designed for building rich, interactive maps with vector data. With GL-JS, you can make:

  • Custom designed map styles with your own data on an interactive map
  • Store locator: Display thousands of points on a map, clustering them at lower zoom levels
  • Storytelling: Use interactive camera and dynamic style & data updates to power your data visualization
  • Dashboard for location-based data visualization
  • Data visualization editor
  • Markup and map editor
  • Querying features on a map
  • Live asset tracking
  • Maps for route planning & navigation
  • Interactive news maps

What browsers are supported?

Mapbox GL JS is supported on all modern browsers when hardware-accelerated rendering (WebGL 1.0) is available, including current and recent versions of Google Chrome, Microsoft Edge, Mozilla Firefox, and Safari on desktop and mobile operating systems, with the exception of Internet Explorer 11 which is no longer supported on v2 and later versions.

The mapbox-gl-supported module and the `mapboxgl.supported` method can be used to determine if a browser supports GL-JS. 

In cases where GL-JS is not supported, consider using the Static Tile API or Static Image API as a fallback.

How do I get started using Mapbox GL JS?

Signup for a free Mapbox account, then head over to the getting started documentation at: https://docs.mapbox.com/mapbox-gl-js

What are the new features in Mapbox GL JS v2?

Mapbox-GL-JS v2 (GL-JS v2) is the next generation of our vector-tile based maps SDK for browsers. It includes:

  • Performance improvements With a faster time to load the map library and to render the initial viewport.
  • 3D rendering Rendering vector maps with terrain elevation and sky layers.
  • Free form camera The free form camera API allows you to explicitly position the camera in three dimensions.

What are the performance improvements in Mapbox GL JS v2?

Mapbox GL JS v2 improves map load time over 50% in some styles, and introduces progressive rendering of the map to improve perceived map load time. Progressive rendering makes the page feel faster and lets users interact with the map before it has fully loaded.

Map loading also takes up less time on the browser’s main Javascript thread, leaving more resources for the rest of your web application to continue loading.

Progressive loading of map content allows layers like land and water to be rendered earlier for both the initial load and during zooming, panning, and animations. This also improves the experience of map interactions (zooming and panning) and animations.

The size of the improvement depends on map size, network conditions, and hardware. In our benchmarks, a map that may have loaded in 1900ms in v1, loads in 1350ms in v2. The speed index, a measure of when map content starts to display, is 35% faster as well.

What can I do with 3D rendering in Mapbox GL JS v2?

Mapbox GL JS v2 enables an immersive 3D mapping experience. You can drape  satellite images or vector layers over terrain data to visualize the map in three dimensions.

You can build a map experience that: 

  • Flies through the world following a drone flight path using the free form camera API.
  • Displays the signal coverage of cellular tower models on top of 3D terrain.
  • Shows a changing sky and horizon with real-time weather conditions and time of day.

What are the new features or improvements for 3D rendering?

The 3D mapping features included in this release are:

  • Increased Map pitch (tilt) from 60° to 85°
  • A terrain global property in the style that adds elevation to all layers
  • A sky layer type in the style to model the horizon and affect the lighting on fill-extrusion layers

What is the free form camera API?

The free form camera is a new low-level API for controlling the camera and its view of the map. You can use FreeCameraOptions to implement your own camera manipulation and animation logic at the application level. The set of exposed camera parameters allows integrating camera movement with different platform animation systems. Developers with experience in any standard 3D engine/software should immediately feel at home.

What can I do with the free form camera?

The free form camera enables moving and animating the camera without requiring an  exact latitude and longitude in the center of the scene. This is useful for motions that ignore a focal point, have multiple foci, or dynamically update the focal point. It's also useful for smooth, relative motion of the view direction, like in sweeping rotations, flying, or easing among multiple focal points.

The camera can follow along an aerial flight path, track ground-based objects with constant camera velocity, or build kiosk animations rotating around a fixed point of interest. This API also makes it easy to synchronize cameras between multiple SDKs or other application states.

Which map projections are supported?

Developers can select from the following display projections when creating a style or instantiating a map object:

  • Albers (“albers”)
  • Lambert Conformal Conic (“lambertConformalConic”)
  • Equal Earth (“equalEarth”)
  • Natural Earth (“naturalEarth”)
  • Winkel Tripel (“winkelTripel”)
  • Equirectangular (“equirectangular”)
  • Mercator (“mercator”, the default)

All projections are compatible with existing tile sources and map styles, except those using 3D terrain, fog and custom layers, a limitation that will be addressed in future versions.

What pricing is available with GL JS?

Mapbox GL JS is billed by Map loads. A Map load is counted every time Mapbox GL JS initializes on a webpage or in a web application. Each map load includes unlimited vector, raster, and terrain tile API requests.

The first 50000 map loads are free per month, then start at $5 per 1000 map loads with incremental volume-based discounts available for usage over 100000, 200000 and 1000000 map loads per month.

You can see more pricing information at https://www.mapbox.com/pricing/.

Do I pay by the number of map tiles loaded?

No. Each map load includes unlimited tile requests for the length of the map session.

Offline Caching

Mapbox GL-JS does not support offline usage. The tiles returned by the Vector, Raster, and Terrain APIs can be cached on client devices for up to 30 days. If you require a fully offline solution, or a longer cache period, contact us.

What are some upcoming features of Mapbox GL JS?

We are evaluating customer demand for the following features in 2022:

  • Rendering elevated lines
  • Rendering symbols with leader lines
  • Improvements to data update performance
  • Improvements to terrain lighting