Back to all cases
Mapbox Boundaries helps DataKind deliver accessible insights with 50% faster load times and 58% higher engagement.
Key benefits of building with Mapbox
- Cut load times by 50% for DataKind’s mapping analysis products
- Grew monthly active users by 58% by making complex data accessible to a broader audience.
- Eliminated a 15% census-tract rendering error
products used
About DataKind
DataKind tackles the world’s toughest challenges with data science and AI. Its scalable tools help resource-constrained nonprofits solve complex challenges in education, health, and housing - making insights usable for people on the front lines. Current product development focuses on four domains: Education, Economic Opportunity, Frontline Health, and Humanitarian Response.
Building on a legacy of service, DataKind designs practical, accessible products with and for practitioners. Decades of collaboration with New America, Second Harvest Food Bank of Central Florida, and Enterprise Community Partners underscore a mission to strengthen communities and improve lives.
Making complex data accessible for all
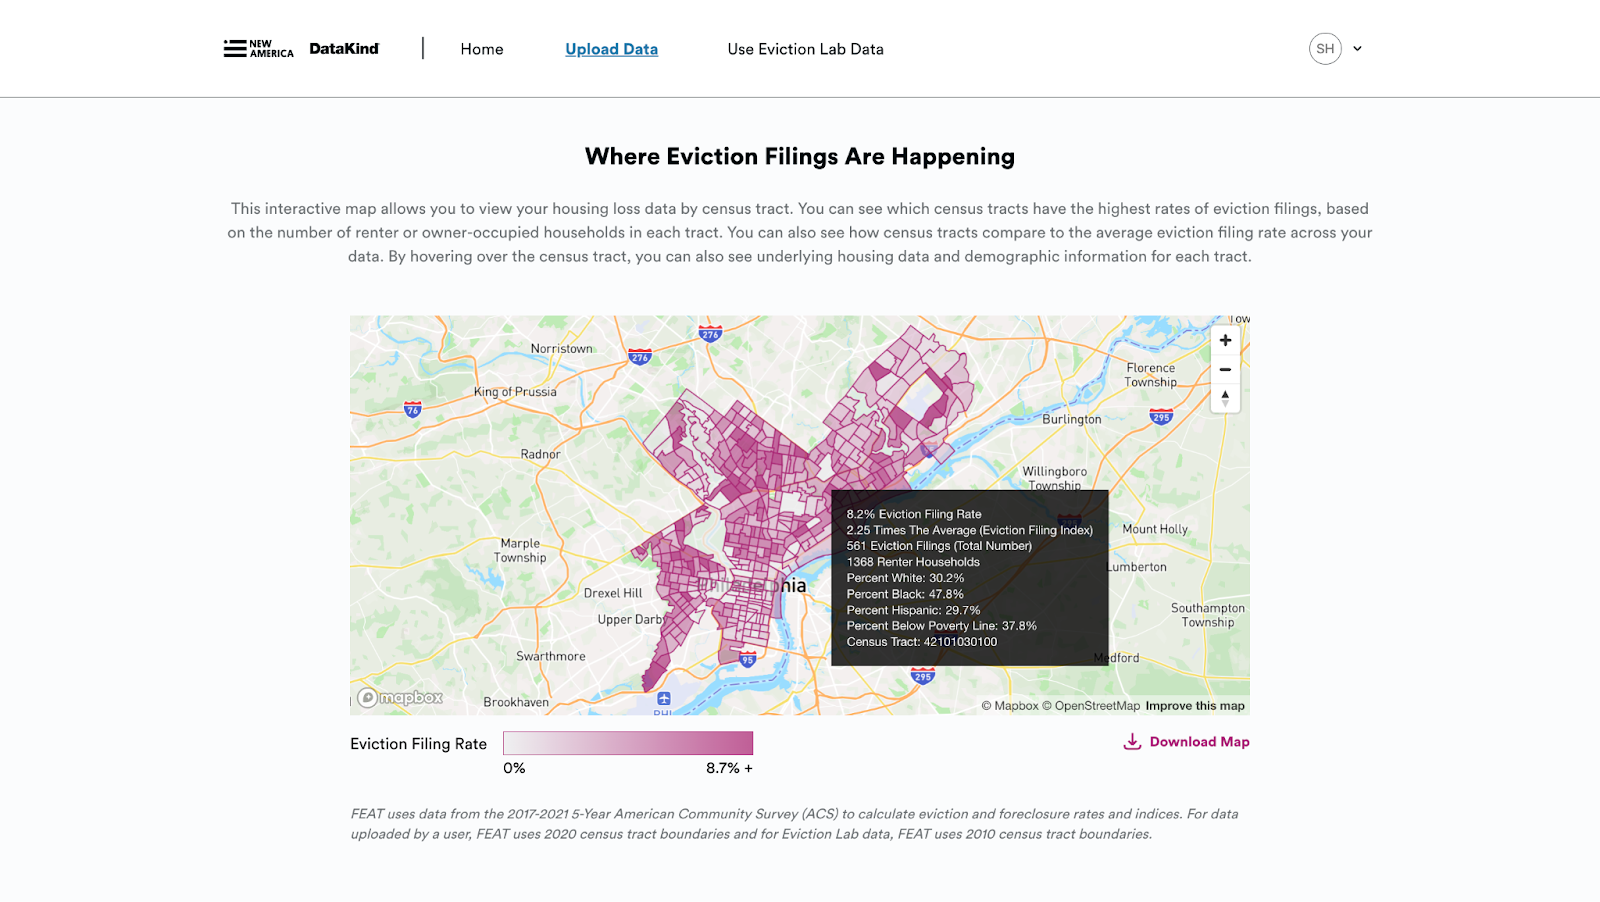
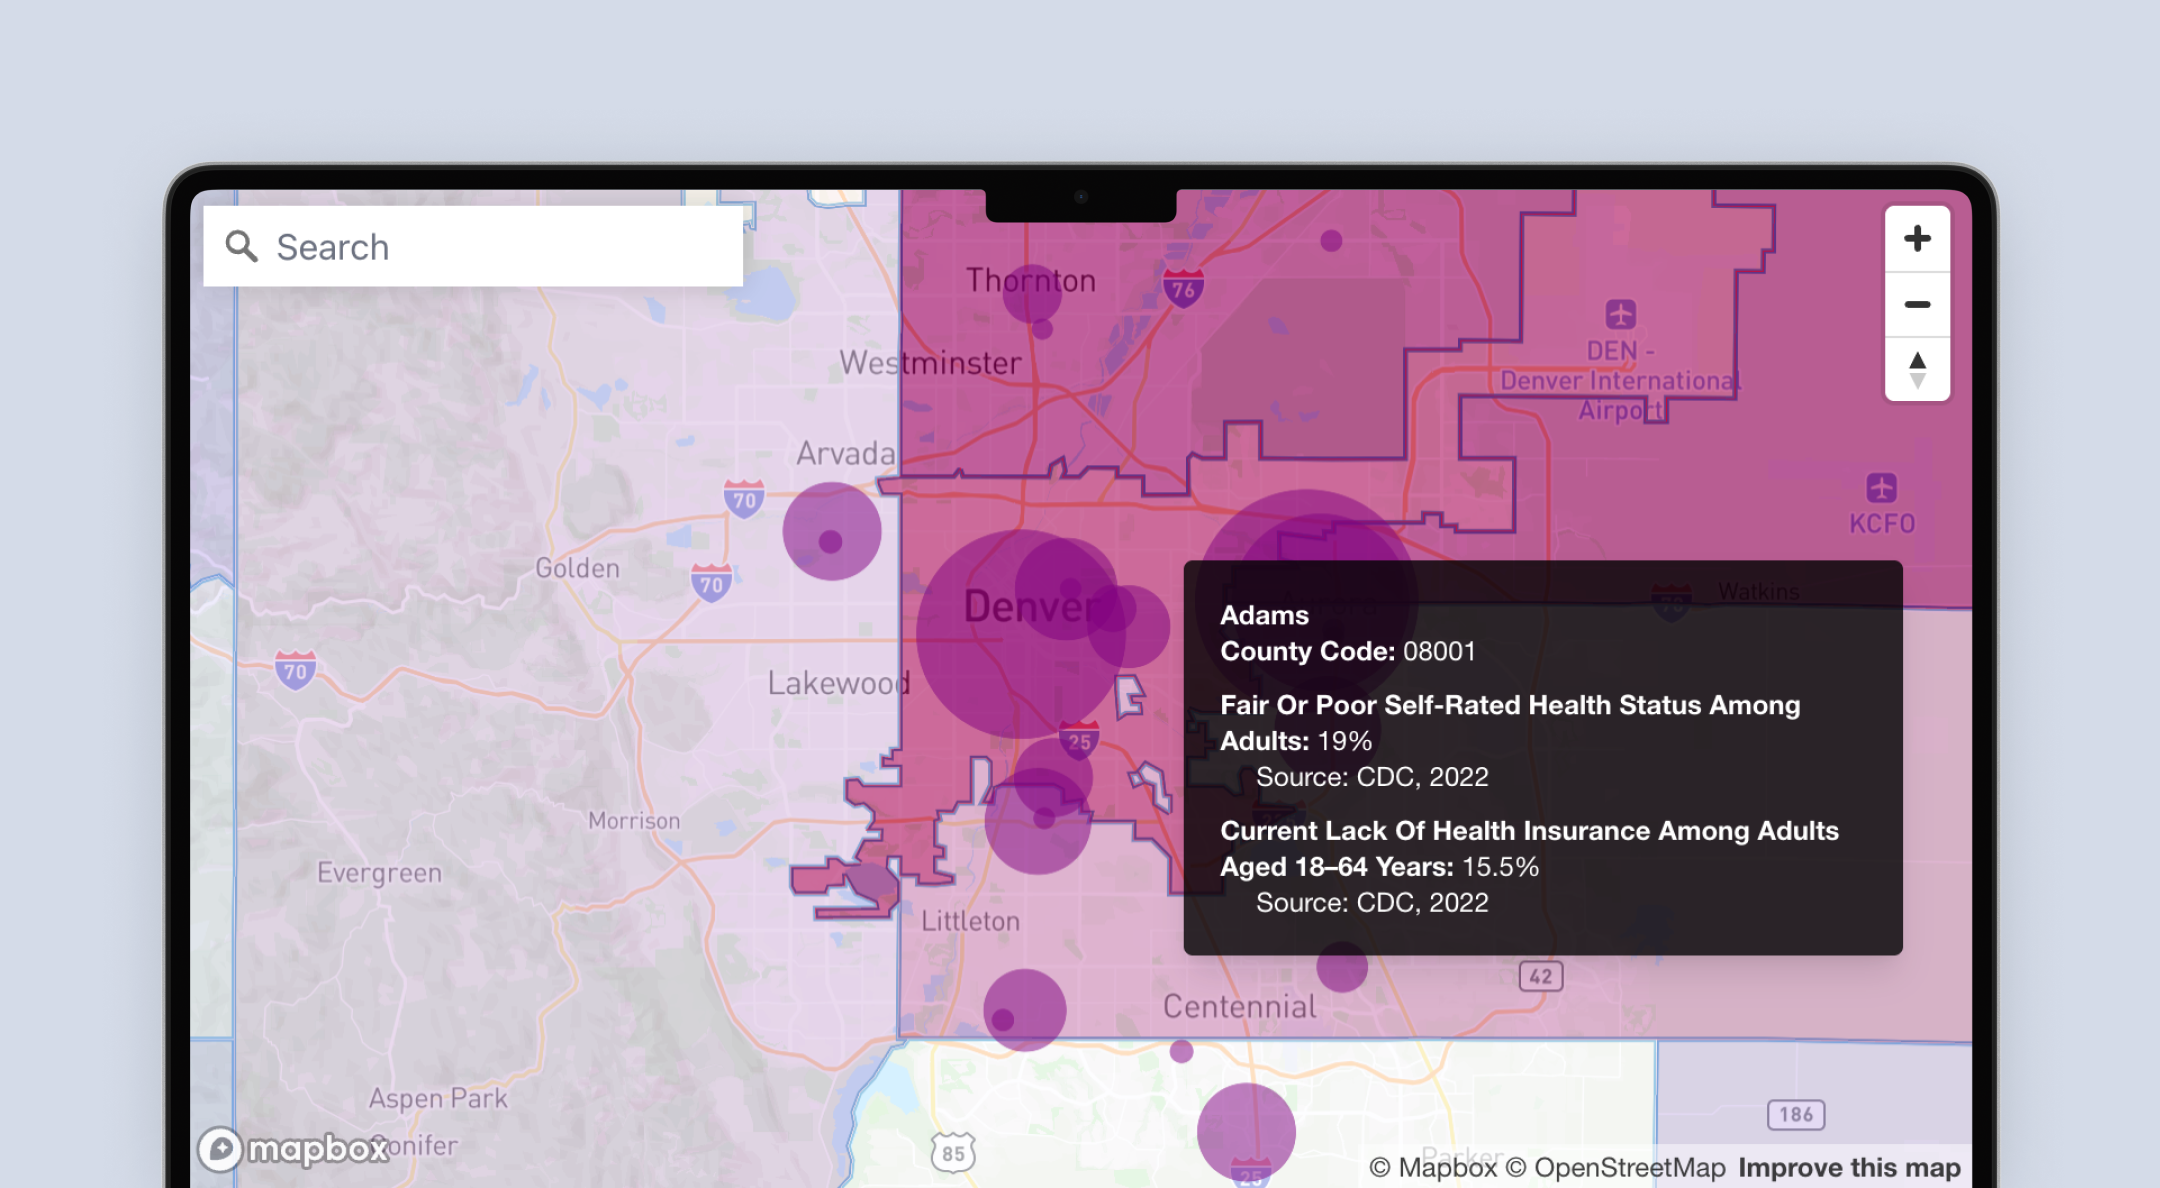
In partnership with New America, DataKind set out to scale the Foreclosure and Eviction Analysis Tool (FEAT) — a powerful resource for housing stability that initially required technical expertise to operate. Without an intuitive interface, adoption remained limited to a small group of data specialists, even as a loyal user base called for stronger, map-first visualizations.
The organization’s next product, Ladder, co-designed with Second Harvest Food Bank of Central Florida, needed to visualize relationships between food insecurity and health outcomes across thousands of census tracts. Both FEAT and Ladder required a mapping solution capable of rendering highly granular data at scale, without sacrificing performance or usability.
Building with Mapbox for performance and clarity
Choosing the right platform was critical for scalable adoption across a diverse audience. After evaluating multiple mapping options, DataKind’s research showed that traditional GIS tools alienated many users. They needed an interface that felt approachable to housing officials, food bank coordinators, data journalists, and volunteers — while still supporting serious analysis. Mapbox provides that balance: clean and familiar, yet analytically robust.
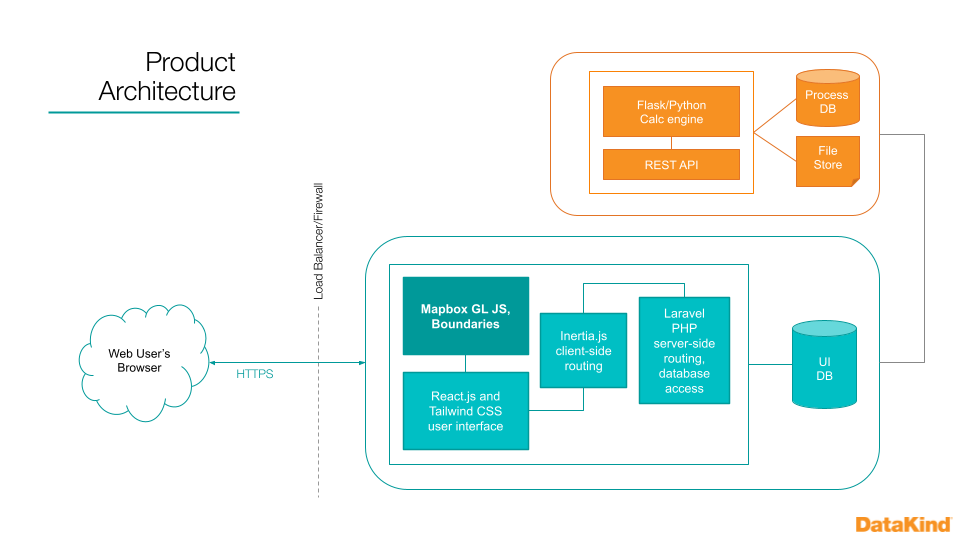
In a prior collaboration with the Black Wealth Data Center, DataKind had discovered the reliability and visual performance of Mapbox. With web architecture standardized on React.js, Mapbox GL JS delivered seamless integration for data-intensive applications.
We needed one mapping solution that works for everyone – from county housing officials to food bank coordinators and data journalists. Mapbox does exactly that.
Shanna Lee, Sr. Director, U.S. Communities Programs, DataKind
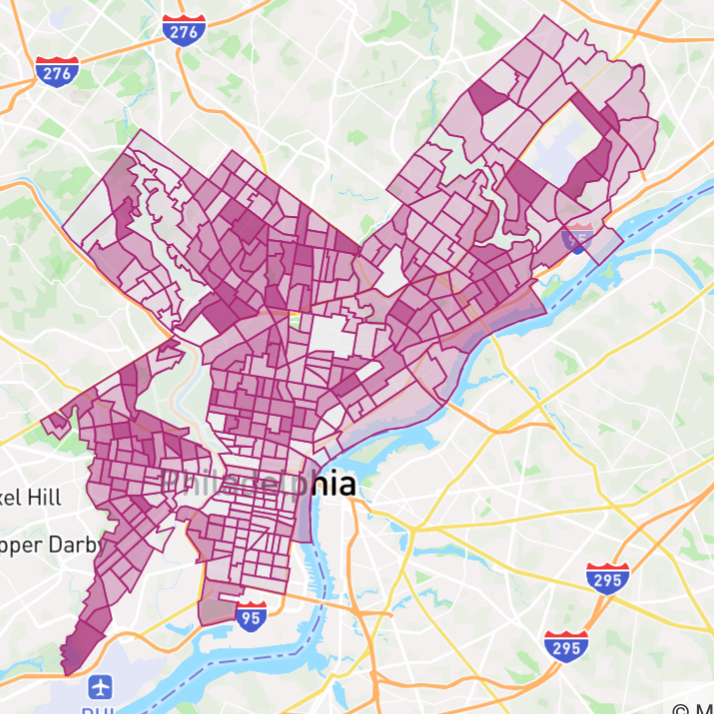
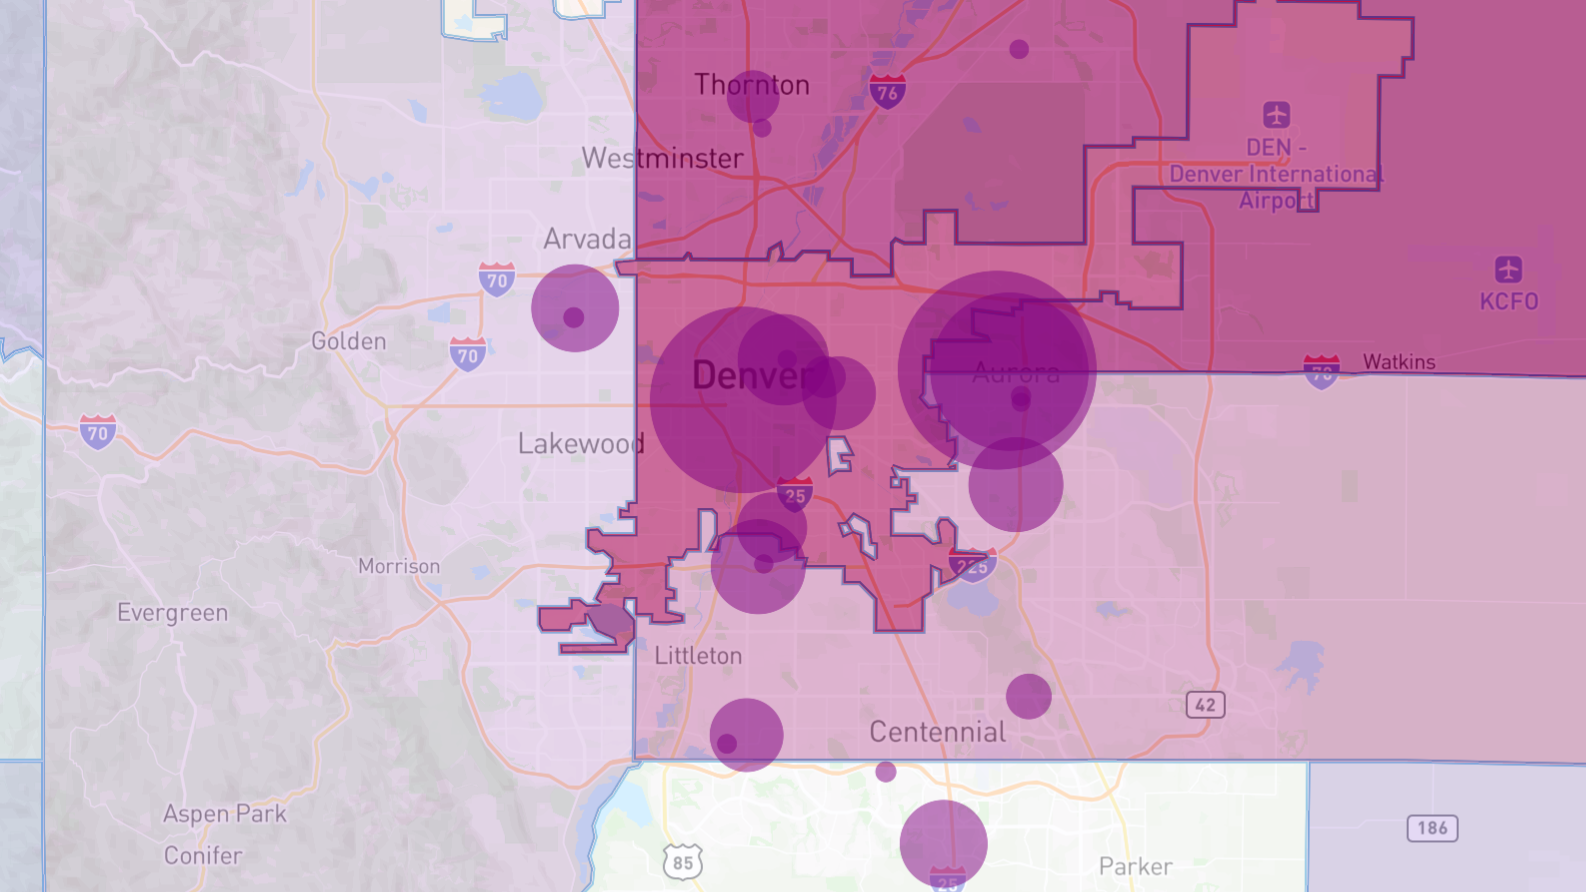
Mapbox Boundaries became essential for rendering census tracts, ZIP codes, counties, and congressional districts at speed and precision. Mapbox Search and the Geocoding API accelerated wayfinding and address lookups. Replacing slow Census TIGERweb calls with Boundaries vector tiles resolved FEAT performance bottlenecks and enabled a shift from static, command-line analysis to interactive, map-first insights.
Mapbox boundaries data performance is unbeaten. Mapbox handles massive datasets at highly granular boundary levels without blinking, and resolved FEAT’s performance issues — clearing the path for future products that put mapping analysis at the center.
Sophia Harms, Director, Engineering, U.S. Community Products, DataKind
Streamlined implementation and reusable architecture
DataKind standardized on React and Mapbox GL JS, creating reusable map components that power consistent experiences across applications. Mapbox Boundaries visualizes tract-, ZIP-, and county-level data essential for housing and health analysis, while the Geocoding API accelerates address searches and region lookups. This approach eliminated external data dependencies, simplified architecture, and accelerated future product launches.

In Ladder, all geographic analysis runs natively, removing external data warehouses and simplifying the architecture — an approach now guiding future products. Reusable, modular map components support rapid development and a consistent UX across projects.
A built-in data uploader enables CSV import and immediate overlay onto Boundaries, with optional point/address layers. This allows practitioners to combine official small-area statistics (e.g., census-tract health indicators) with organizational data (e.g., clinic locations sized by annual patients) for rich, comparative analysis at community scale.
Turning insight into measurable impact
Mapbox Boundaries has been transformative in advancing DataKind’s mission to make data tools more inclusive and effective:
- Cut load times by 50% for detailed census-tract-level visualization
- Increased FEAT monthly active users by 58%
- Eliminated a persistent 15% rendering error
By improving speed, accuracy, and usability, Mapbox helped DataKind ship five additional applications in one year — amplifying impact across sectors. In 2021, with New America and Central Florida’s Evictions and Foreclosures Group, FEAT mapped Orlando’s highest-risk neighborhoods at Rep. Anna Eskamani’s request, enabling targeted outreach for Emergency Rental Assistance. Ladder turns place-based data into action by pinpointing overlap between food insecurity and poor health in Central Florida; informing housing stability strategies with Enterprise Community Partners in California; training NYC providers to align economic, legal, and health services to neighborhood needs; and featuring at Feeding America’s inaugural SONA Conference as a model for cross-sector collaboration.
With Mapbox Boundaries, DataKind’s products empower users to visualize the data that describes their work and their communities. This enables organizations to scale their impact by identifying where there is need.
Sophia Harms, Director, Engineering, U.S. Community Products, DataKind
A future built on data equity
DataKind’s evolution from mapping data in external warehouses to performing analysis directly within Mapbox represents a new frontier for social impact technology. With Mapbox Boundaries at its core, the organization is expanding capabilities for real-time, address-based visualization - making sophisticated analysis faster to produce and accessible to a broader set of practitioners, accelerating impact. Mapbox continues to support DataKind’s mission to build tools that can grow, adapt, and scale so that social impact organizations everywhere can benefit.


.jpeg)