From upload to styled data layers in seconds: Smarter styling defaults in Mapbox Studio
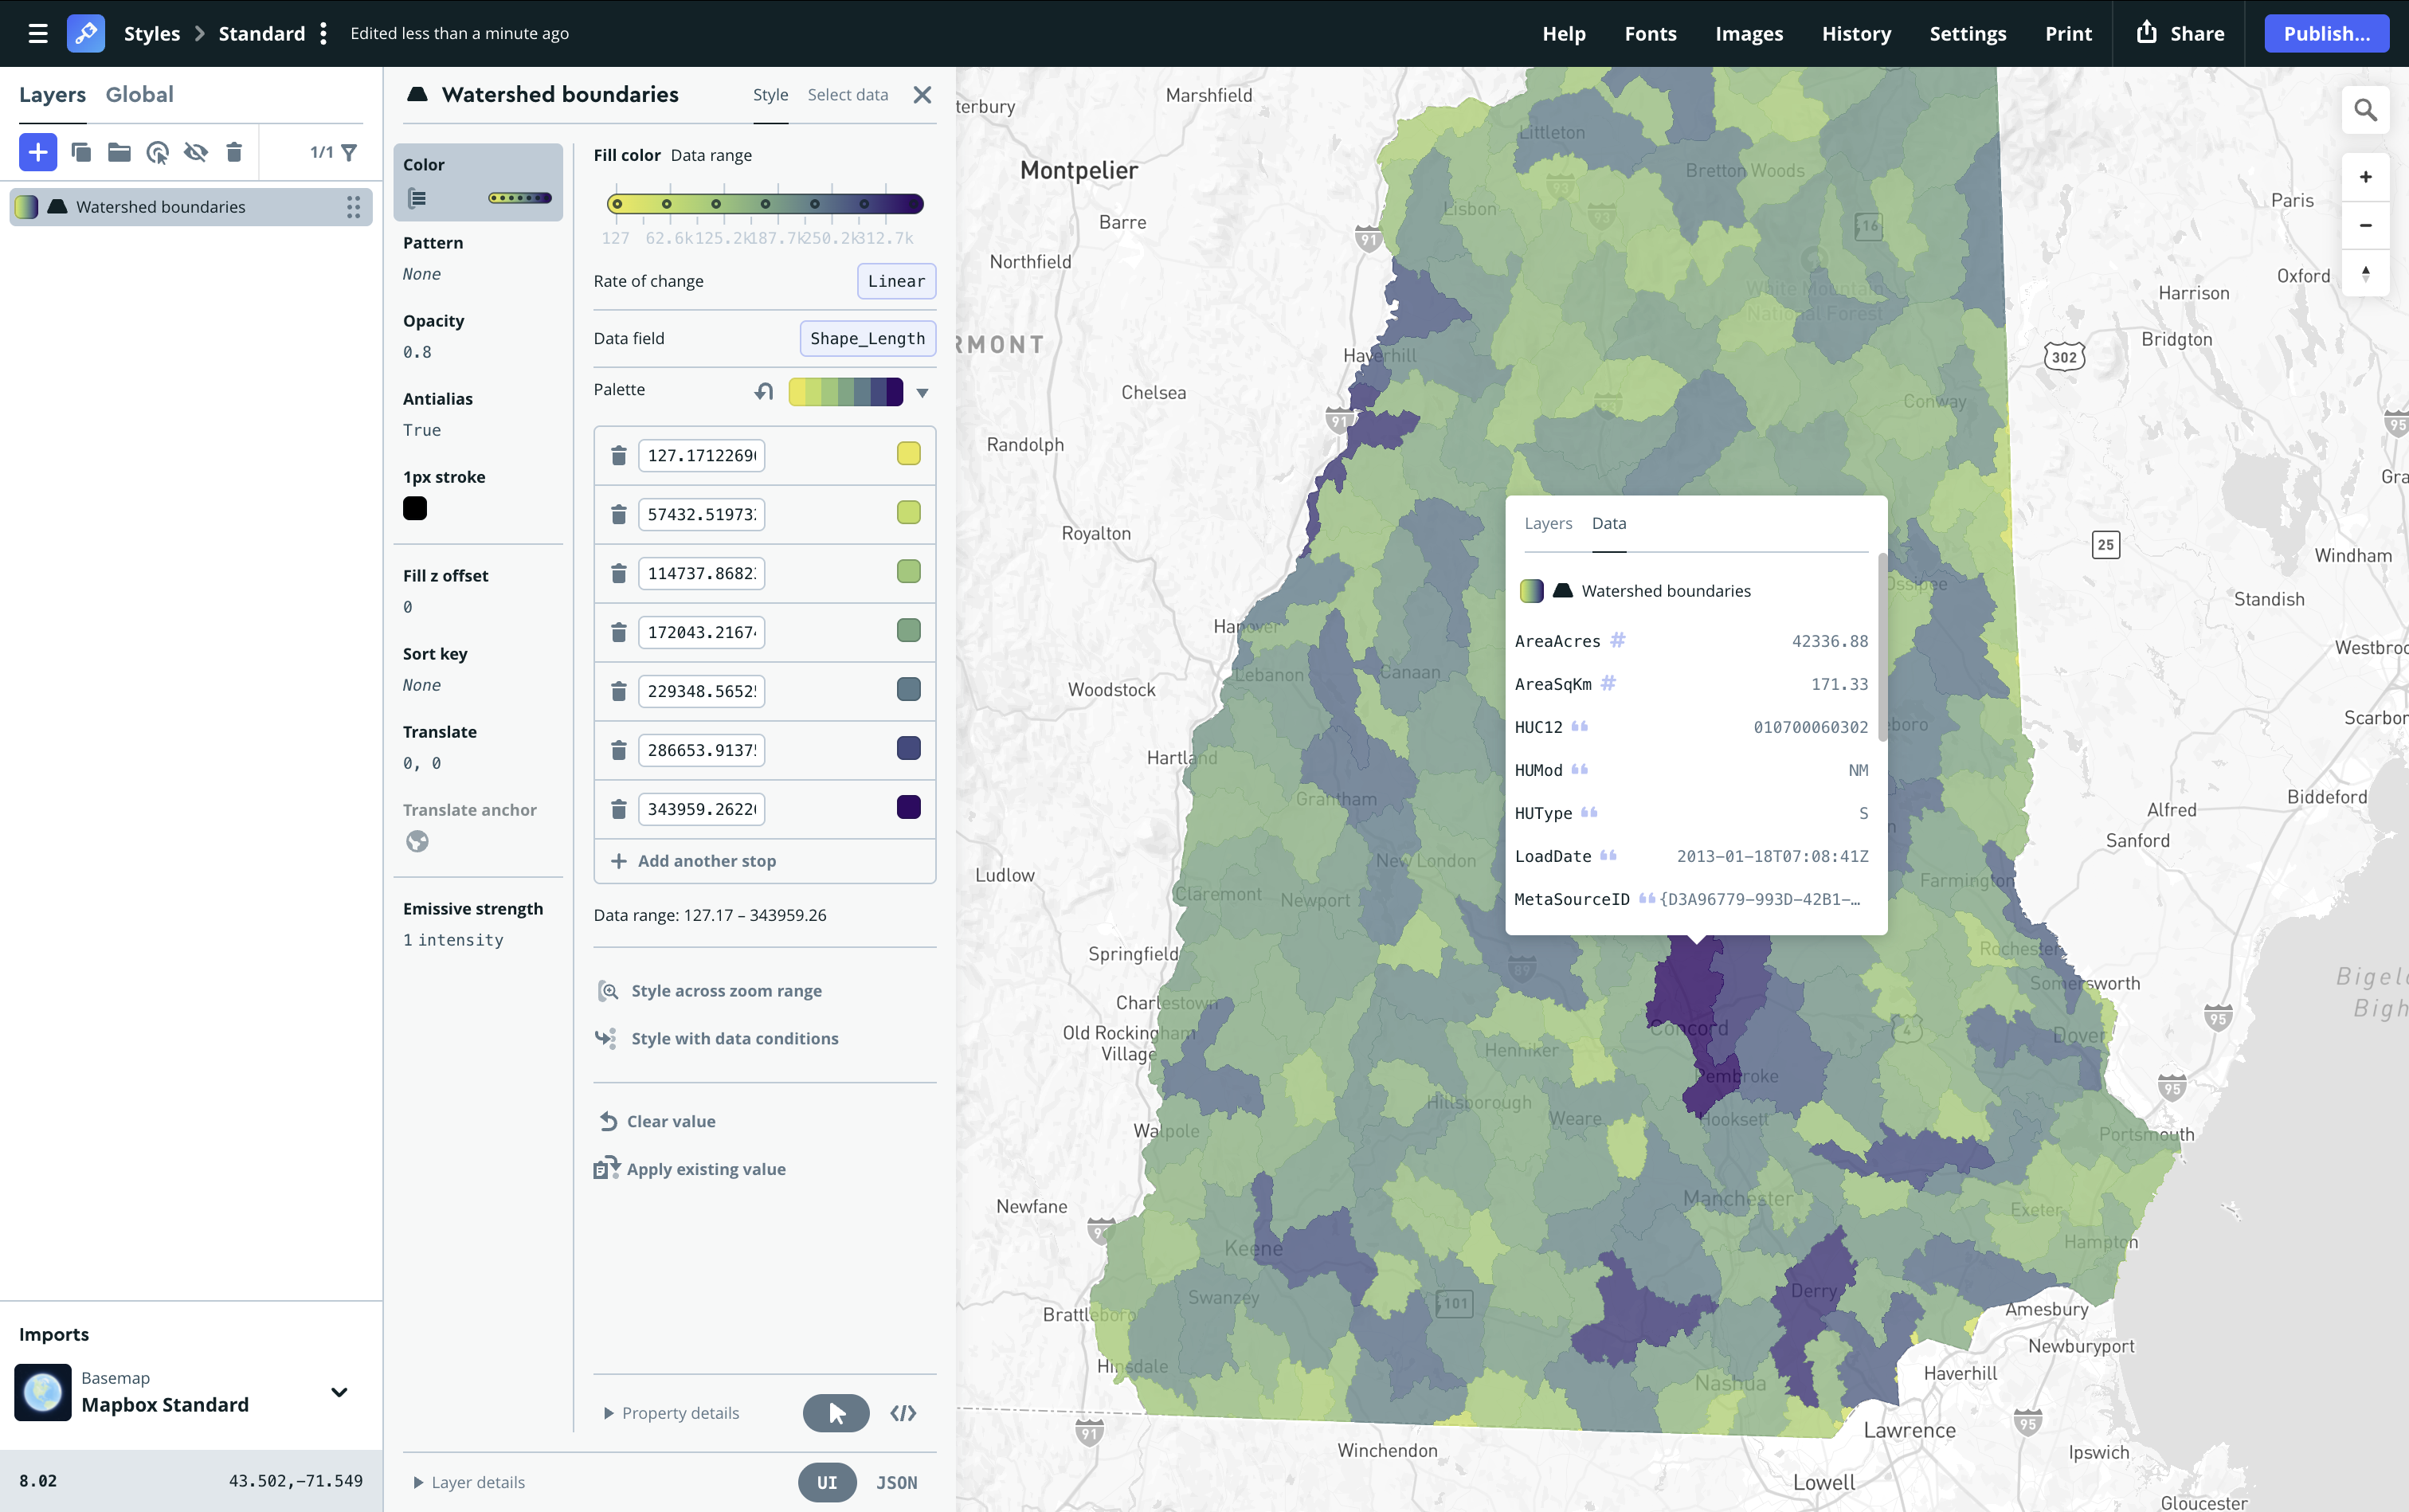
The integration of the new Data Workbench into the Mapbox Studio style editor has driven several improvements that help developers get from data to refined maps much more efficiently. Notably, the style editor now supports uploading multiple files at once, has quicker data upload times, and offers automatic smart styling defaults for custom data layers.
Improved data upload experience in the Studio style editor
In the past, Mapbox Studio only supported uploading one dataset at a time. Now it supports dragging and dropping multiple datasets right into the interface. Additionally, Studio now offers a preview of data while a tileset is processing. Developers and designers can begin styling a custom data layer in seconds.
Suggested styling defaults for every dataset
Until now, Mapbox Studio made no assumptions about how to style new custom data layers. Studio users had to decide the appropriate layer type and properties to adjust. For experienced users, styling custom layers often meant writing expressions and manually configuring multiple layer properties. For new users, discovering how to style custom data could mean a steep learning curve.
Now, when custom data is uploaded the Studio style editor automatically analyzes the dataset’s characteristics and applies meaningful styling to the layers. Instead of starting from scratch, users can start with styling that already visually reflects their data in a more sophisticated way.
A map design helper that understands data
With smart styling defaults, Studio examines the metadata generated when the dataset is uploaded and uses it to make intelligent styling decisions. Instead of simply displaying every feature with the same symbol or color, Studio asks questions like:
- Is this field categorical or numeric?
- Does it look like a label?
- Are there only a handful of unique values?
- Is the data heavily skewed?
- Does this dataset already contain styling information?
- Are these values actually colors or icons?
Based on those answers, Studio applies layer styling that appears appropriate based on the structure of the data. For example:
- Categorical attributes are automatically visualized with distinct colors.
- Numeric values can drive graduated symbol sizes using appropriate interpolation.
- Dense point datasets with intensity values can be displayed as heatmaps.
- Text fields become labels when they represent names or places.
- Datasets that already include styling, such as KML files, preserve their intended appearance.

The result is a custom map layer that needs to be adjusted instead of entirely authored, in many cases improving the time it takes to get from data to polished map style.
Built for the modern Mapbox Studio style editor workflow
Whether creating operational dashboards, thematic maps, data visualizations, or custom cartography, smart styling defaults help developers and designers to spend less time configuring styles and more time customizing the visual representation of custom data layers. Existing Mapbox users can get started in Studio here. New Mapbox users can create an account to start building.


Related articles

Albers projection displays US election maps more precisely

Mapbox GL JS reduces bundle size by up to 27% with modular rendering