Back to all cases

Fishbox boosts user engagement by 57% and unlocks 6.8% of new gross revenue from premium subscriptions with Mapbox

Key benefits of building with Mapbox
- Following a complete map redesign with Mapbox, Fishbox saw a 57% increase in paying subscribers returning to the map 30 days after purchase.
- Mapbox enables Fishbox to offer premium Navionics depth charts, generating 6.8% of new gross revenue through an add-on subscription.
- Mapbox transforms 800,000 waterbodies into interactive features and enables seamless exploration of 150,000 fishing spots through dynamic clustering.
products used
About Fishbox
Fishbox helps recreational anglers discover fishing spots, plan trips, and improve their chances of a successful catch. Available on mobile and web, the app combines fishing forecasts, bite predictions, nautical charts, weather data, and AI-powered fish identification. Fishbox also has an active community of anglers who review waterbodies, and discuss catches and the best places to fish.
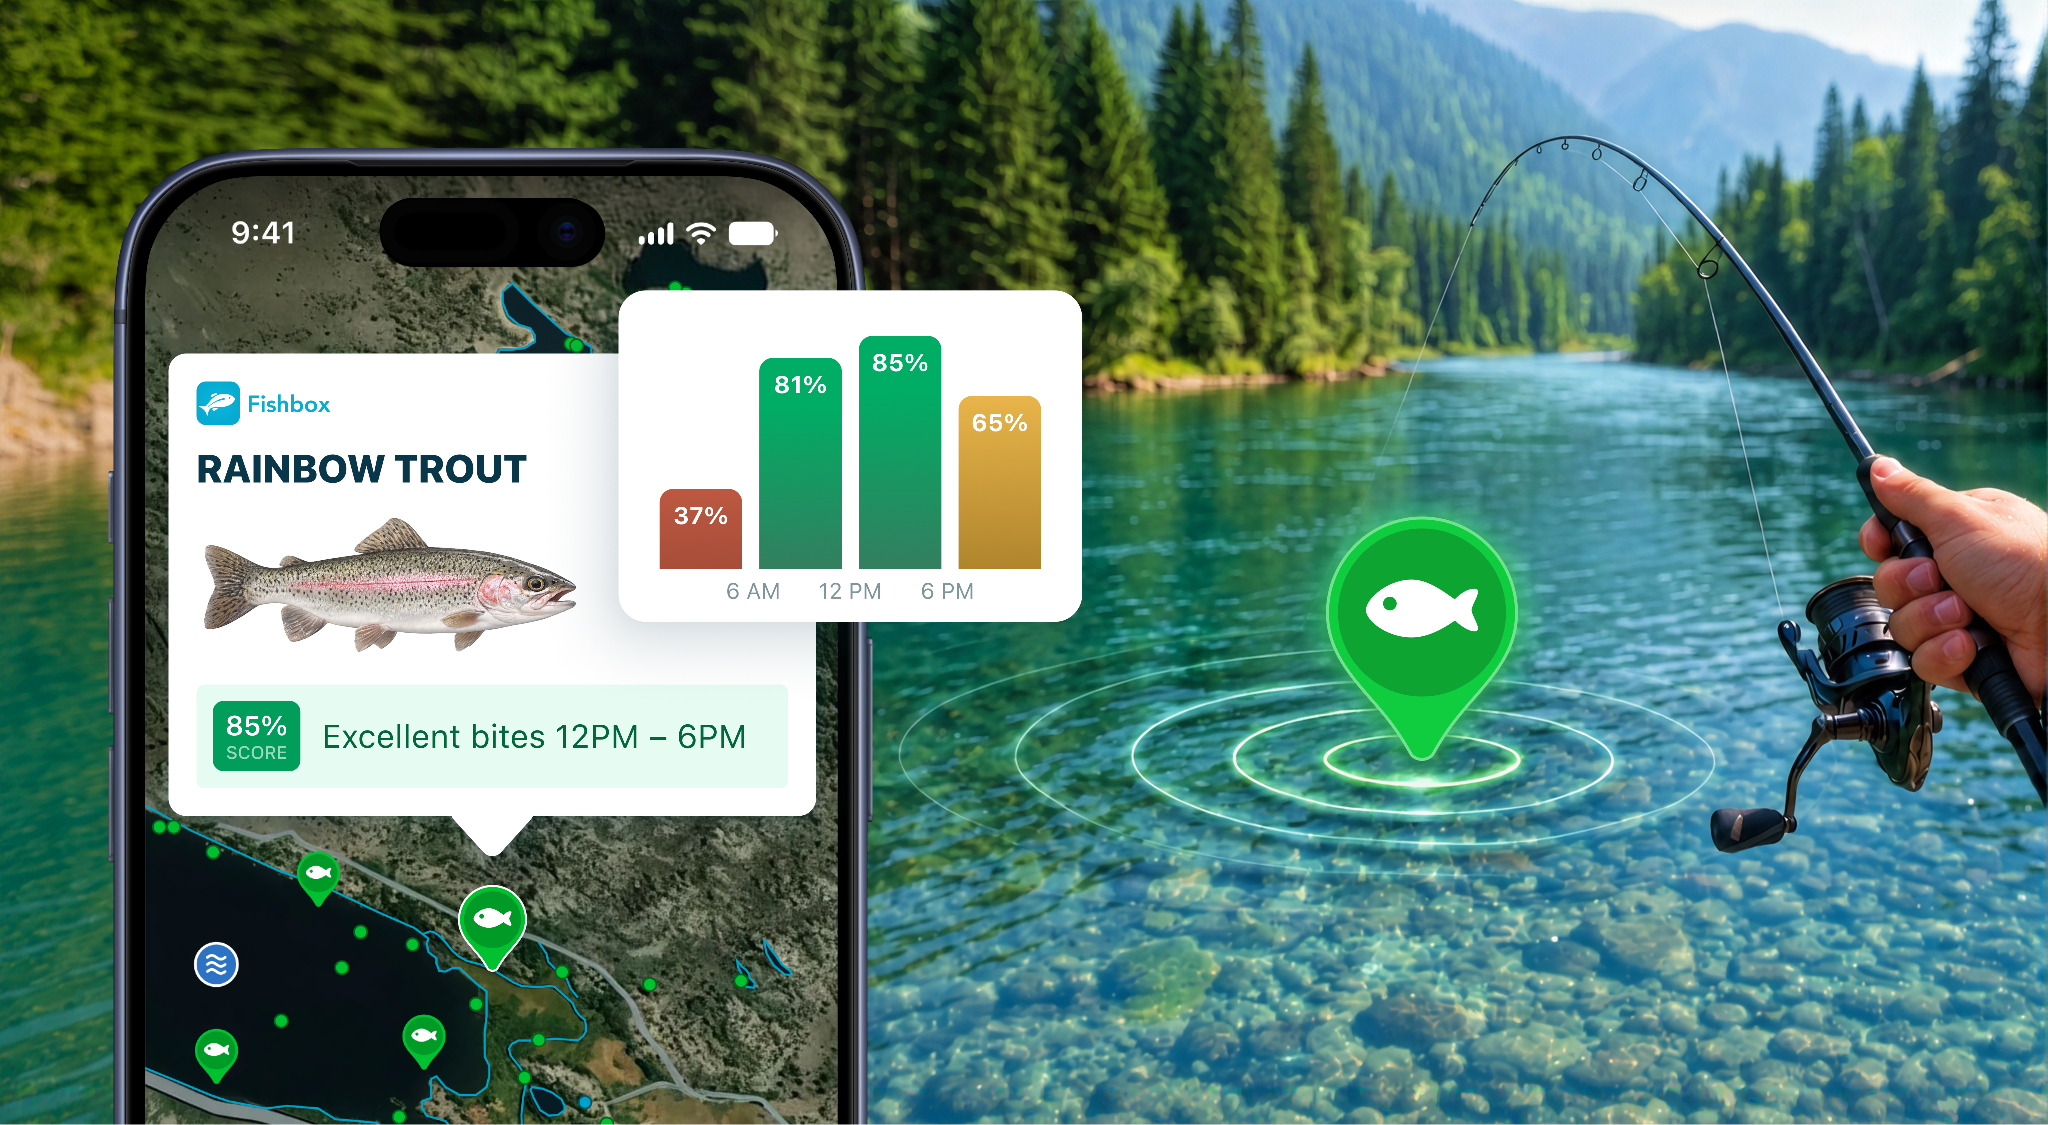
At the heart of Fishbox is its interactive map, the first screen users see and the starting point for exploring fishing locations, accessing forecasts, and planning trips. The map is so central to the experience that Fishbox defines user activation by the first map open, directly linking the mapping experience to product engagement and business performance.
Building a map tailored to anglers
For anglers, a map needs to do more than display locations. It should help answer important questions: What fish live in this lake? How deep is the water? Where can I launch my boat?
Fishbox previously supported both Apple Maps and Google Maps, allowing users to choose their preferred provider.
Google and Apple provided reliable basemaps but lacked the flexibility to create a fishing-specific experience. We couldn't customize map styles for anglers, make waterbodies interactive, or integrate Navionics depth charts. Supporting two providers also required separate implementations, resulting in inconsistent user experiences.
Maxim Krachko, CTO at Fishbox
Fishbox needed a mapping platform that could go beyond displaying geographic information and make its proprietary fishing data an integral part of the user experience. The team also wanted to introduce premium features that could create new revenue opportunities.
Turning 800,000 waterbodies into interactive features
Fishbox rebuilt its mapping experience from the ground up using Mapbox, creating a highly customized map designed around the needs of recreational anglers.
With the Mapbox Mobile Maps SDKs and Mapbox GL JS for web, Fishbox delivers an interactive mapping experience that makes geographic features directly accessible and actionable.
Using the Mapbox Tiling Service (MTS), Fishbox transforms its proprietary data on 800,000 lakes, rivers, and fishing spots into custom map tilesets. Anglers can simply tap a waterbody to access information about fish species, fishing forecasts, community reviews and more. With MTS and the Mapbox Data Workbench, Fishbox can manage and edit their datasets and push updates to their application without requiring a new app release.
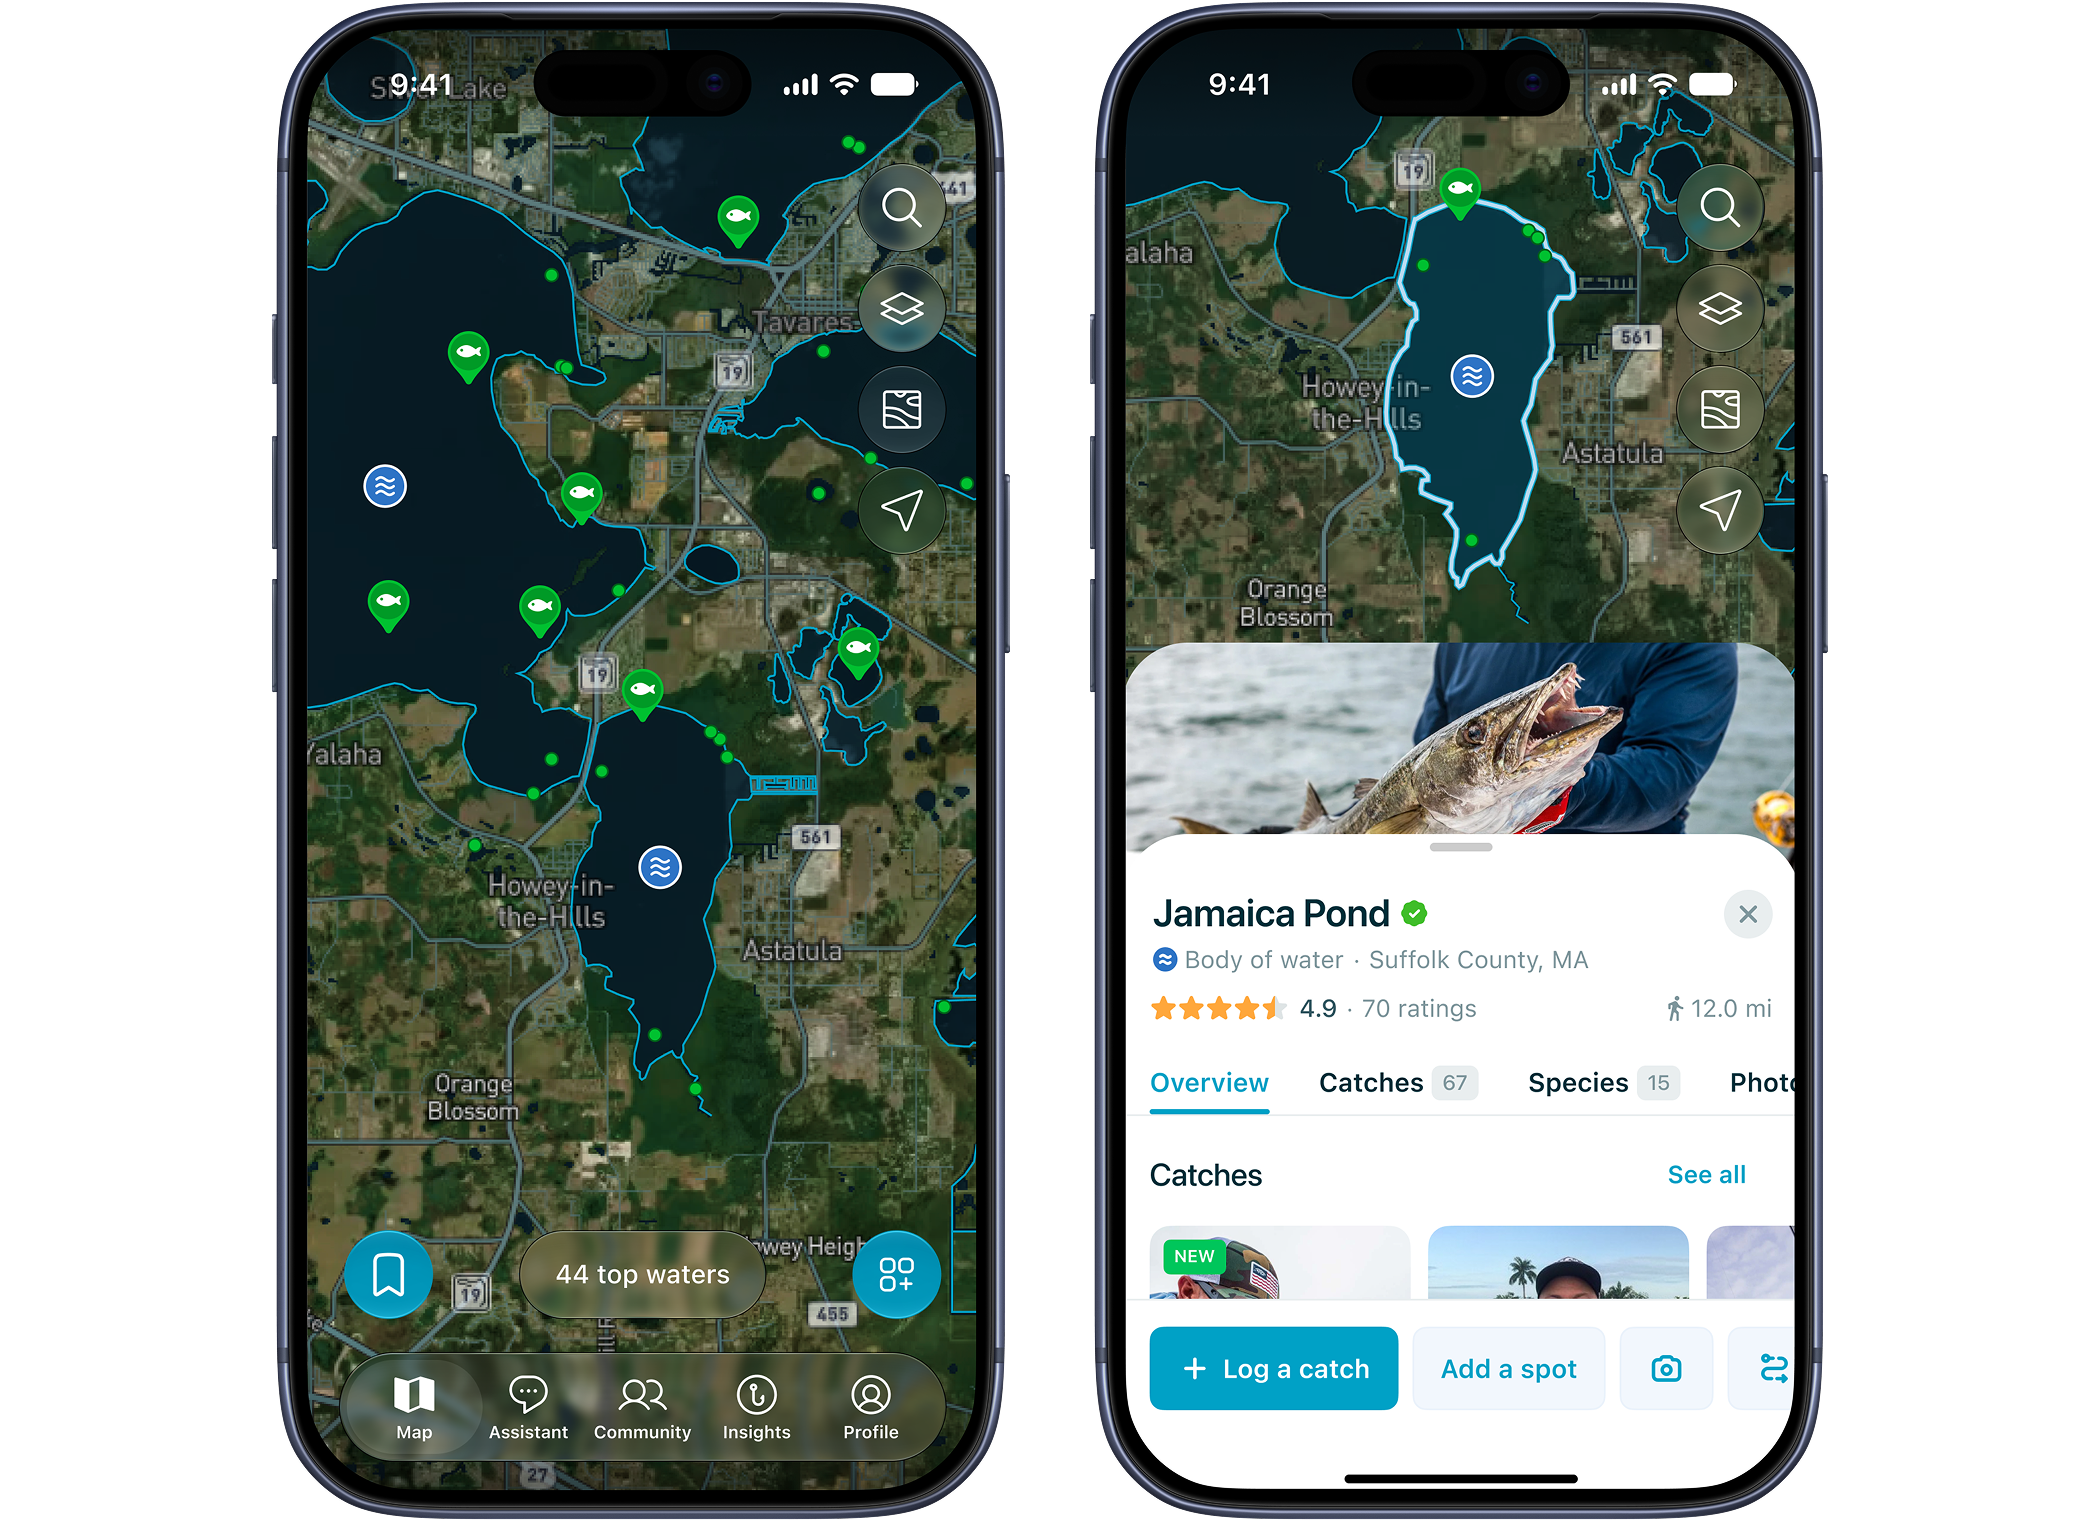
Mapbox enables Fishbox to display 150,000 fishing spots without clutter. Dynamic clustering groups markers at lower zoom levels and reveals individual spots as users zoom in, keeping the map easy to explore.
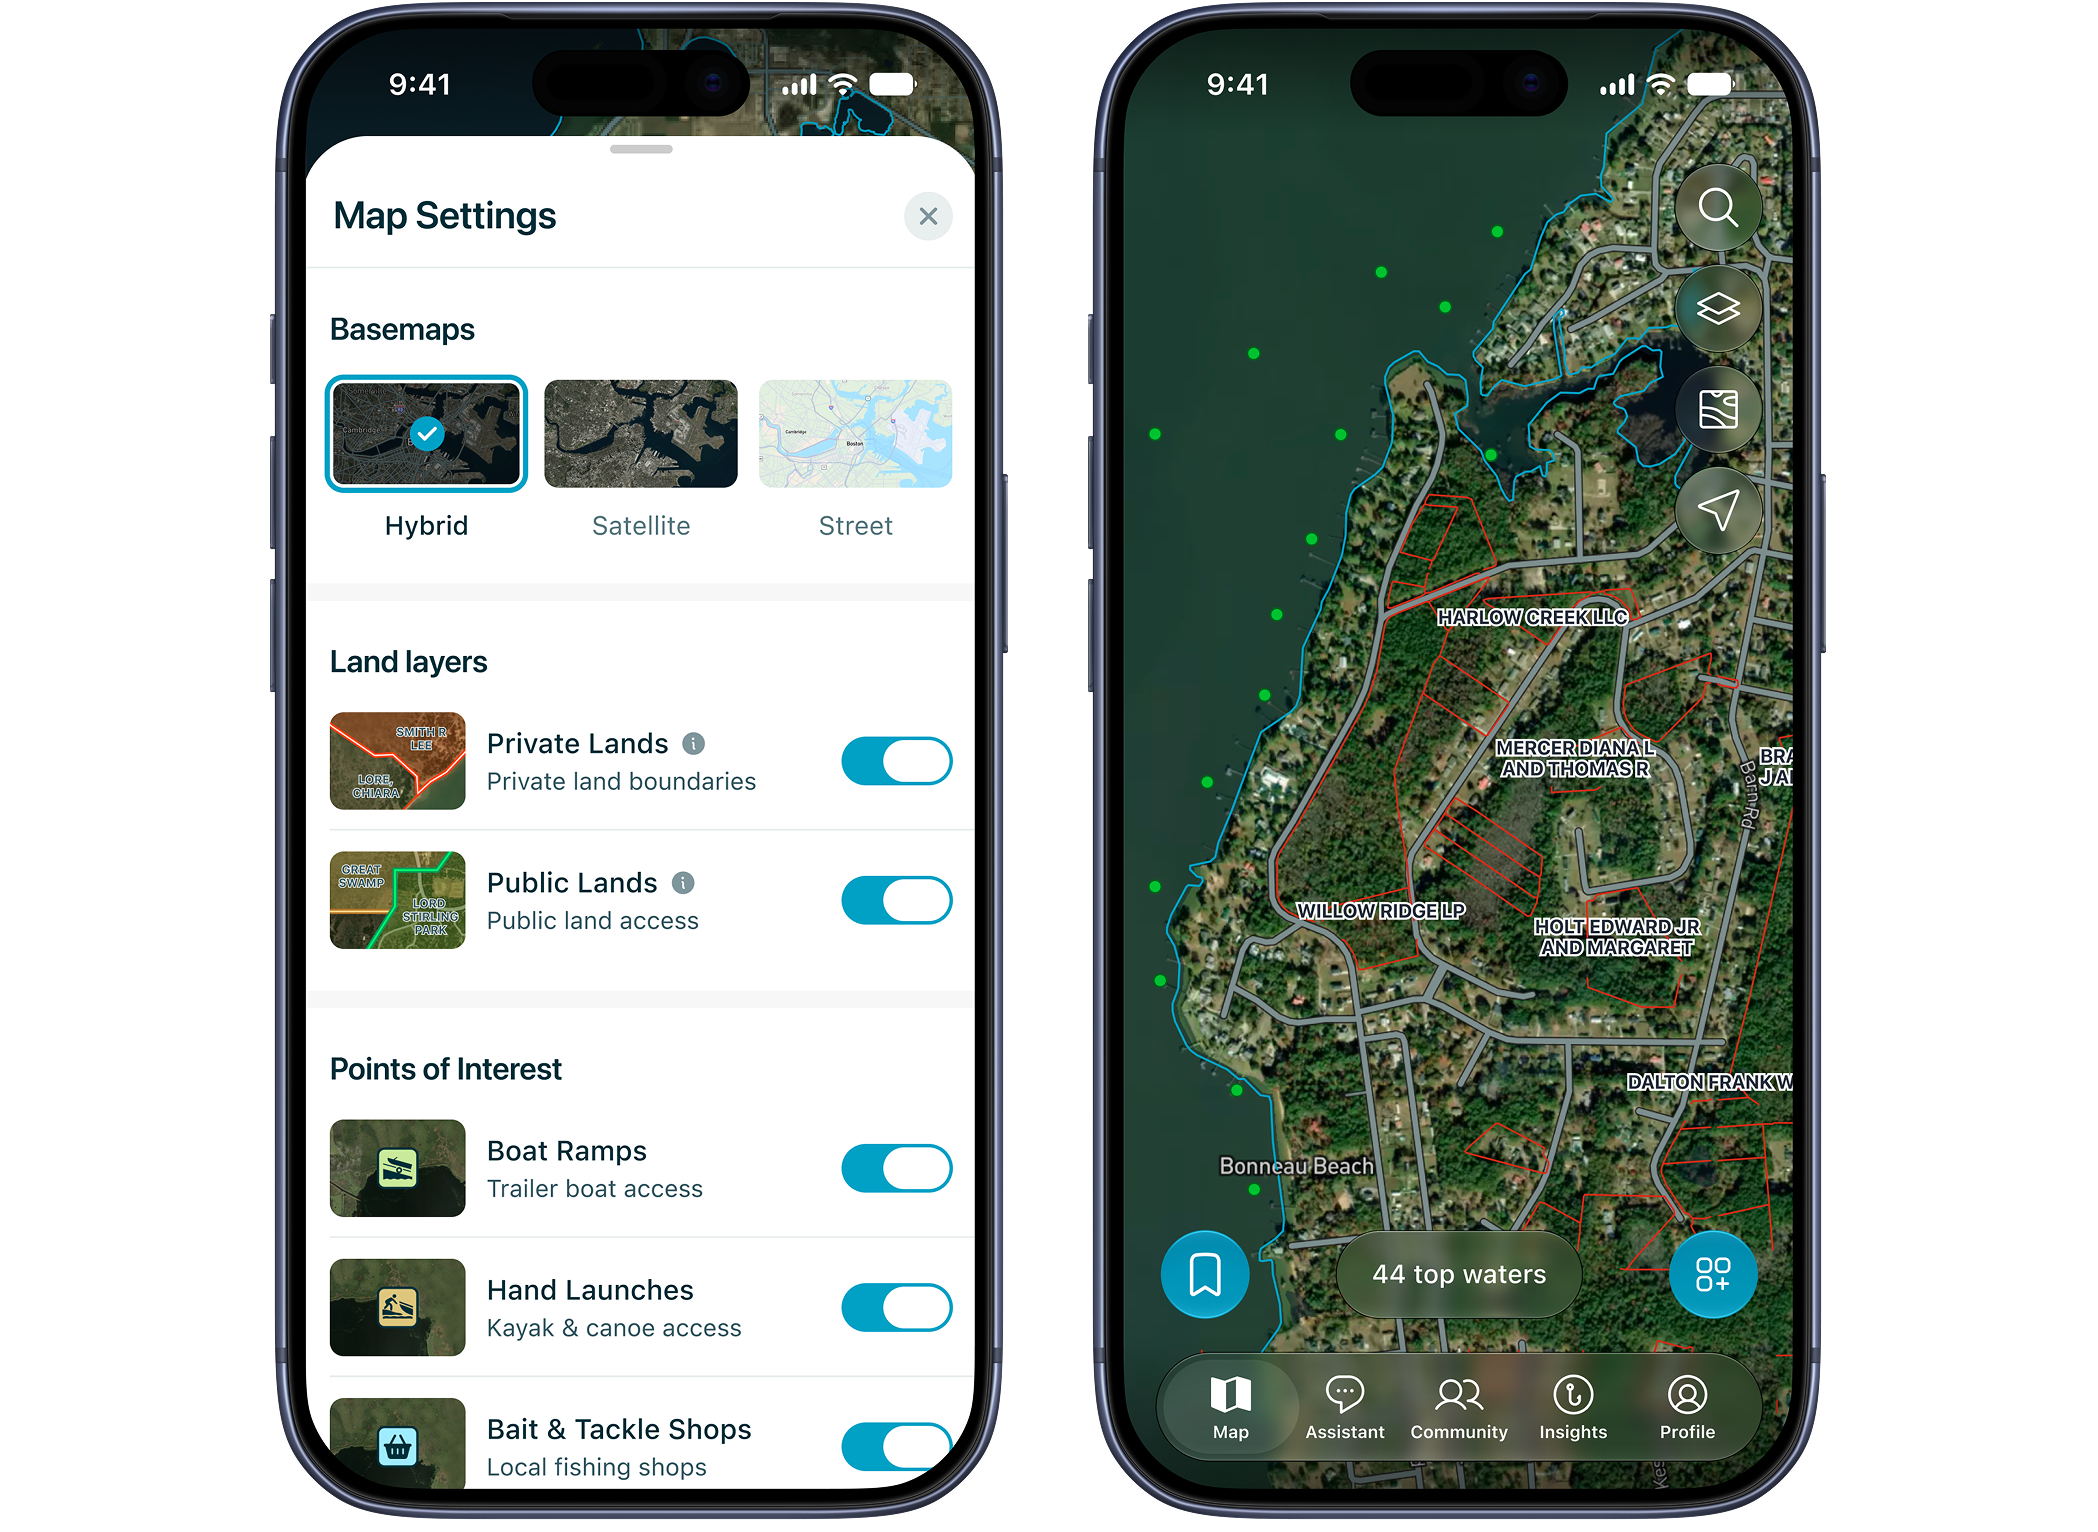
With Mapbox Studio, Fishbox customizes map styles to match its brand and prioritize geographic map features relevant to anglers. Users can toggle layers such as NOAA nautical data, Navionics depth charts, private land boundaries, tackle shops, and boat ramps, accessing everything within a single map.
Creating new subscription revenue
Beyond improving the user experience, Mapbox enabled Fishbox to introduce a new source of subscription revenue. With Mapbox rendering, Fishbox integrated Navionics depth charts directly into its maps, giving anglers access to detailed underwater terrain information to help identify promising fishing locations and plan trips. These charts are now offered as a paid add-on to the core Fishbox subscription.

The new feature has generated measurable business results accounting for 6.8% of new gross revenue. Adoption has also been strong, with 25% of active map users opening the depth layer during the same period.
Increasing engagement through a better map experience
For Fishbox, a successful mapping experience is closely connected to user engagement.
Our activation metric is the first map open, so for us the quality of the map is the quality of the product. Mapbox is not a map vendor to us, it is the platform we build the product on.
Yury Bolshunov, CPO at Fishbox
Following the redesign on Mapbox, Fishbox recorded significant year-over-year improvements in the percentage of paying subscribers returning to the map. Among US subscribers, 30-day return to the map increased from 14.8% to 23.2%, representing a 57% relative increase.
Building the next generation of fishing experiences
With Mapbox as the foundation of its mapping platform, Fishbox continues to expand the information anglers can access in one place.
The company is preparing to introduce additional weather visualization layers, including temperature, precipitation, and wind direction, directly within the map. They will also continue to expand their community resources like reviews and discussions. These capabilities will bring more of the information anglers use to plan their trips into a unified experience.
For Fishbox, the value of Mapbox extends beyond displaying locations. The flexibility of Mapbox makes it possible to create differentiated features, continuously improve the user experience, and build new sources of revenue, all from the map at the heart of the product.