Boundaries 4.7: Major Europe refresh and expanded global boundary coverage
300,000+ new and updated boundaries across 62 countries in Europe, Asia, and South America
.png)
Mapbox Boundaries 4.7 is now available, adding 91,701 new boundaries and updating 264,647 boundaries across 62 countries in Europe, Asia, and South America.
The 4.7 release includes a full refresh of European boundary data using the latest available sources, high-resolution postcode boundaries for the United Kingdom, plus updated districts in India, and worldview and international boundary updates across several countries. Read the changelog.
Boundaries v4.7 continues from v4.6 in including minor version suffixes, making it easier for customers to switch between specific dataset versions.
What’s new in Mapbox Boundaries 4.7
Mapbox Boundaries 4.7 delivers significant updates across administrative, postal, statistical, and neighborhood boundary layers. The release reflects recent administrative changes and updated source data to help teams keep geographic analysis, reporting, and applications aligned with how regions are defined today.
Highlights include:
- 91,701 new boundaries and 264,647 updated boundaries across 62 countries
- A full refresh of boundary data across Europe
- High-resolution, street-aligned postcode boundaries for the United Kingdom with 24,466 new postcodes
- Updated UK statistical boundaries using International Territorial Levels (ITLs)
- Updated district boundaries in India reflecting 2026 administrative changes
- Expanded high-resolution neighborhood coverage across 600 districts in Turkey
- Worldview and international boundary updates for Argentina, Chile, Paraguay, Serbia, Albania, and Greece
Full refresh of European boundary data
Boundaries 4.7 includes a broad refresh of European boundary data using the latest available sources.
Administrative and statistical boundaries change as governments reorganize regions, update reporting standards, and publish new geographic datasets. Refreshing these layers helps organizations keep regional analysis, business intelligence, and operational planning aligned with current geographic definitions.
The Europe refresh represents one of the largest areas of change in the 4.7 release and contributes to more than 264,000 boundaries updated globally.
High-resolution postcode boundaries for the United Kingdom
The 4.7 release introduces high-resolution, street-aligned postcode boundaries for the UK, providing more precise geographic representation of postcode areas.
More detailed postal boundaries can support applications such as market analysis, service-area planning, customer segmentation, logistics analysis, and other workflows where understanding geographic coverage at a granular level matters.
UK statistical boundaries move from NUTS to ITL
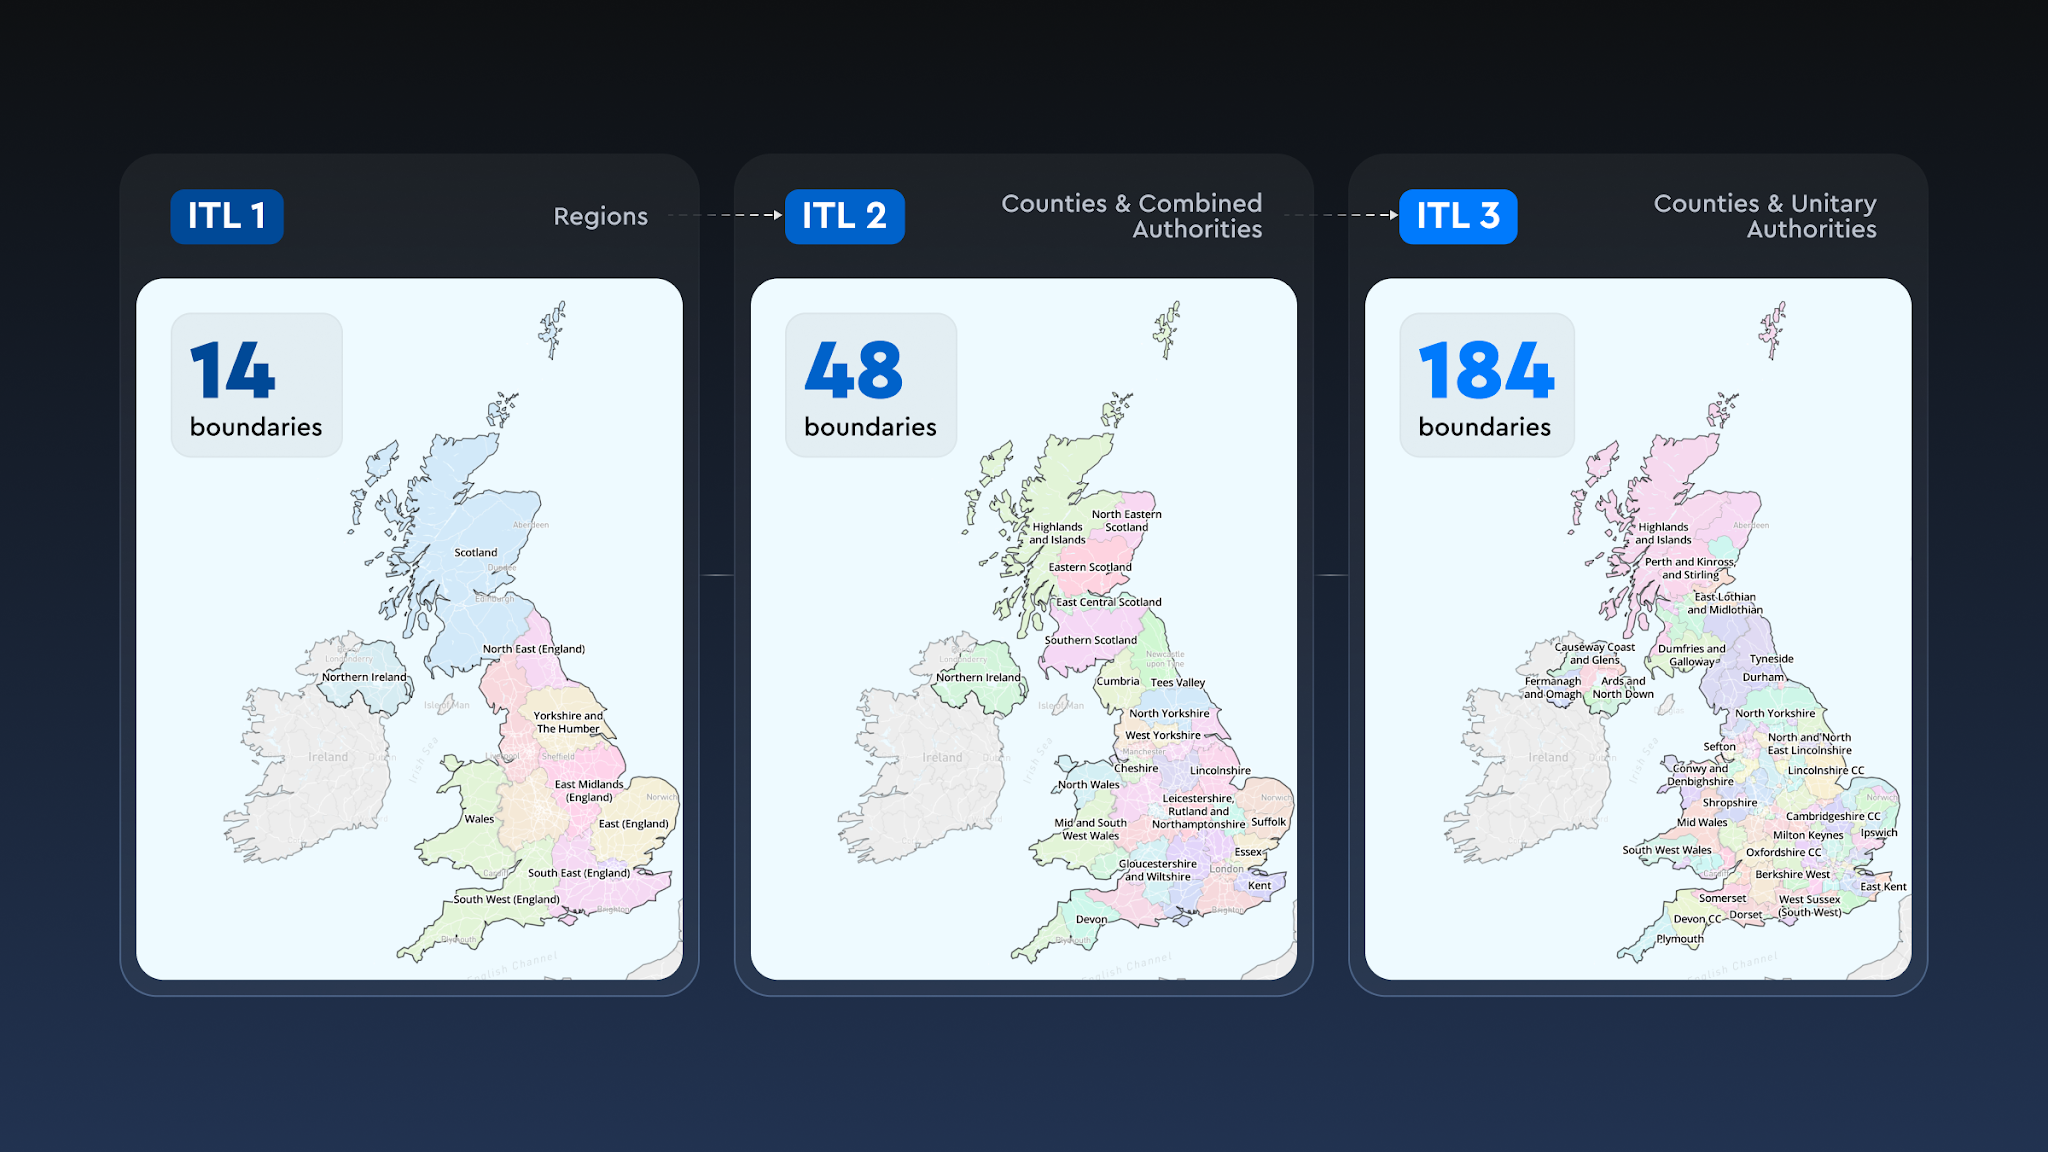
Boundaries 4.7 migrates UK statistical levels from the European Union's Nomenclature of Territorial Units for Statistics (NUTS) classification to the UK's International Territorial Levels (ITLs).
ITLs replaced the UK's former NUTS statistical geography following its departure from the European Union and provided the geographic framework used for regional statistical reporting in the UK.
Updating Mapbox Boundaries to ITLs helps customers keep analytics and reporting workflows aligned with the UK's current statistical geography.
Expanded high-resolution neighborhood coverage in Turkey
Boundaries 4.7 expands high-resolution neighborhood boundary coverage across 600 districts in Turkey.
Neighborhood-level boundaries give teams a more granular way to analyze and visualize data within cities and districts, supporting use cases such as local market analysis, service planning, demographic analysis, and location intelligence.
Updated worldview and international boundaries
The release also includes worldview and international boundary updates for Argentina, Chile, Paraguay, Serbia, Albania, and Greece.
Mapbox worldview data enables developers to represent disputed or politically sensitive boundaries according to different regional perspectives. Regular updates help applications maintain consistent geographic representations as international boundary definitions and source data evolve.
More control over Boundaries dataset versions
Boundaries 4.7 continues from v4.6 in including minor version suffixes. Previously, customers primarily referenced the major Boundaries version. Version-specific tileset IDs now make it easier to identify and switch between individual releases, giving teams greater control over when they adopt updated boundary data.
See the Mapbox Boundaries tileset ID documentation for additional details.
Precise boundary data supports reliable geographic analysis
Geospatial boundaries define how regions are measured, compared, and understood, whether they represent national borders, administrative regions, postal delivery areas, statistical reporting zones, or locally recognized places.
But boundaries are not static. Administrative districts are reorganized, postal areas change, statistical frameworks evolve, and geopolitical definitions shift over time.
When geographic reference data falls out of date, organizations risk basing analysis and operational decisions on regions that no longer reflect current definitions.
For teams working in analytics, business intelligence, planning, logistics, and reporting, current boundary data helps ensure that metrics and geographic insights align with how regions are defined today.
Mapbox Boundaries provides more than five million expertly curated boundaries covering political, administrative, statistical, state, county, city, postal, and other geographic areas worldwide. As geographic definitions and metadata change, Mapbox continuously refreshes Boundaries datasets to support accurate location-based analysis.
Access the latest Mapbox Boundaries tilesets via API or self-hosted files
Mapbox Boundaries datasets are available on an annual license. Contact Mapbox to access the tailored package of Boundaries tilesets most applicable to your use case or geography.
Mapbox offers Boundaries in two formats to support different technical needs.
The vector tileset format provides lightweight, scalable access via API for production applications that require fast boundary rendering and interaction. Explore Mapbox Boundaries vector tiles in the interactive Boundaries Explorer.
The flat GeoJSON format supports self-hosted environments and advanced analysis workflows that require complete geometry and metadata access, including data science, analytics, and business intelligence environments. Request a flat-file sample dataset for evaluation.
Mapbox Boundaries expand spatial intelligence in Tableau
Mapbox Boundaries supports geospatial analysis and storytelling across business intelligence workflows, helping teams visualize, compare, and communicate insights using detailed geographic areas.
Through the integration of Mapbox Boundaries with Tableau, users can bring more granular geographic context into their analysis, from administrative and statistical regions to custom geographic visualizations. In this webinar, Geospatial storytelling with Tableau and Mapbox Boundaries, Tableau demonstrates how detailed boundary data can help analysts move beyond standard geographic layers and create richer spatial stories directly within their existing BI workflows.
Learn more at BUILD with Mapbox 2026
Want to see what’s new in Mapbox Boundaries and how customers are putting spatial data to work? Join us at BUILD with Mapbox 2026 for our product release: Round-up of what’s new across the Mapbox platform session to hear more about the latest Boundaries updates.
You can also hear directly from Jim Walseth, Lead Member of Technical Staff, Software Engineering at Tableau, Salesforce, in the session ‘Expanding spatial intelligence in Tableau with Mapbox.’ The session will explore how Tableau users can unlock advanced spatial analysis powered by Mapbox, including drive-time analysis, and spatial visualization capabilities that help teams uncover and communicate geographic insights more effectively.
Frequently asked questions
What is included in Mapbox Boundaries 4.7?
Mapbox Boundaries 4.7 adds 91,701 boundaries and updates 264,647 boundaries across 62 countries in Europe, Asia, and South America.
Major updates include a full refresh of European boundary data, high-resolution UK postcode boundaries, migration of UK statistical geographies to ITLs, updated India districts, expanded neighborhood coverage in Turkey, and worldview and international boundary updates across Argentina, Chile, Paraguay, Serbia, Albania, and Greece. Read the changelog
Does Mapbox Boundaries provide global coverage?
Yes. Mapbox Boundaries includes more than five million boundaries worldwide, covering countries, regions, cities, postal areas, statistical regions, legislative districts and other administrative levels.
The data is curated and regularly updated using authoritative geographic sources to support large-scale geographic analysis. For more detail, see Mapbox Boundaries 101: Data Quality and Business Impact.
How often is boundary data updated?
Boundary data is refreshed regularly to reflect changes in administrative structures, postal systems, statistical geographies, and international boundary definitions.
Are flat files available for self-hosted use?
Yes. Flat GeoJSON boundary files are available for self-hosted environments and advanced analysis workflows. Sample datasets can be requested for evaluation.
How is Mapbox Boundaries priced?
Mapbox Boundaries pricing is based on the boundary layers you use, such as administrative, postal, or statistical boundaries, your required geographic coverage, and how the data is accessed.
This lets teams select the data package that best fits their application. Contact the Mapbox team for pricing.


Related articles
Introducing the Mapbox Places API
Mapbox Geocoding adds 45 new countries and 73.2 million addresses