Geospatial solutions for telecommunications
Mapbox provides a flexible location platform to attract and retain telco customers in highly competitive markets.
Accelerate customer acquisition
Identify growth opportunities, clearly communicate coverage, and streamline sign-up.
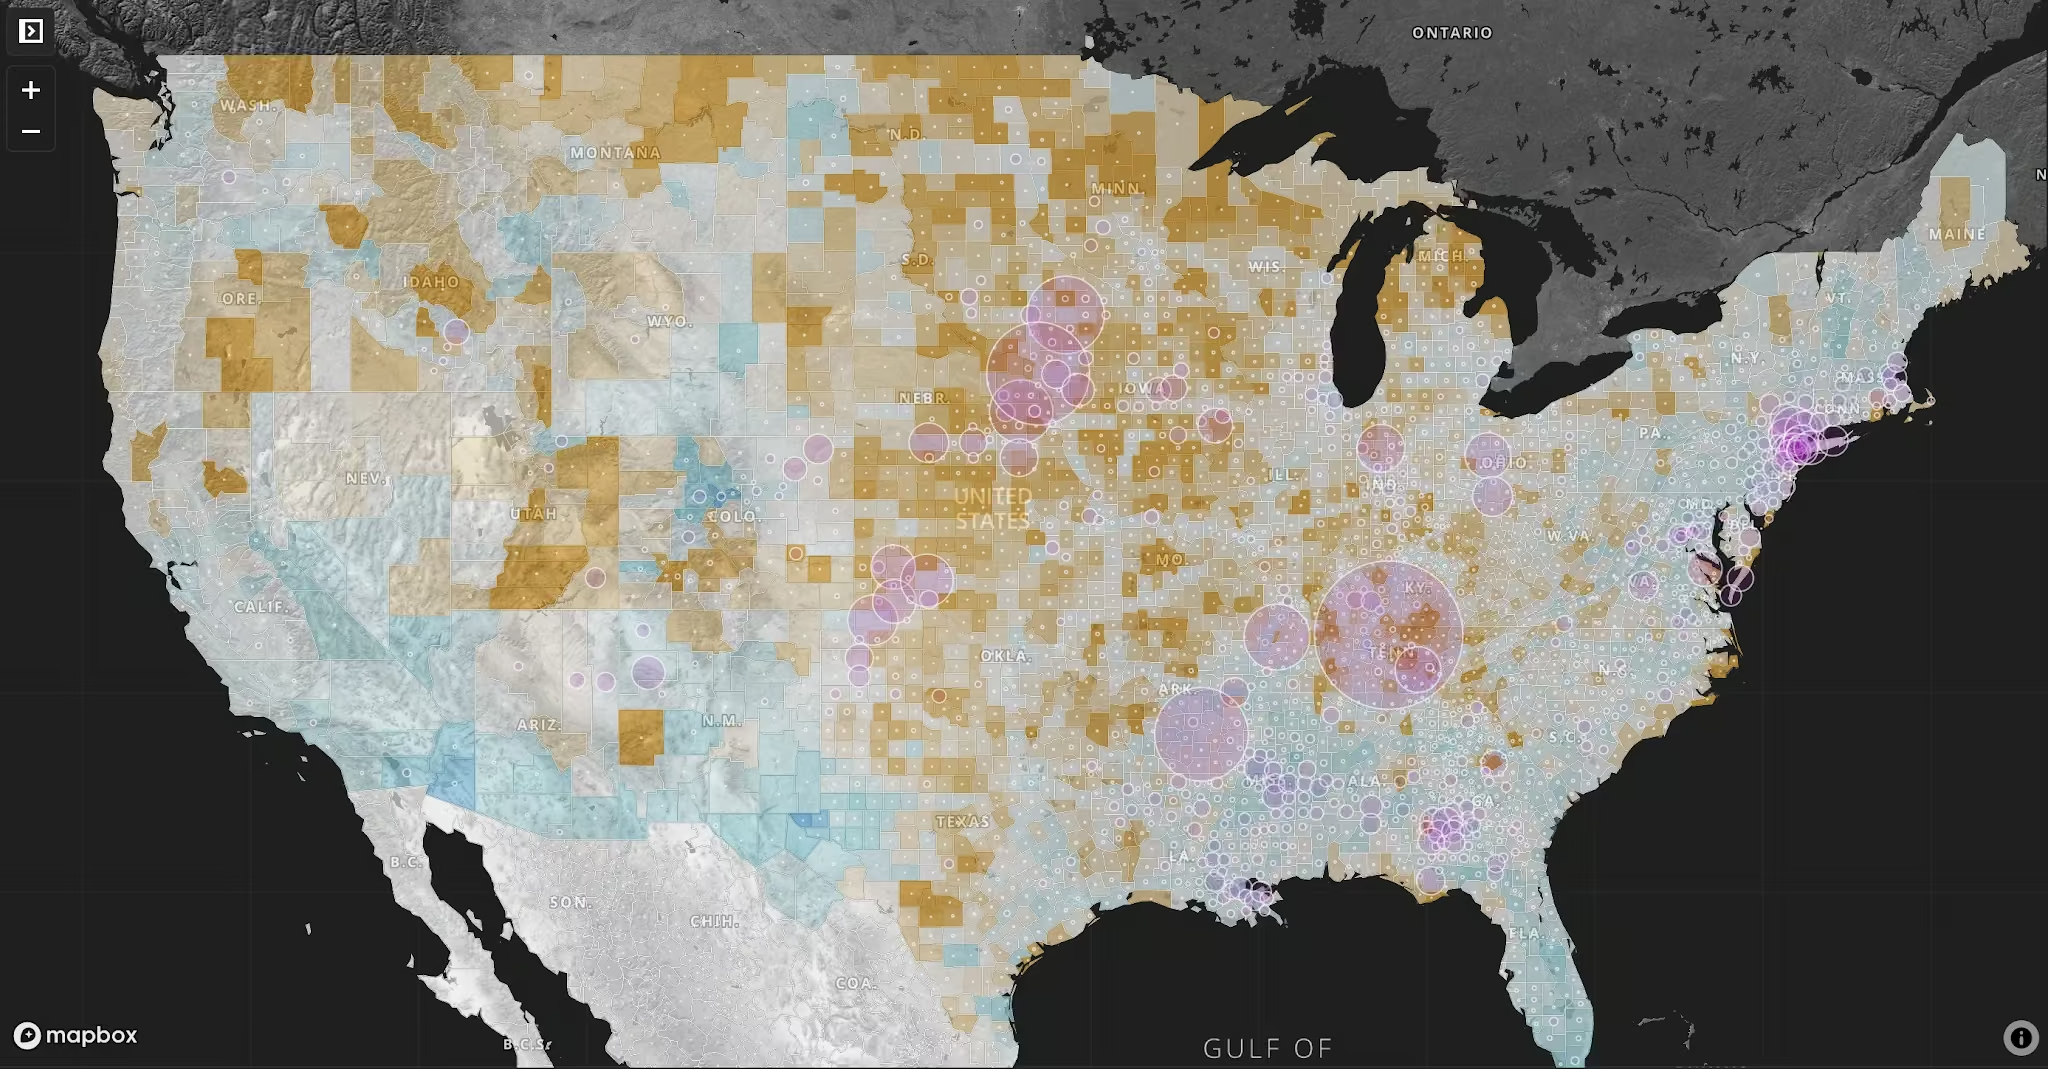
Find new customers where demand is emerging
Maps and geolocation solutions for telecoms help identify where new customers are likely to convert. Visualize demand hot spots, competitor coverage gaps, and new developments to focus acquisition efforts. Continuously updating Mapbox maps and geocodes give visibility into new neighborhoods before competitors.
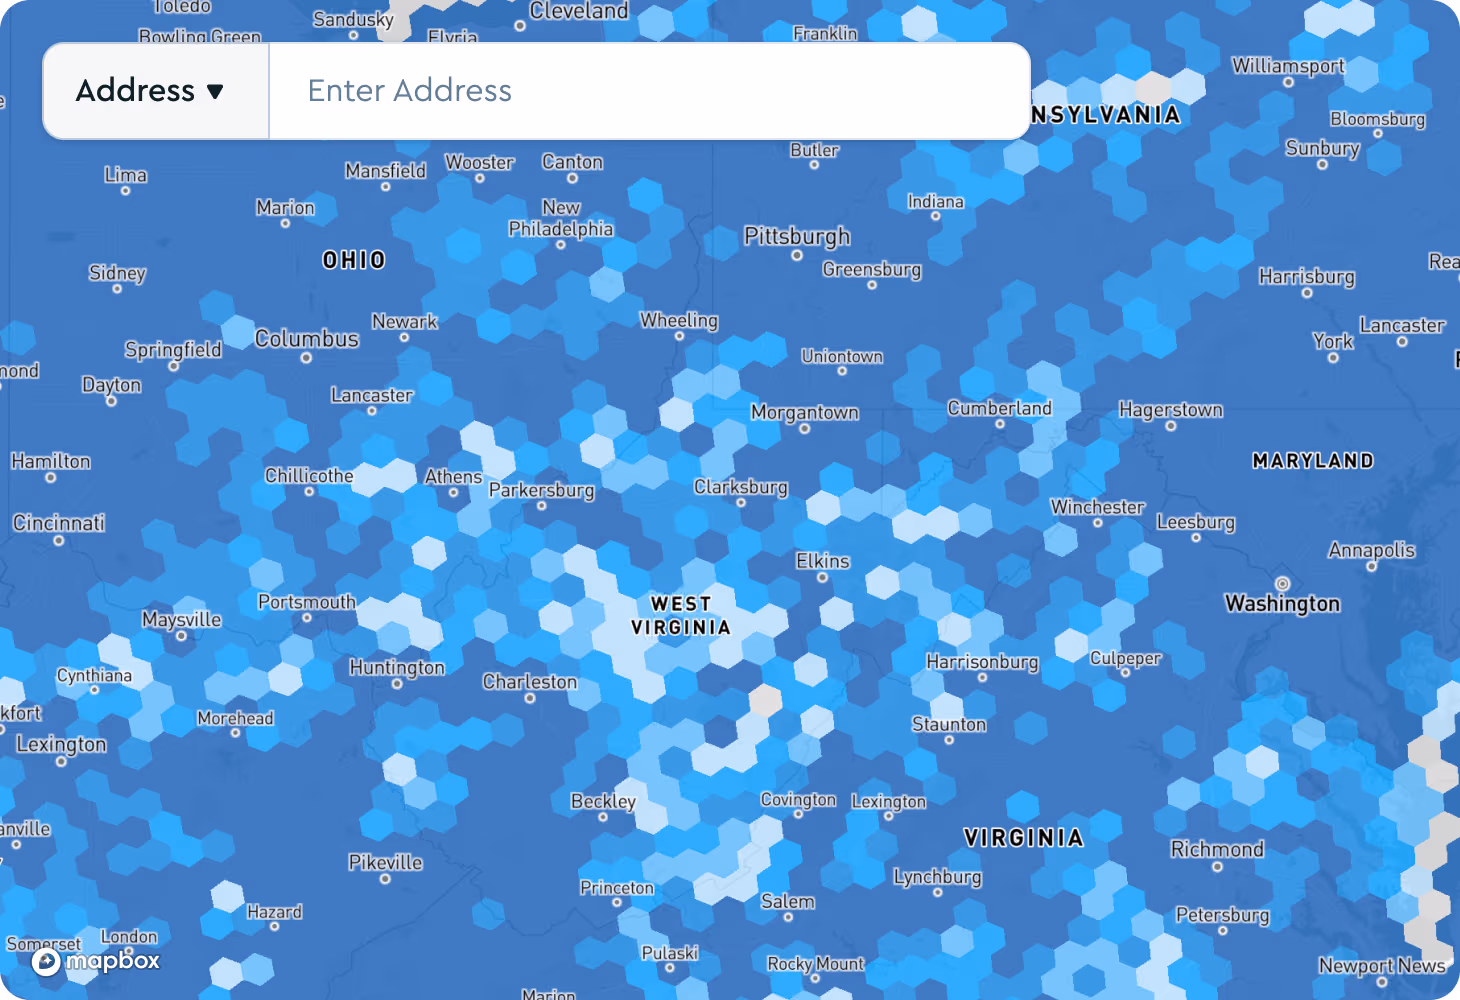
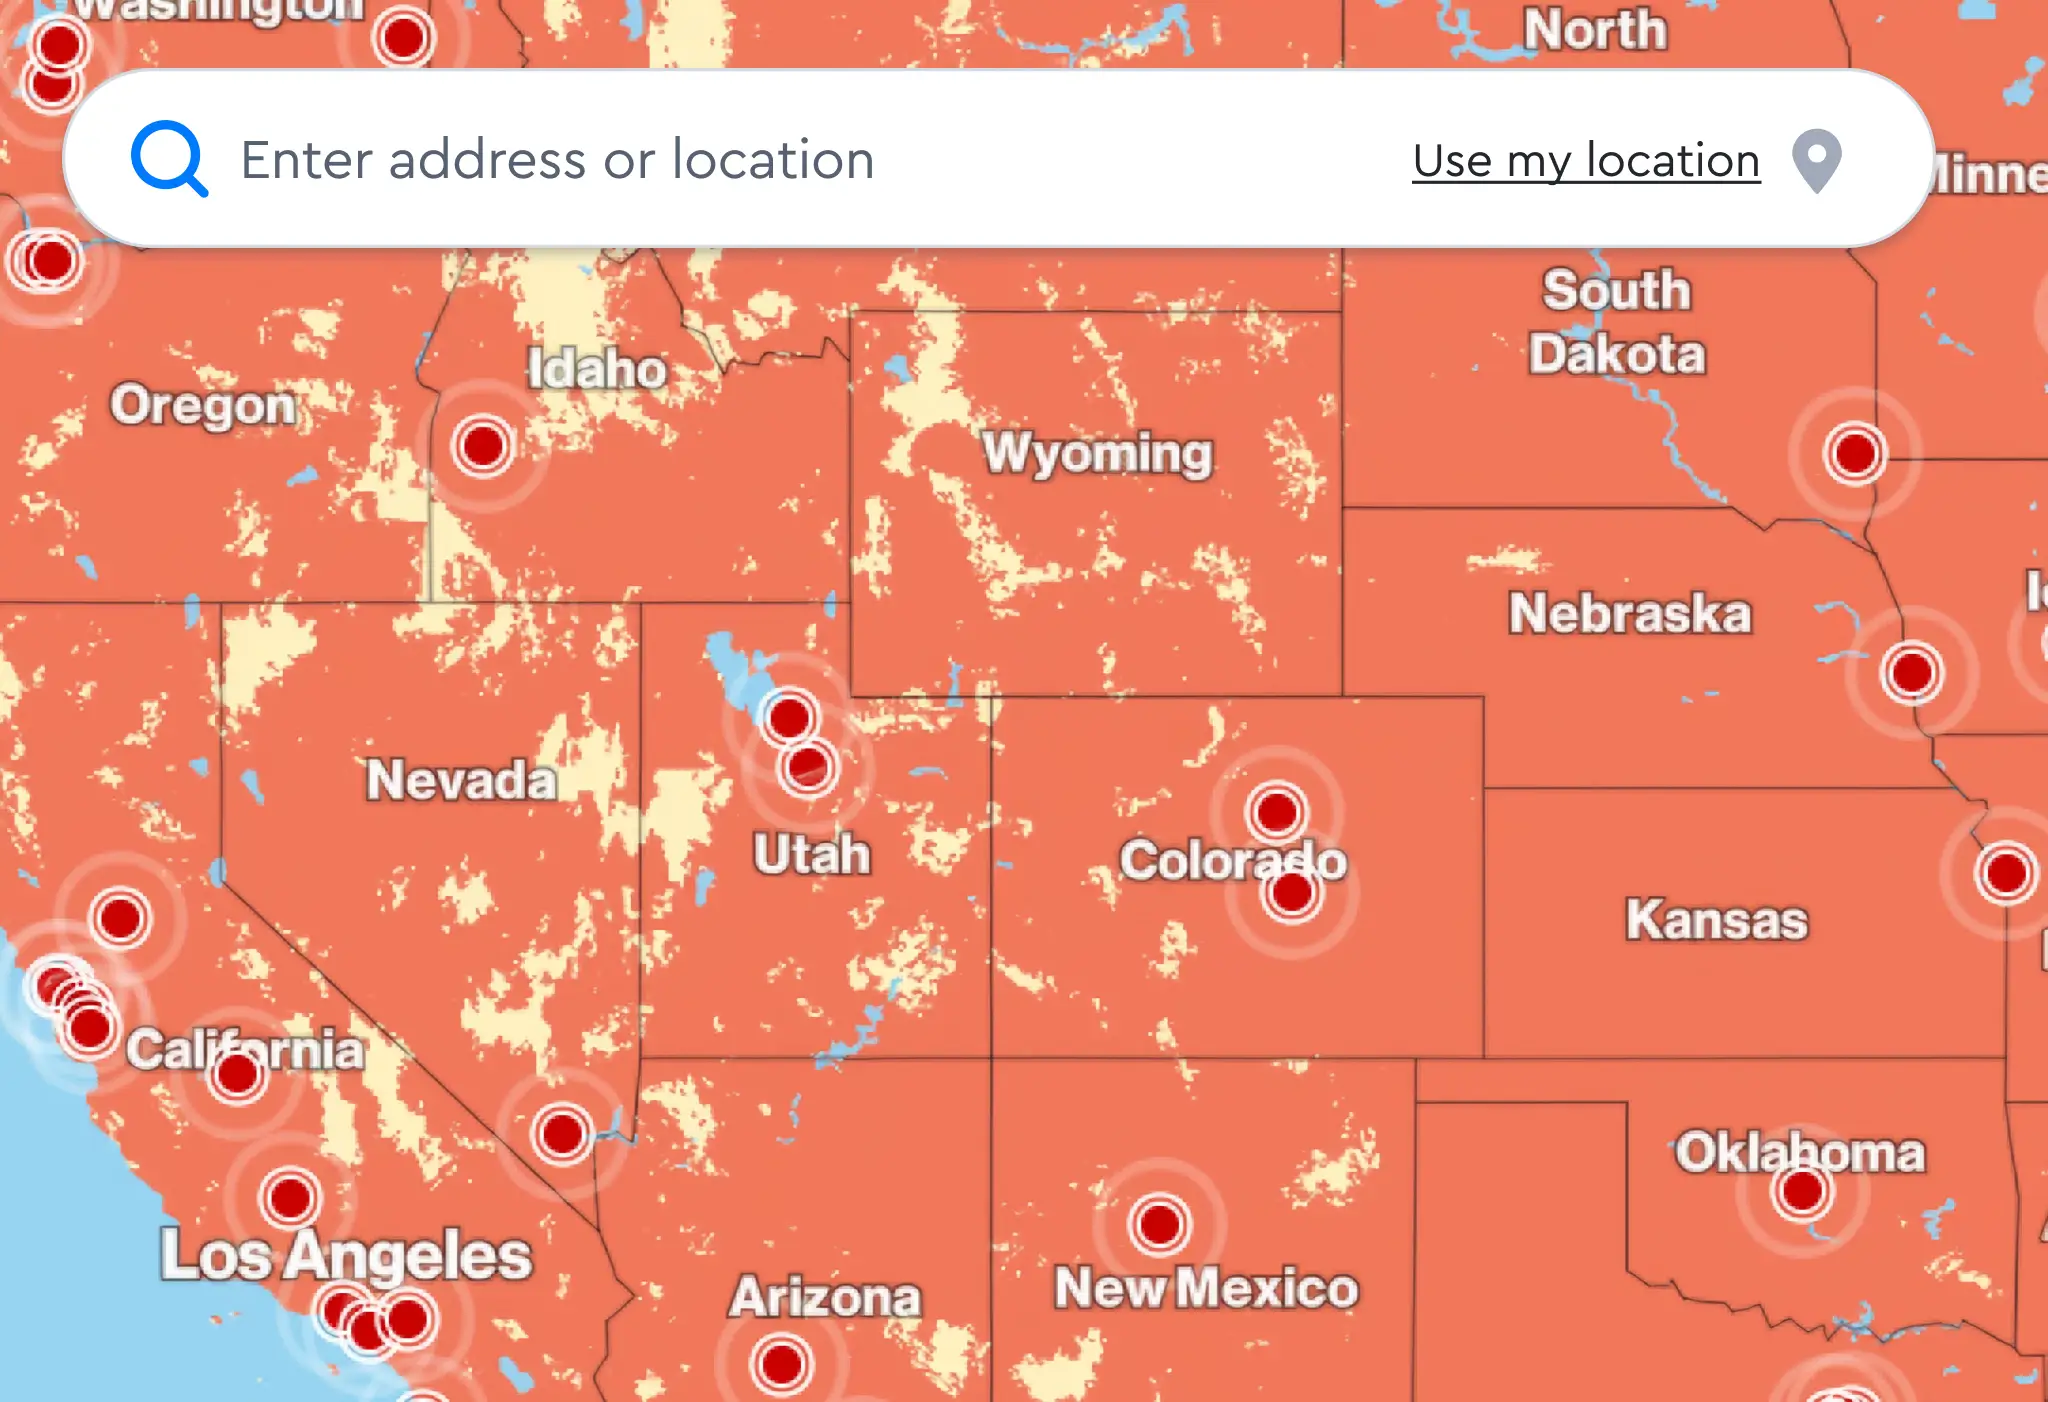
Make coverage easy to find
Interactive telco coverage maps help prospective customers quickly understand where service works. Address-level eligibility checks and performance visualizations reduce uncertainty. By clearly showing coverage, providers remove friction from the buying journey.
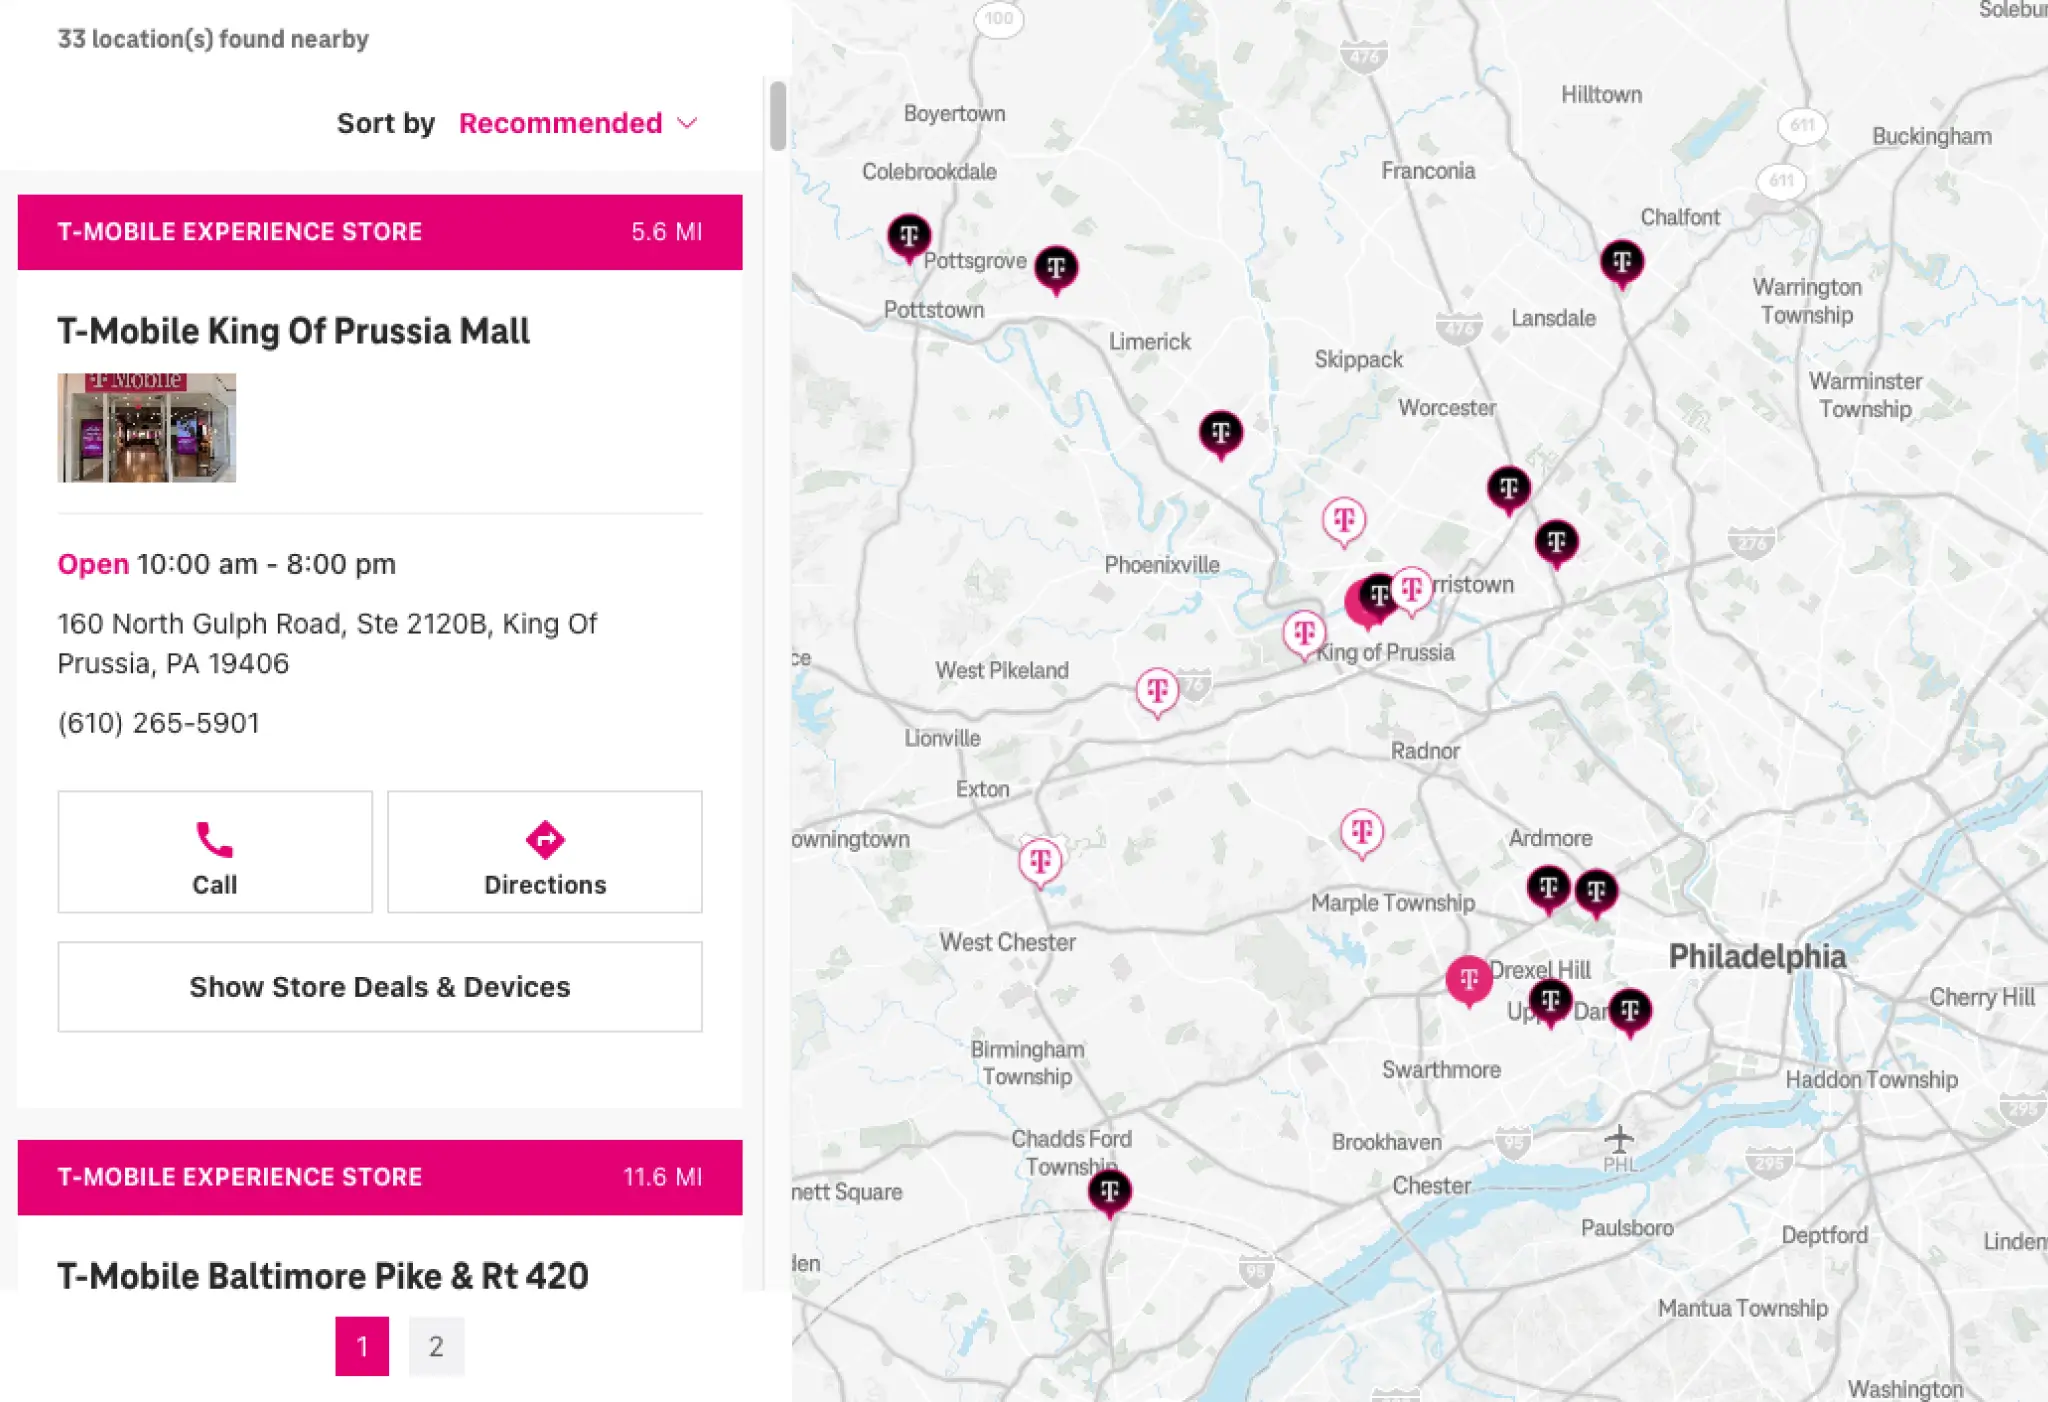
Go smoothly from sign-up to service
Online sign-up flows with accurate address autofill and geocoded eligibility checks help customers activate service faster and with fewer errors. Store locators support customers who prefer in-person help, which can increase new activations and help troubleshooting problems faster.
Improve customer retention
Optimize network planning, improve outage response, and deliver location-powered services that strengthen customer loyalty.
Plan networks that perform and scale with demand
Maps reveal the movement of people, coverage gaps, and performance issues that guide tower placement and fiber expansion. By visualizing new tower placements and the impact of network coverage solutions before deployment, providers can deliver consistent performance that keeps customers satisfied.

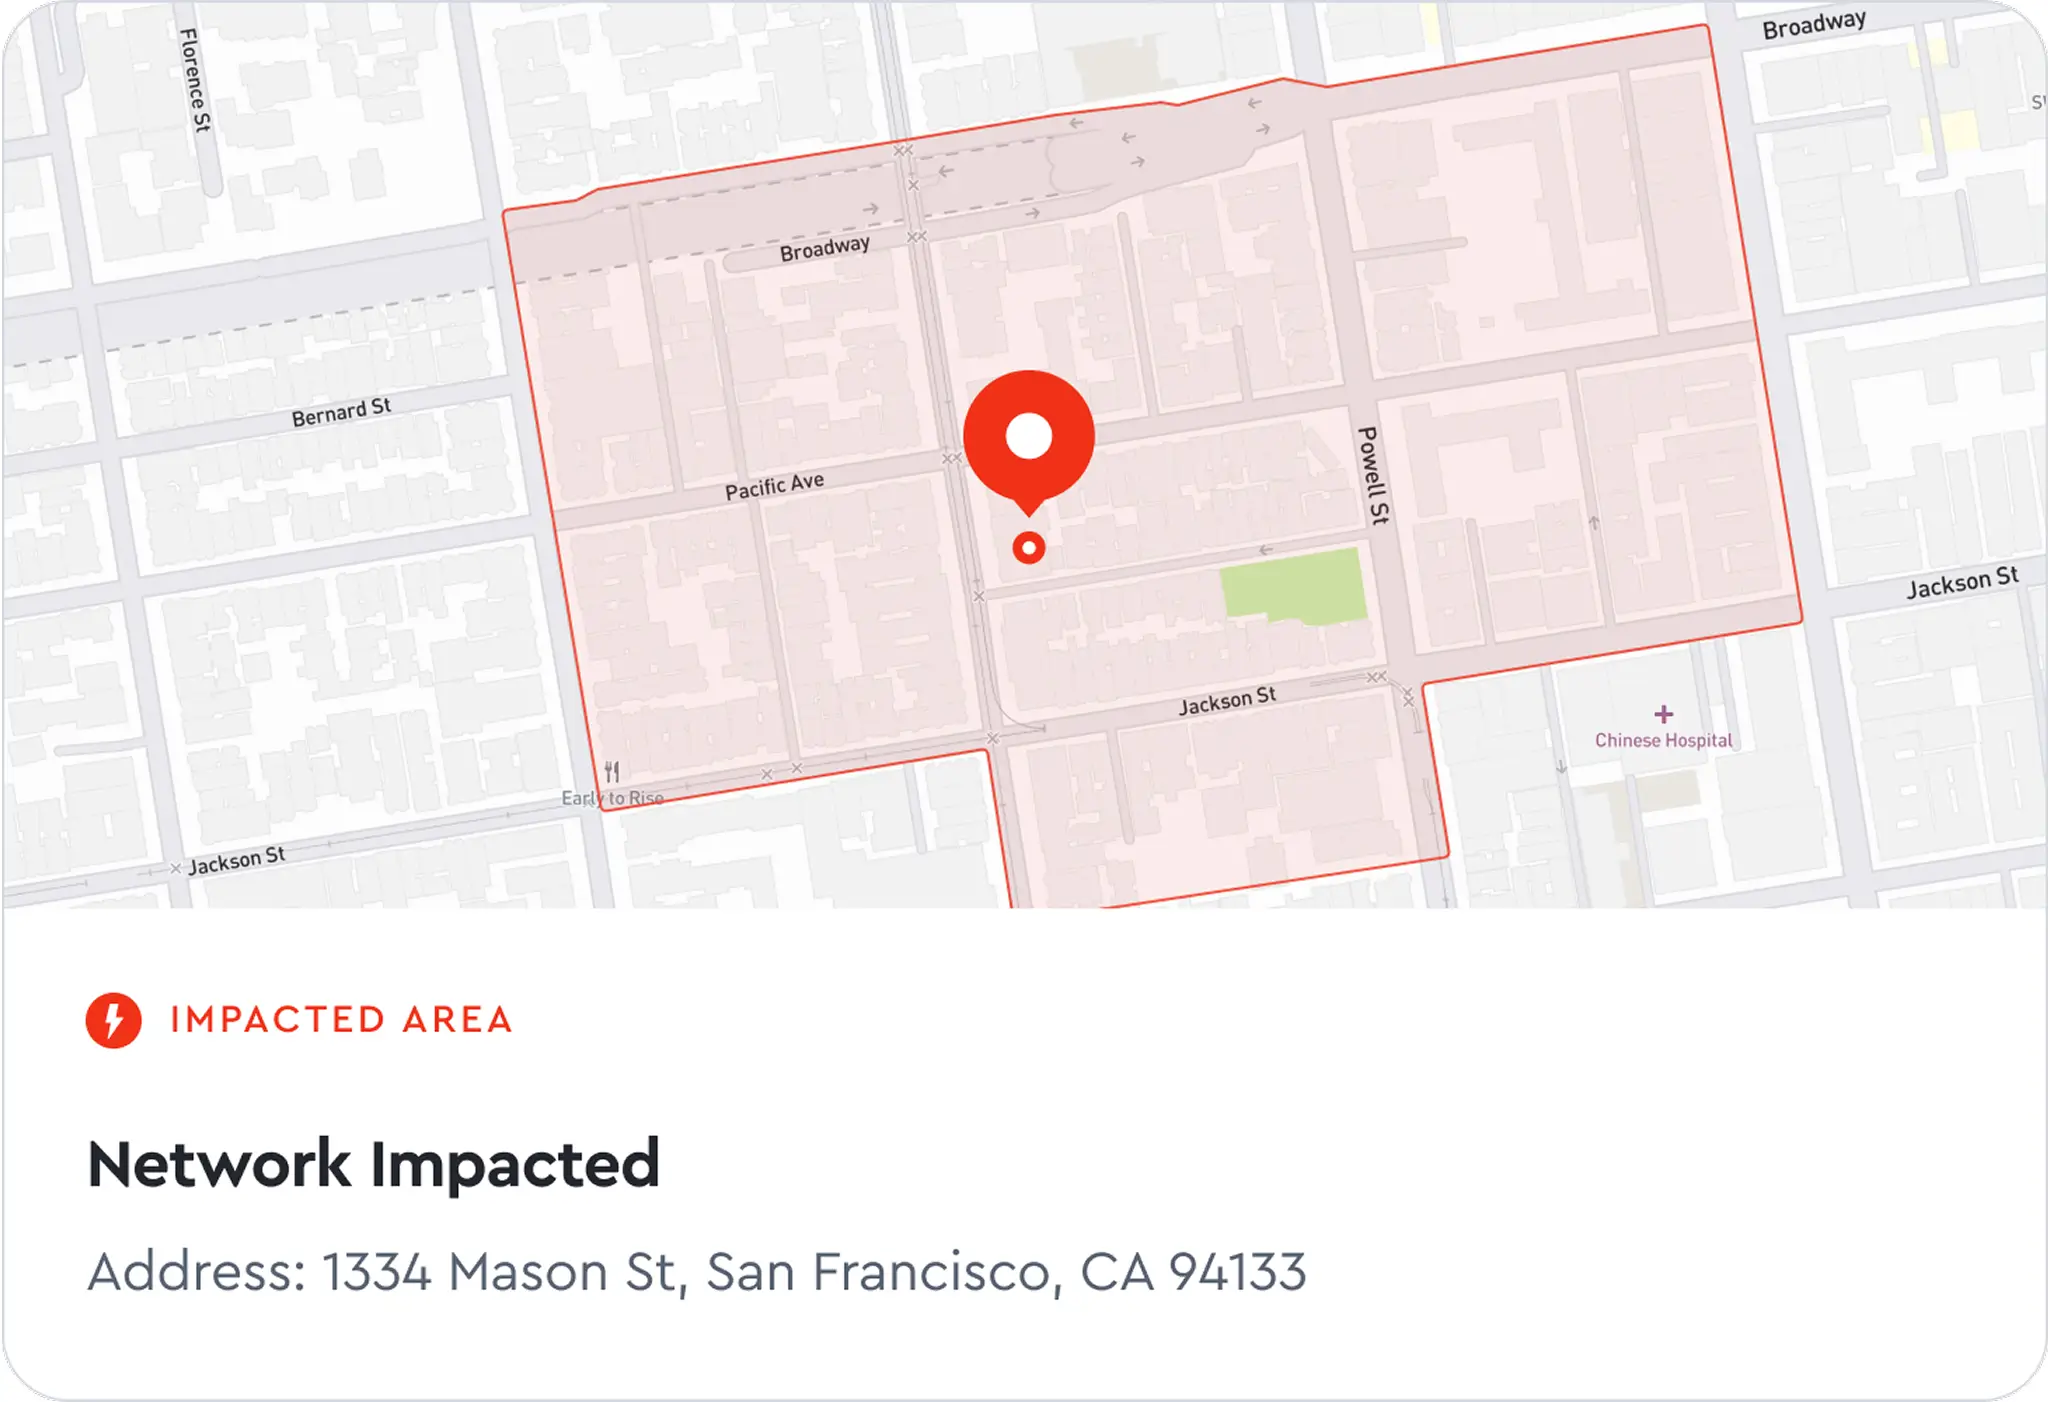
Proactive support maintains customer trust
Precise outage maps help customers instantly understand issues affecting their service. Internally, they give support teams clear visibility into impacted areas and equip network operations centers to detect issues early, reinforcing customer confidence.
Create daily value beyond connectivity
Embed location services into daily routines and value-add features that strengthen customer loyalty and retention. For example, family safety applications with family member monitoring and geofenced alerts turn connectivity into everyday utility.

Streamline internal and external processes with AI
AI agents and location intelligence guide customers to the right plan. Mapbox-aware coding assistants accelerate development.
AI agents guide customers to the right plan
AI-driven digital assistants paired with maps and location data help customers understand network value through natural conversation. By answering questions about coverage, performance, and daily usage patterns, AI agents provide network intelligence that guides customers to the right plan while reducing operational costs.

Speed up application development with AI
Make AI coding assistants Mapbox-aware to accelerate development. When tools like Copilot can access Mapbox tokens, styles, and utilities, teams can automate many map making steps with natural language prompts.
Customer stories


Resources

Streamline telecommunications field service operations with Mapbox

Building Telecommunications Coverage Maps with Mapbox
Optimize Telco Network Planning With Mapbox Movement Data
Ready to get started?
Create an account or talk to one of our experts.
Customer stories


Mapbox equips T-Mobile to integrate network and commercial data for rapid analysis of billions of data points. With coverage mapping and hex bin analysis, teams can prioritize investments, deploy insights faster through customizable dashboards, and improve network performance while reducing costs and churn.
Read showcase →

Ookla leverages Mapbox maps to communicate internet performance tailored for specific markets and customers. Ookla maps visualize over 10 million daily speed tests and hundreds of millions of mobile network coverage scans.
Read showcase →

The Federal Communications Commission mapped national broadband speed and availability across the US at the neighborhood level. That’s over 68 million records, across 11 million blocks, with 441 different broadband providers — all on one map.
Read showcase →

SpaceX uses Mapbox to power their Starlink availability map. As more satellite constellations are launched every week, the map communicates the rapid expansion. Customers use Mapbox Search to sign up and check coverage for their location.
Resources
Streamline telecommunications field service operations with Mapbox
Building Telecommunications Coverage Maps with Mapbox
Optimize Telco Network Planning With Mapbox Movement Data
Ready to get started?
Create an account or talk to one of our experts.