Mapping for good at BUILD with Mapbox 2025
Guest presentations share how maps help address food security, climate projects, transportation, and social programs.
Digital maps shape how people understand their world. They help people find what they need, make sense of data, and see patterns that would otherwise be hidden. But maps are also tools for care. They can guide someone to a hot meal, help a scientist protect a forest, or give city planners information about the ways people actually move through their communities.
At BUILD with Mapbox 2025, several teams shared how they are using mapping technology to support food access, climate work, transportation research, and community services. Their stories show what happens when projects dedicated to public good are equipped with fit-to-purpose geospatial technology.
This article highlights four sessions from Lemontree Food Helpline, Earthshot Labs, MIT’s Atlas of Popular Transport, and DataKind. Read on for highlights about how Mapbox supports each organization to create change at scale.
Lemontree Food Helpline: Maps that help people find food assistance with dignity
Access to food is a basic human need, yet many people struggle to find accessible food assistance in their neighborhoods. In the BUILD with Mapbox session “Navigating to Nourishment: Technology for Food Equity,” Sam Cole, CTO of Lemontree Food Helpline, explained how the organization uses Mapbox to support individuals facing food insecurity.
Lemontree connects people across eleven regions of the US to nearby food resources, such as pantries, soup kitchens, and community programs, through an easy-to-use map experience. Their mission is simple: no one should go hungry because they cannot find help.
How Lemontree uses Mapbox
For SMS and WhatsApp messaging, Lemontree uses the Mapbox Static Images API to generate map images when recommending nearby food pantries—providing essential context while keeping performance fast and lightweight. On its website, Lemontree provides an interactive web map built using react-map-gl, community-supported components for building with Mapbox GL JS in React.
The web map displays local food resources and allows users to toggle between a list and map view, search based on proximity to an address, and filter by opening days. On the directory pages for the website, the Mapbox Static Maps API also provides snapshot maps in the ‘resource cards’ for each pantry, reducing the compute power to load a map image – which is important especially for clients who have older devices or constrained connectivity.
Mapbox is such an incredible part of our technology stack. Mapbox gives us the control of a modern product team, with the values and pricing that a nonprofit needs. We can style maps to feel joyful, reason about walking and vehicle trips instead of just raw distance, and use Boundaries data to help partners see their impact—all in one stack. — Sam Cole, CTO, Lemontree
Maps and directions as a tool for care
Sam Cole emphasized that Lemontree’s goal is not simply to send someone from point A to point B, but to give people clarity and dignity during moments of stress. The map and travel time details are more than just a technical feature, they help to reduce stigma and improve accessibility of accessing support that may be just minutes away.
Earthshot Labs and LandOS: Boundaries for climate impact
Nature-based carbon projects require many steps: defining a project’s boundaries, reviewing land eligibility rules, analyzing vegetation, checking past land-use, and more. These tasks often involve multiple tools and a high level of technical skill.
In the session “Drawing Carbon Boundaries: How Mapbox Powers Land Eligibility Analysis in Earthshot’s LandOS Platform,” Emily Kauffman, Senior Software Engineer at Earthshot Labs, explained how Mapbox supports LandOS, a platform that turns these complex workflows into simple steps.

Building a map experience that makes science faster
LandOS allows scientists, landowners, and project developers to draw or upload polygons that represent potential project areas. These shapes are then processed automatically to generate insights about carbon potential, legal compliance, land cover type, and ecological classifications.
Mapbox helps power this experience through:
- Mapbox React components for clean and responsive map layouts
- Mapbox Search Box API for place search, which Emily configured in “about half an hour,” as she shared
- Mapbox Draw for creating and adjusting polygons
- Satellite layers and custom map styles for reviewing changes over time
Once a polygon is set, LandOS runs geospatial computations that previously could take scientists days or weeks. Tools like Terra Vista automate land eligibility checks, helping users move quickly from idea to project planning.
We’re taking all of these tools that used to take scientists a long time and making this really easy drag-and-drop way to get that information. - Emily Kauffman, Senior Software Engineer at Earthshot Labs
Building reports and data views that matter
LandOS also allows users to pull together customized reports made of “widgets” that show carbon potential, habitat type, ecological risk levels, land classification, and other important signals. This makes it easier for scientists to share findings with stakeholders and project partners.
The platform continues to grow, with future improvements planned for drawing tools, performance at large scales, and exporting capabilities.
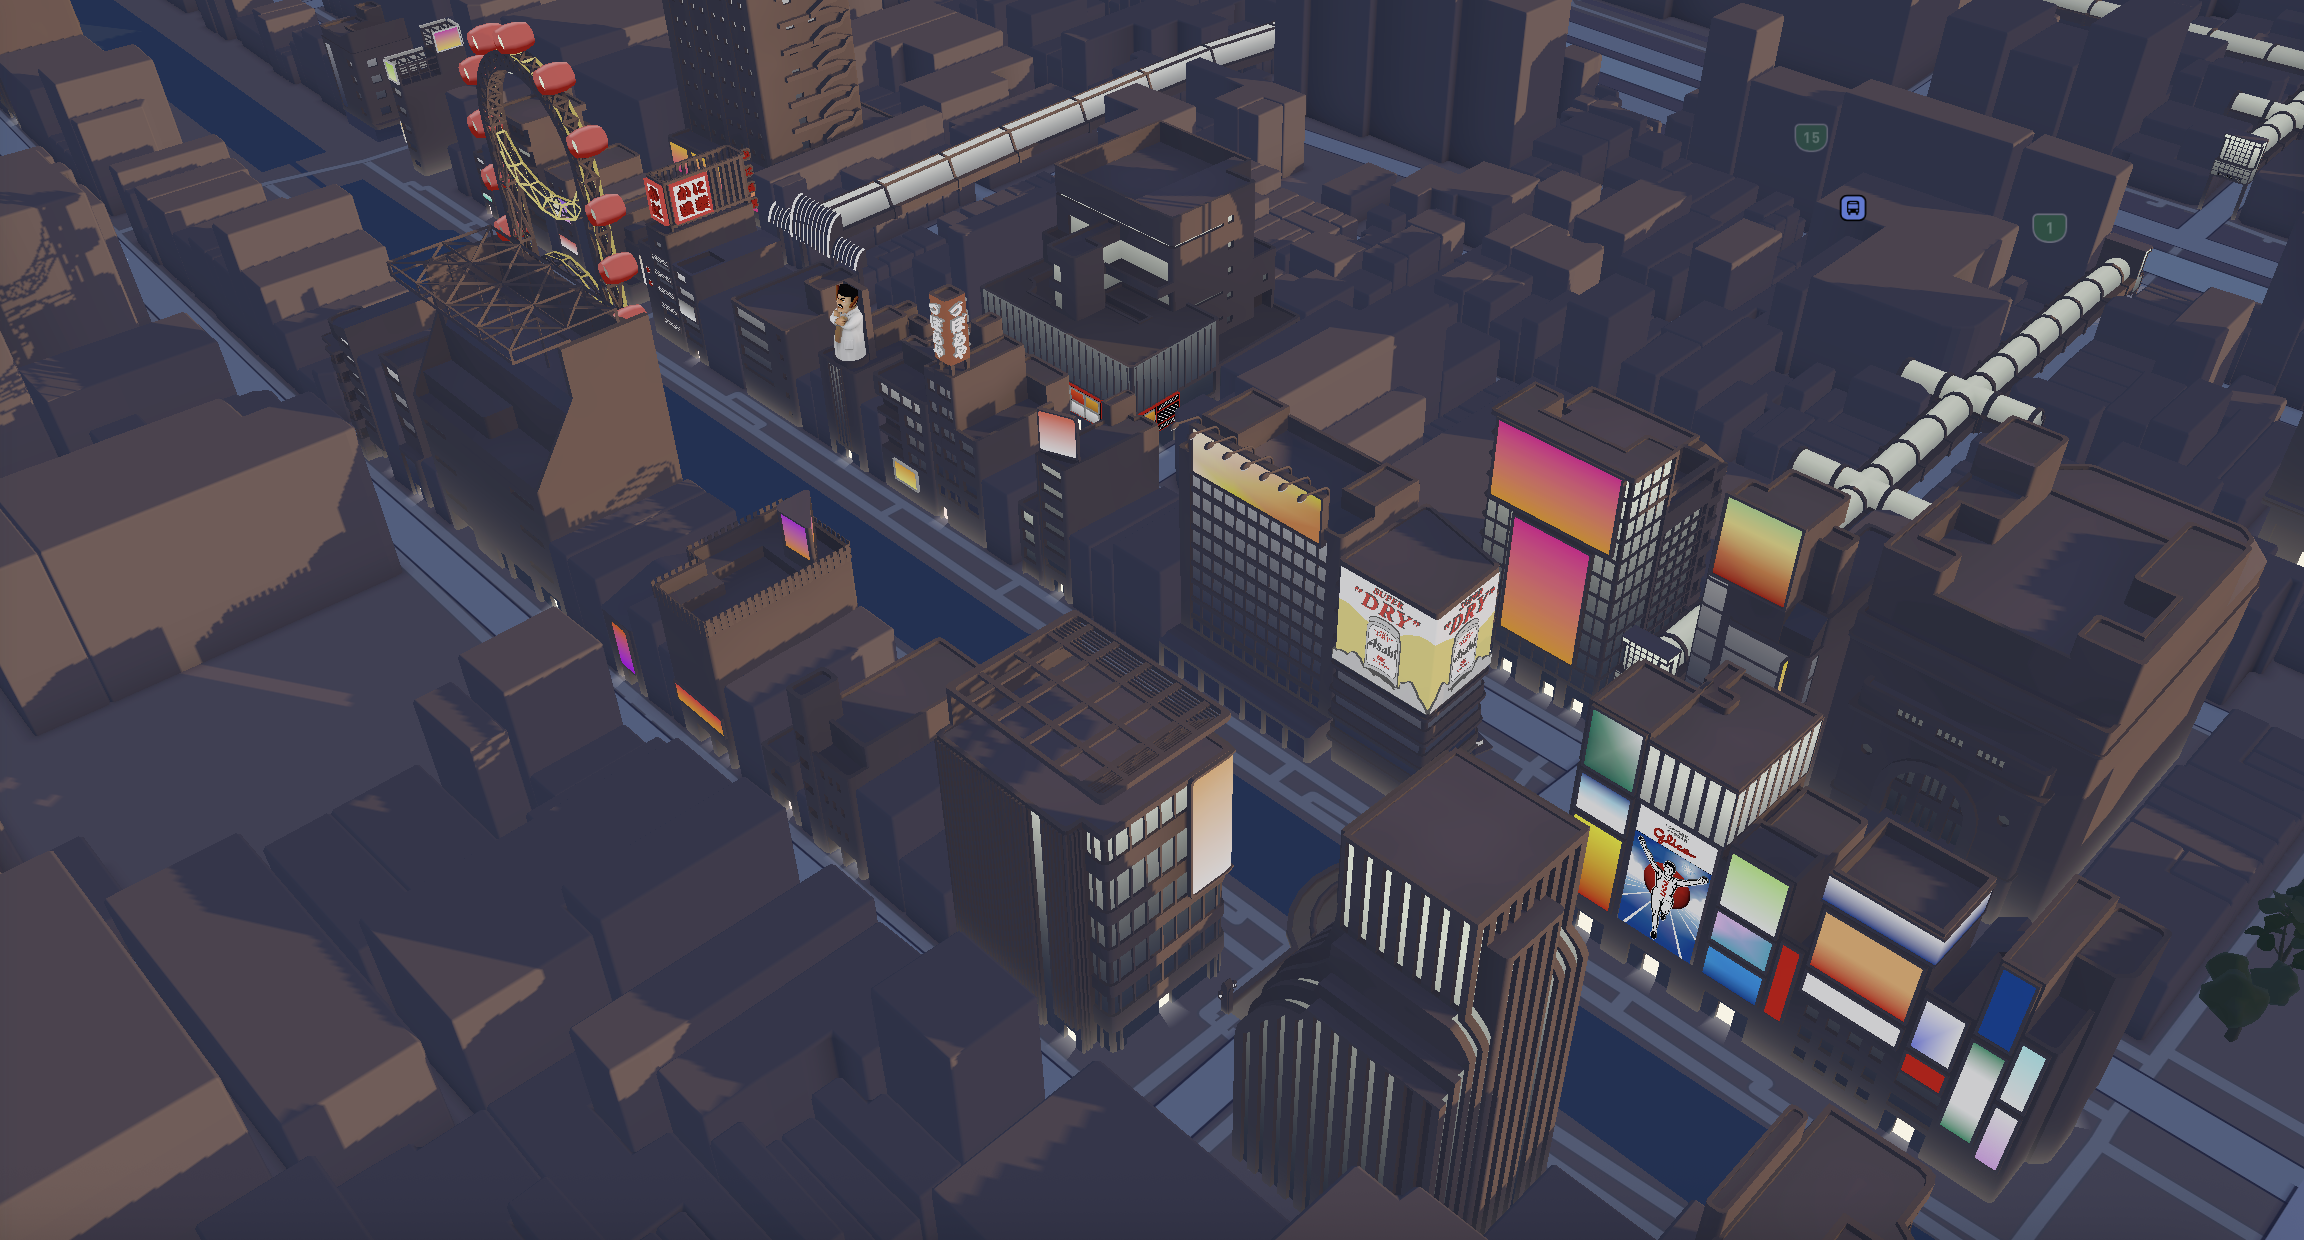
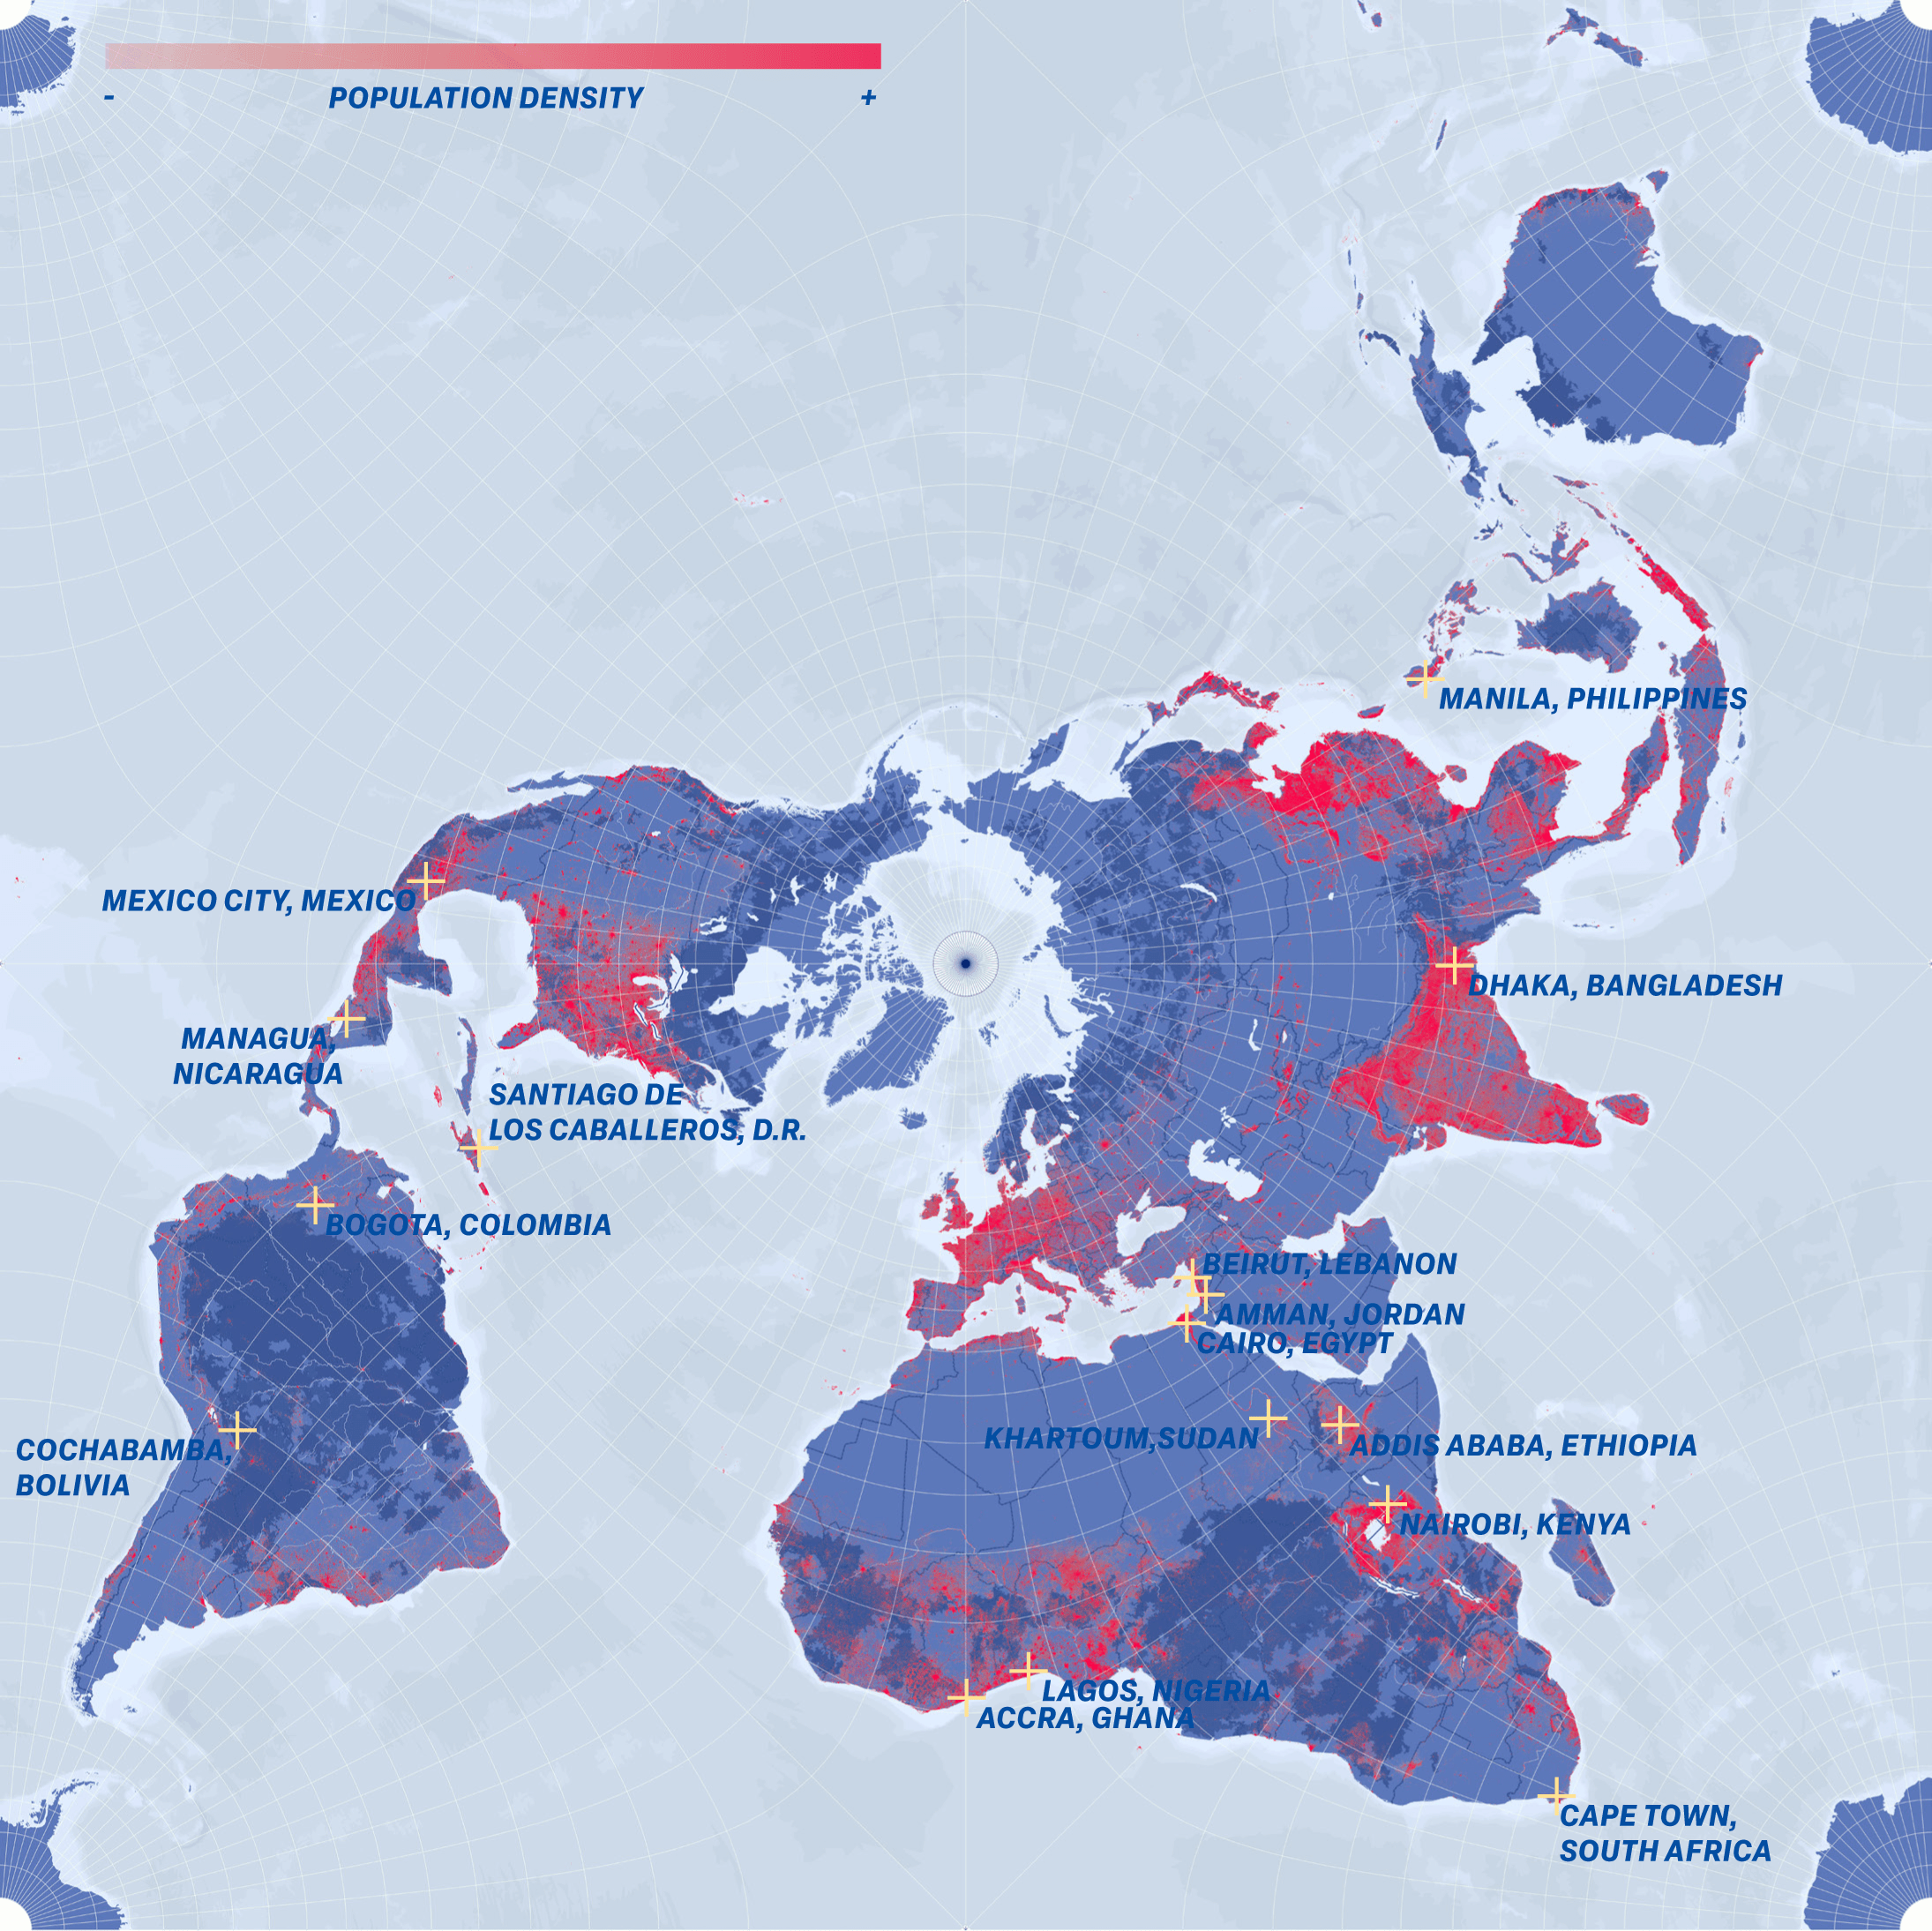
MIT Atlas of Popular Transport: Bringing visibility to informal transit networks
In many cities throughout Africa, Asia, and Latin America, “popular transport” is the primary way people move: shared vans, minibuses, tuk-tuks, jeepneys, matatus, and other community-driven systems. These routes are essential, but often have no official schedules, no digital record, and no map.
MIT’s Civic Data Design Lab set out to change this. In the session “Atlas of Popular Transport: Democratizing Mobility Data,” researcher Alberto Meouchi described how the team is working with local partners to collect GPS traces, validate routes, and publish standardized GTFS feeds, which stands for General Transit Feed Specification.
How Mapbox supports the Atlas of Popular Transport
The Atlas of Popular Transport uses:
- Mapbox Studio to design map styles
- Mapbox GL JS to animate vehicle movement
- Satellite layers to show how routes relate to the physical environment
- GTFS overlays to display system-wide patterns
The Atlas of Popular Transport maps reveal fascinating commuting flows that city planners rarely get to see. They help communities compare formal routes with informal ones, spot gaps in access, and understand how people actually move.
What’s hard isn’t drawing the lines. It’s the workflow… community data collection, quality checks, merging formal and popular systems, and publishing data sets people can use.” -MIT Civic Data DesignLab researcher Alberto Meouchi
Opening mobility research to the public
The project’s website offers interactive maps, city case studies, and open data downloads. The goal is transparency: helping researchers, policymakers, and communities understand transit patterns that were previously invisible.
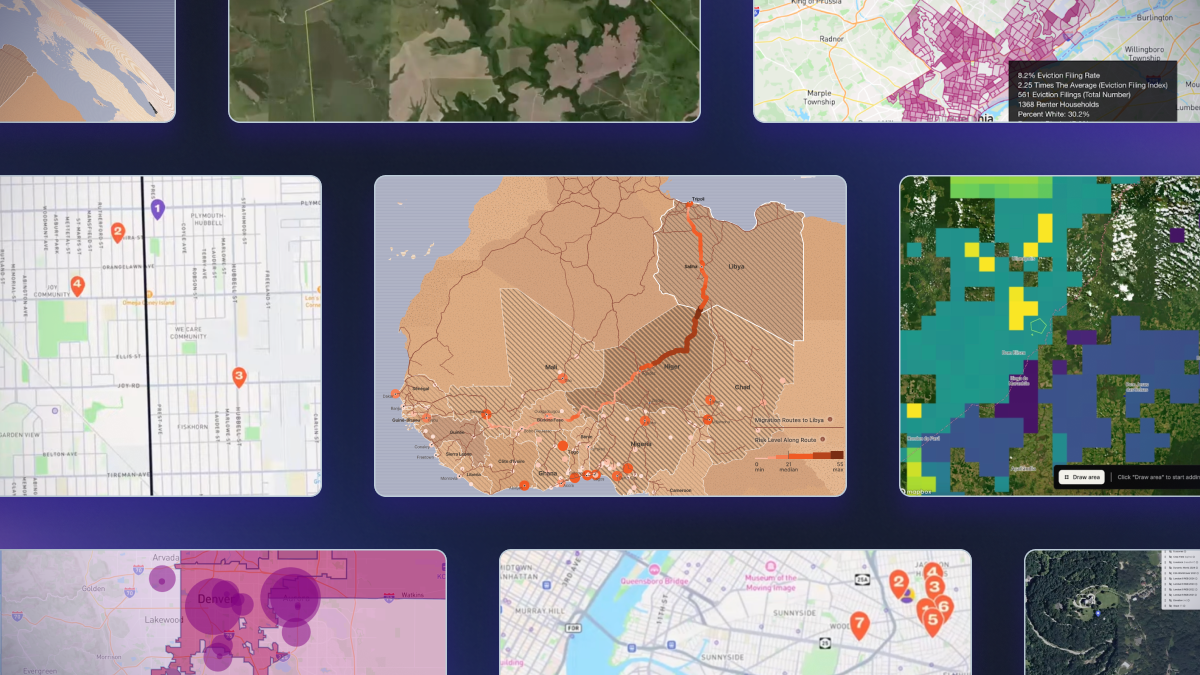
DataKind: Using maps to strengthen social services and public programs
DataKind is known for advancing the “Data for Good” movement, bringing together volunteers and nonprofits to solve community challenges. But as the organization matured, it needed to shift from one-time prototypes to stable tools that could be adopted widely.
In the BUILD with Mapbox session “Mapping For Impact: Scaling Social Good With DataKind And Mapbox,” Acting Director of Technology Sophia Harms shared how Mapbox plays an important role in this transition.
Using Mapbox to help communities understand housing, food access, and wellbeing
DataKind builds tools that make social systems easier to understand. Several examples highlight how Mapbox supports this work:
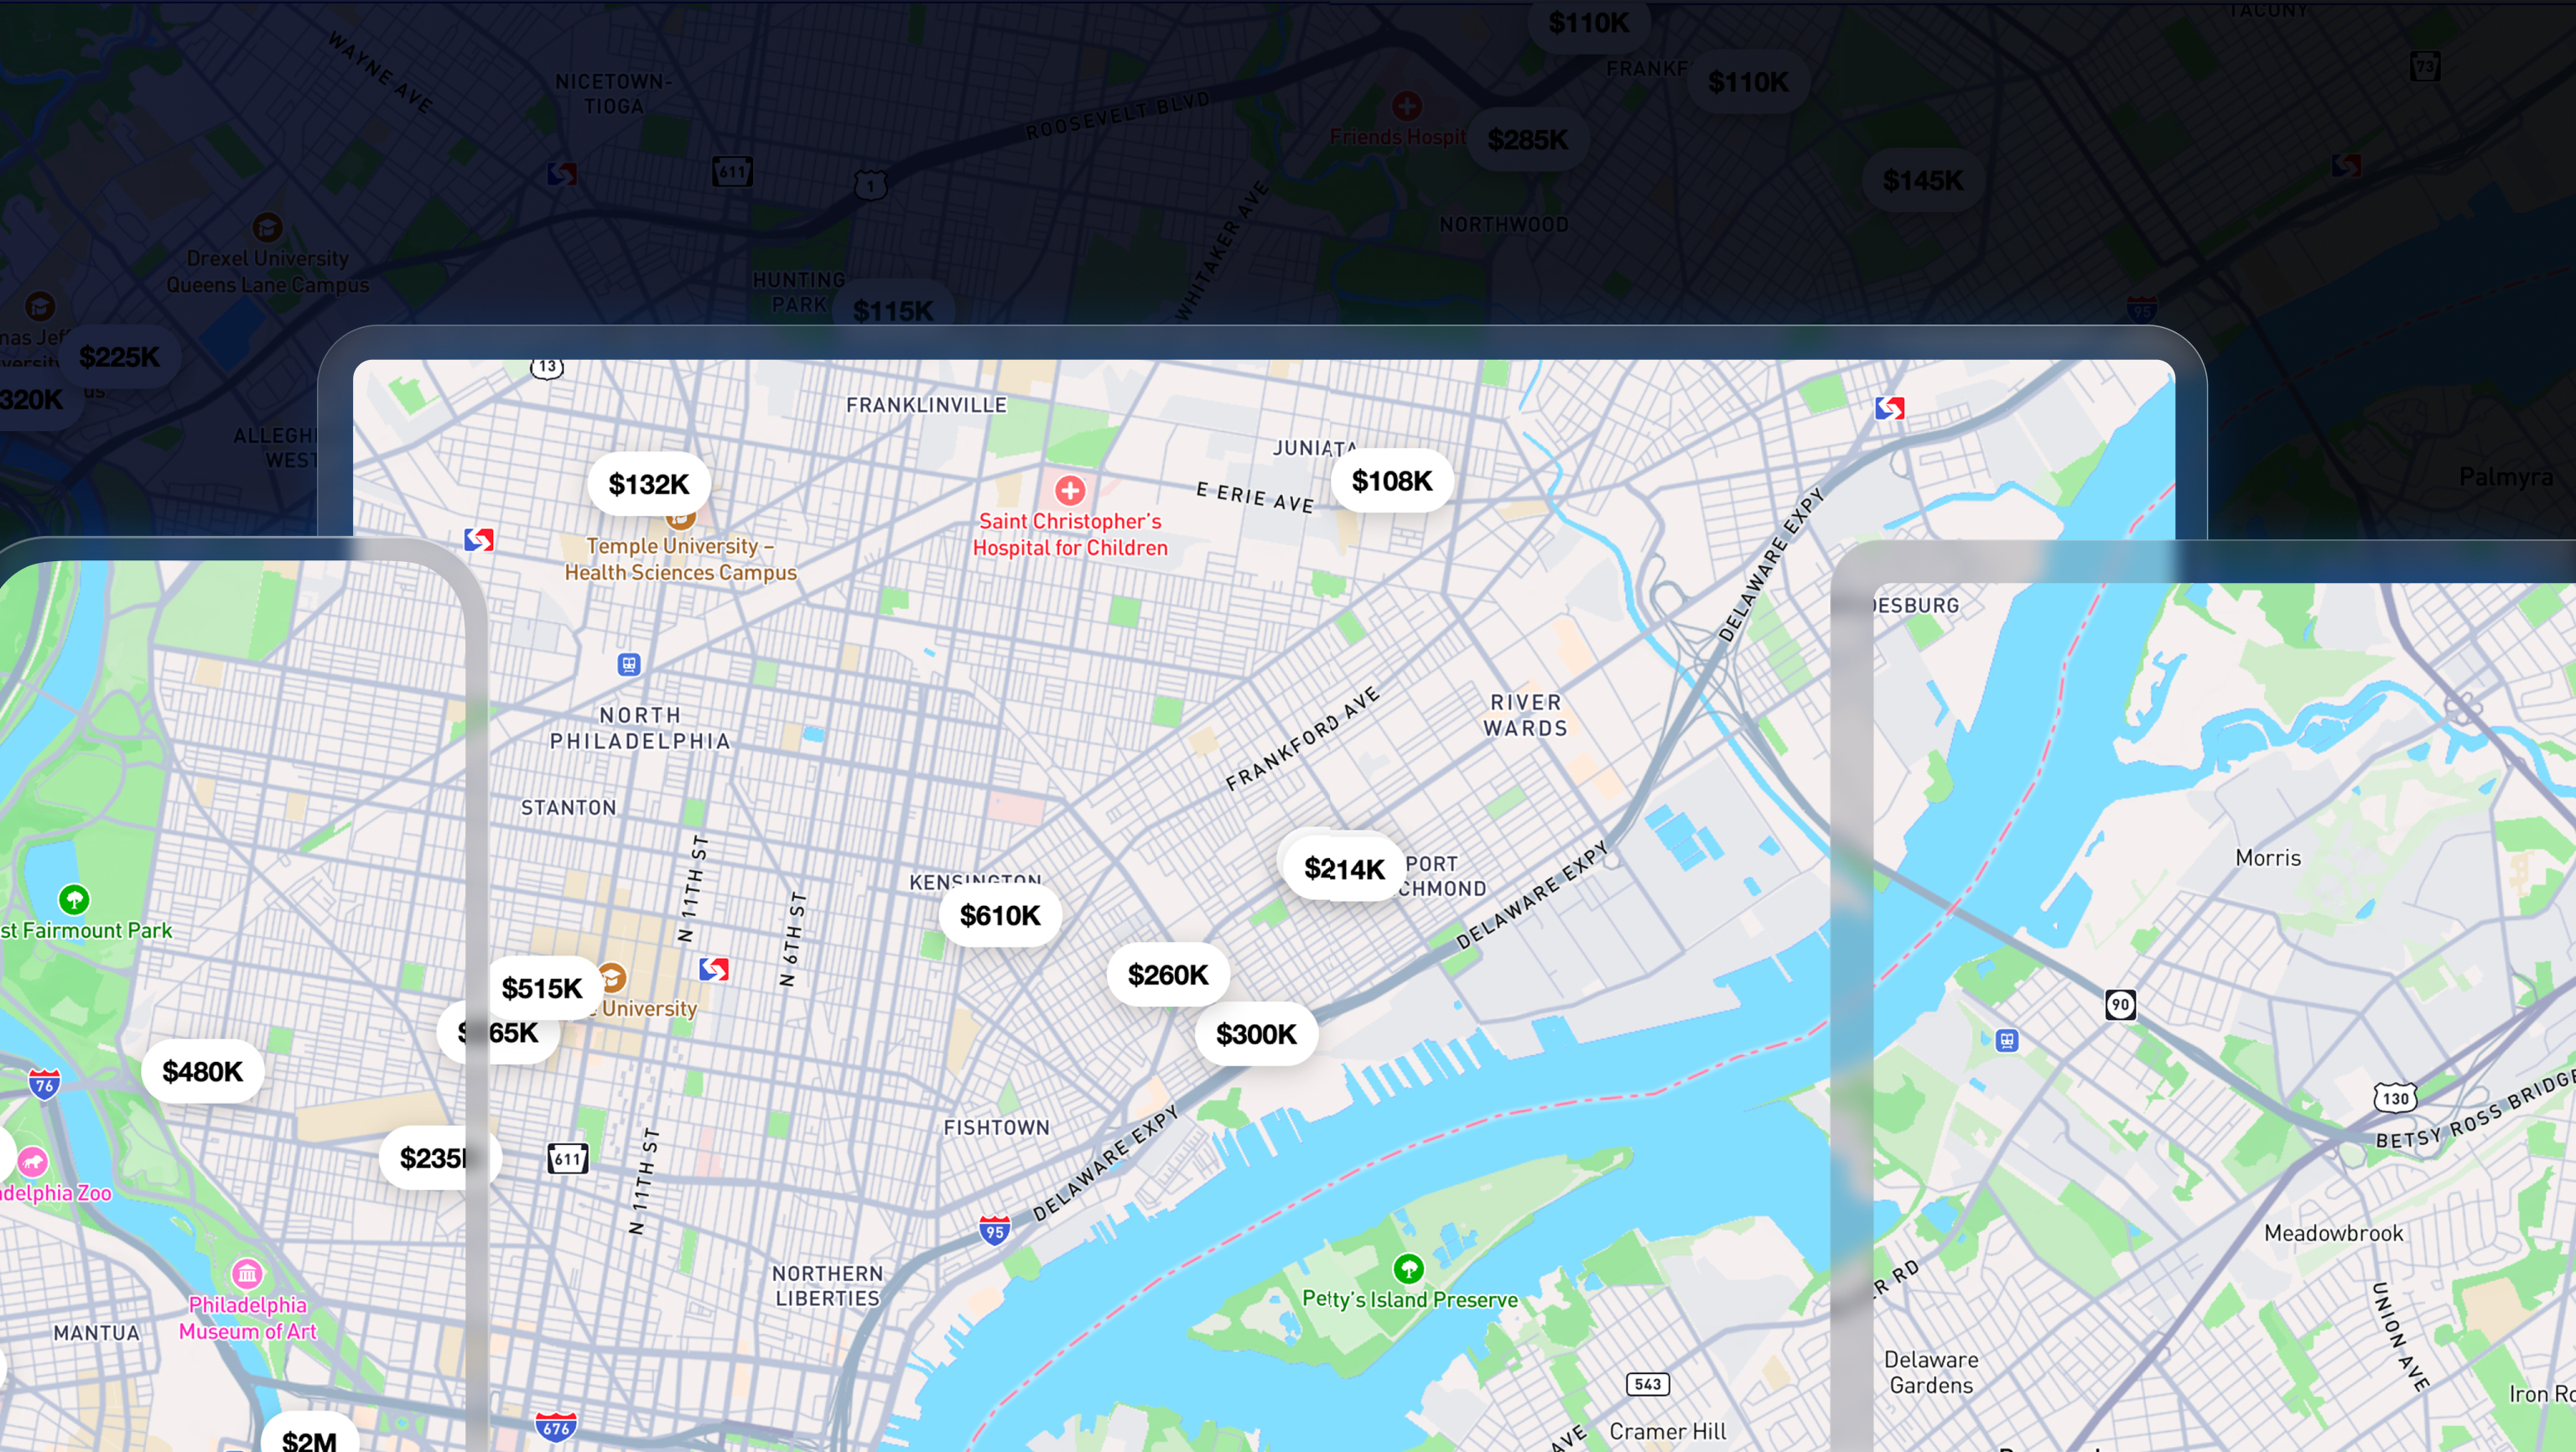
FEAT: The foreclosure and eviction analysis tool
Created with New America, FEAT helps the public view complex housing data through clear Mapbox dashboards. Switching to Mapbox Boundaries improved performance and made geographic comparisons simpler.
Mapbox boundaries data performance is unbeaten. Mapbox handles massive datasets at highly granular boundary levels without blinking, and resolved FEAT’s performance issues — clearing the path for future products that put mapping analysis at the center. –Sophia Harms, Director, Engineering, U.S. Community Products, DataKind
United Way 211 resource equity map
Built to support volunteers in South Dakota, this map displays essential services (food access points, markets accepting EBT cards, and more) helping families identify the support they need.
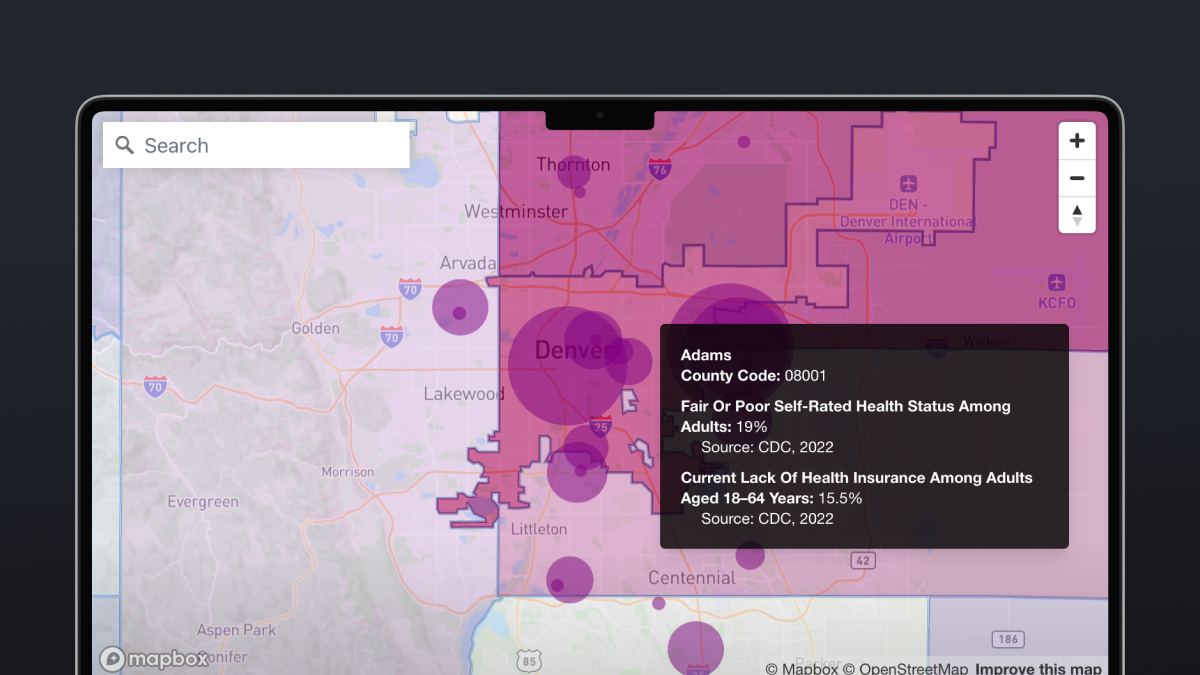
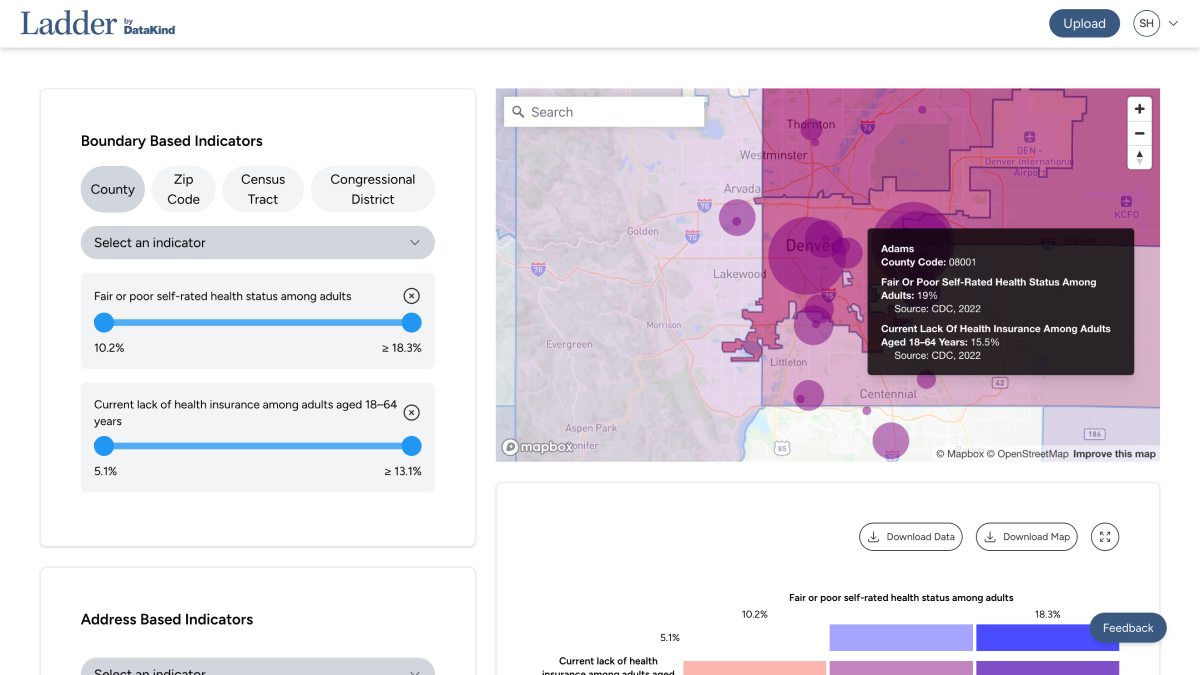
Ladder: Health and food access data
Developed with Second Harvest Food Bank, Ladder lets community organizations overlay their internal data with public health datasets, including ACS information. This helps identify gaps in support and neighborhoods that would benefit from outreach.
Sophia shared her excitement about building a platform that ties together DataKind’s tools, powered by Mapbox maps, search, and data services. By creating consistent building blocks, DataKind can help more partners reach more communities.
Stories of maps for good showcase how public good projects can harness location technology
Across all four stories, a theme is clear: there is huge, and varied, potential for mapping technologies to support work that cares for people, land, and communities. Whether it’s connecting someone to a food pantry in their neighborhood, helping scientists plan carbon projects faster, revealing hidden transit networks, or supporting organizations that improve housing and health outcomes, maps can be powerful instruments of support.
Thank you to the organizations that shared their stories of positive impact at BUILD with Mapbox 2025.
FAQs
How do nonprofits use Mapbox?
Nonprofits often use Mapbox for mapping, data visualization, geocoding, place search, and routing to explain complex issues or guide people to essential services.
Is Mapbox free for social impact projects?
Every year, Mapbox supports hundreds of nonprofit organizations with donated or discounted services, technical guidance, and promotion. Learn more about applying for Mapbox nonprofit support. If you are looking for support for a student project, research project, or educational institution, please first refer to this guide.
Where can I watch the BUILD With Mapbox sessions?
All BUILD with Mapbox sessions have full recordings available on YouTube.


Related articles
Build once, run everywhere: Web support comes to the Mapbox Maps SDK for Flutter
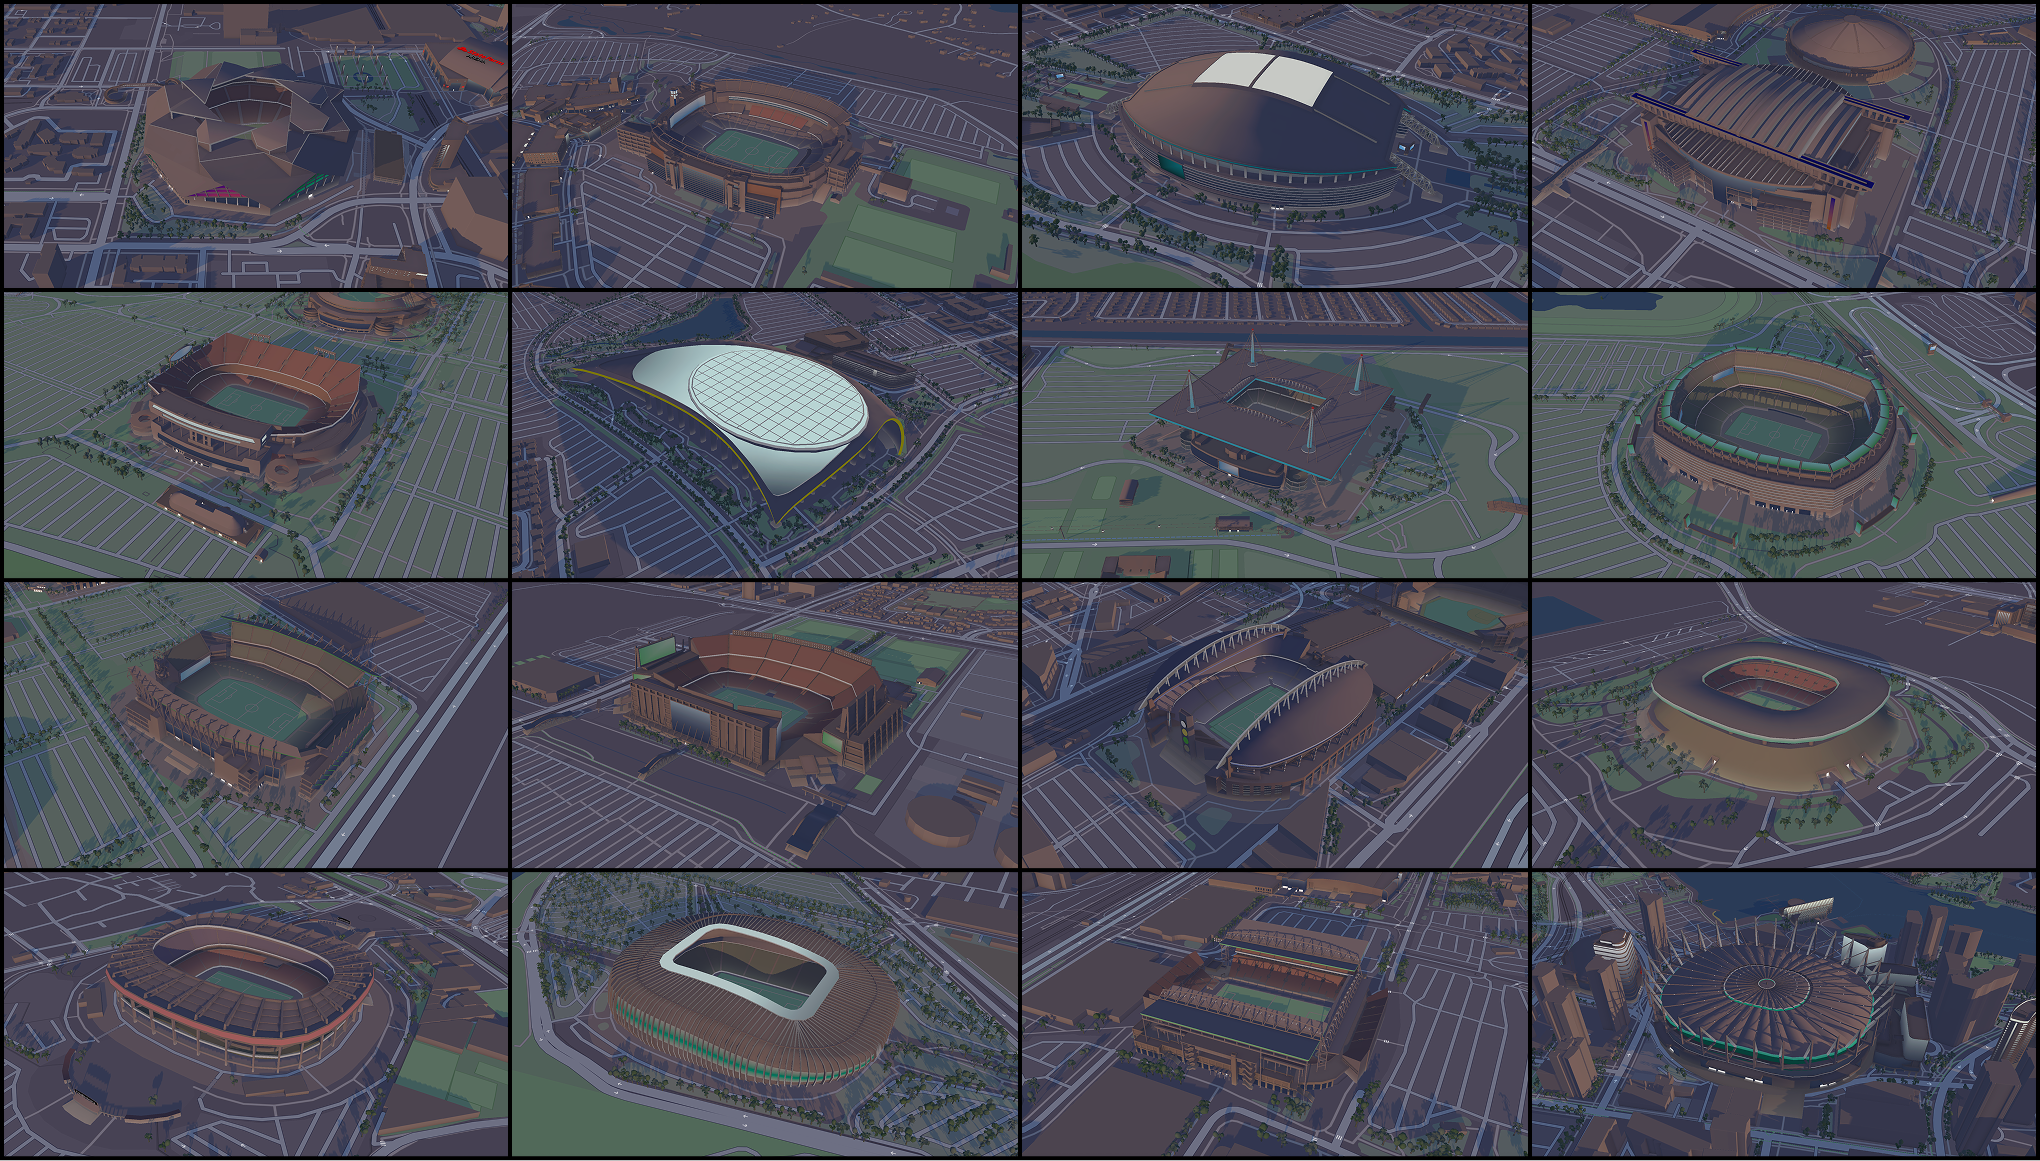
From airports to stadiums, maps are elevating the soccer fan experience