Rain cloud radar demo using Mapbox Japan weather layers
How I built a simple ‘rain cloud radar’ map with the Mapbox Japan Weather Layers
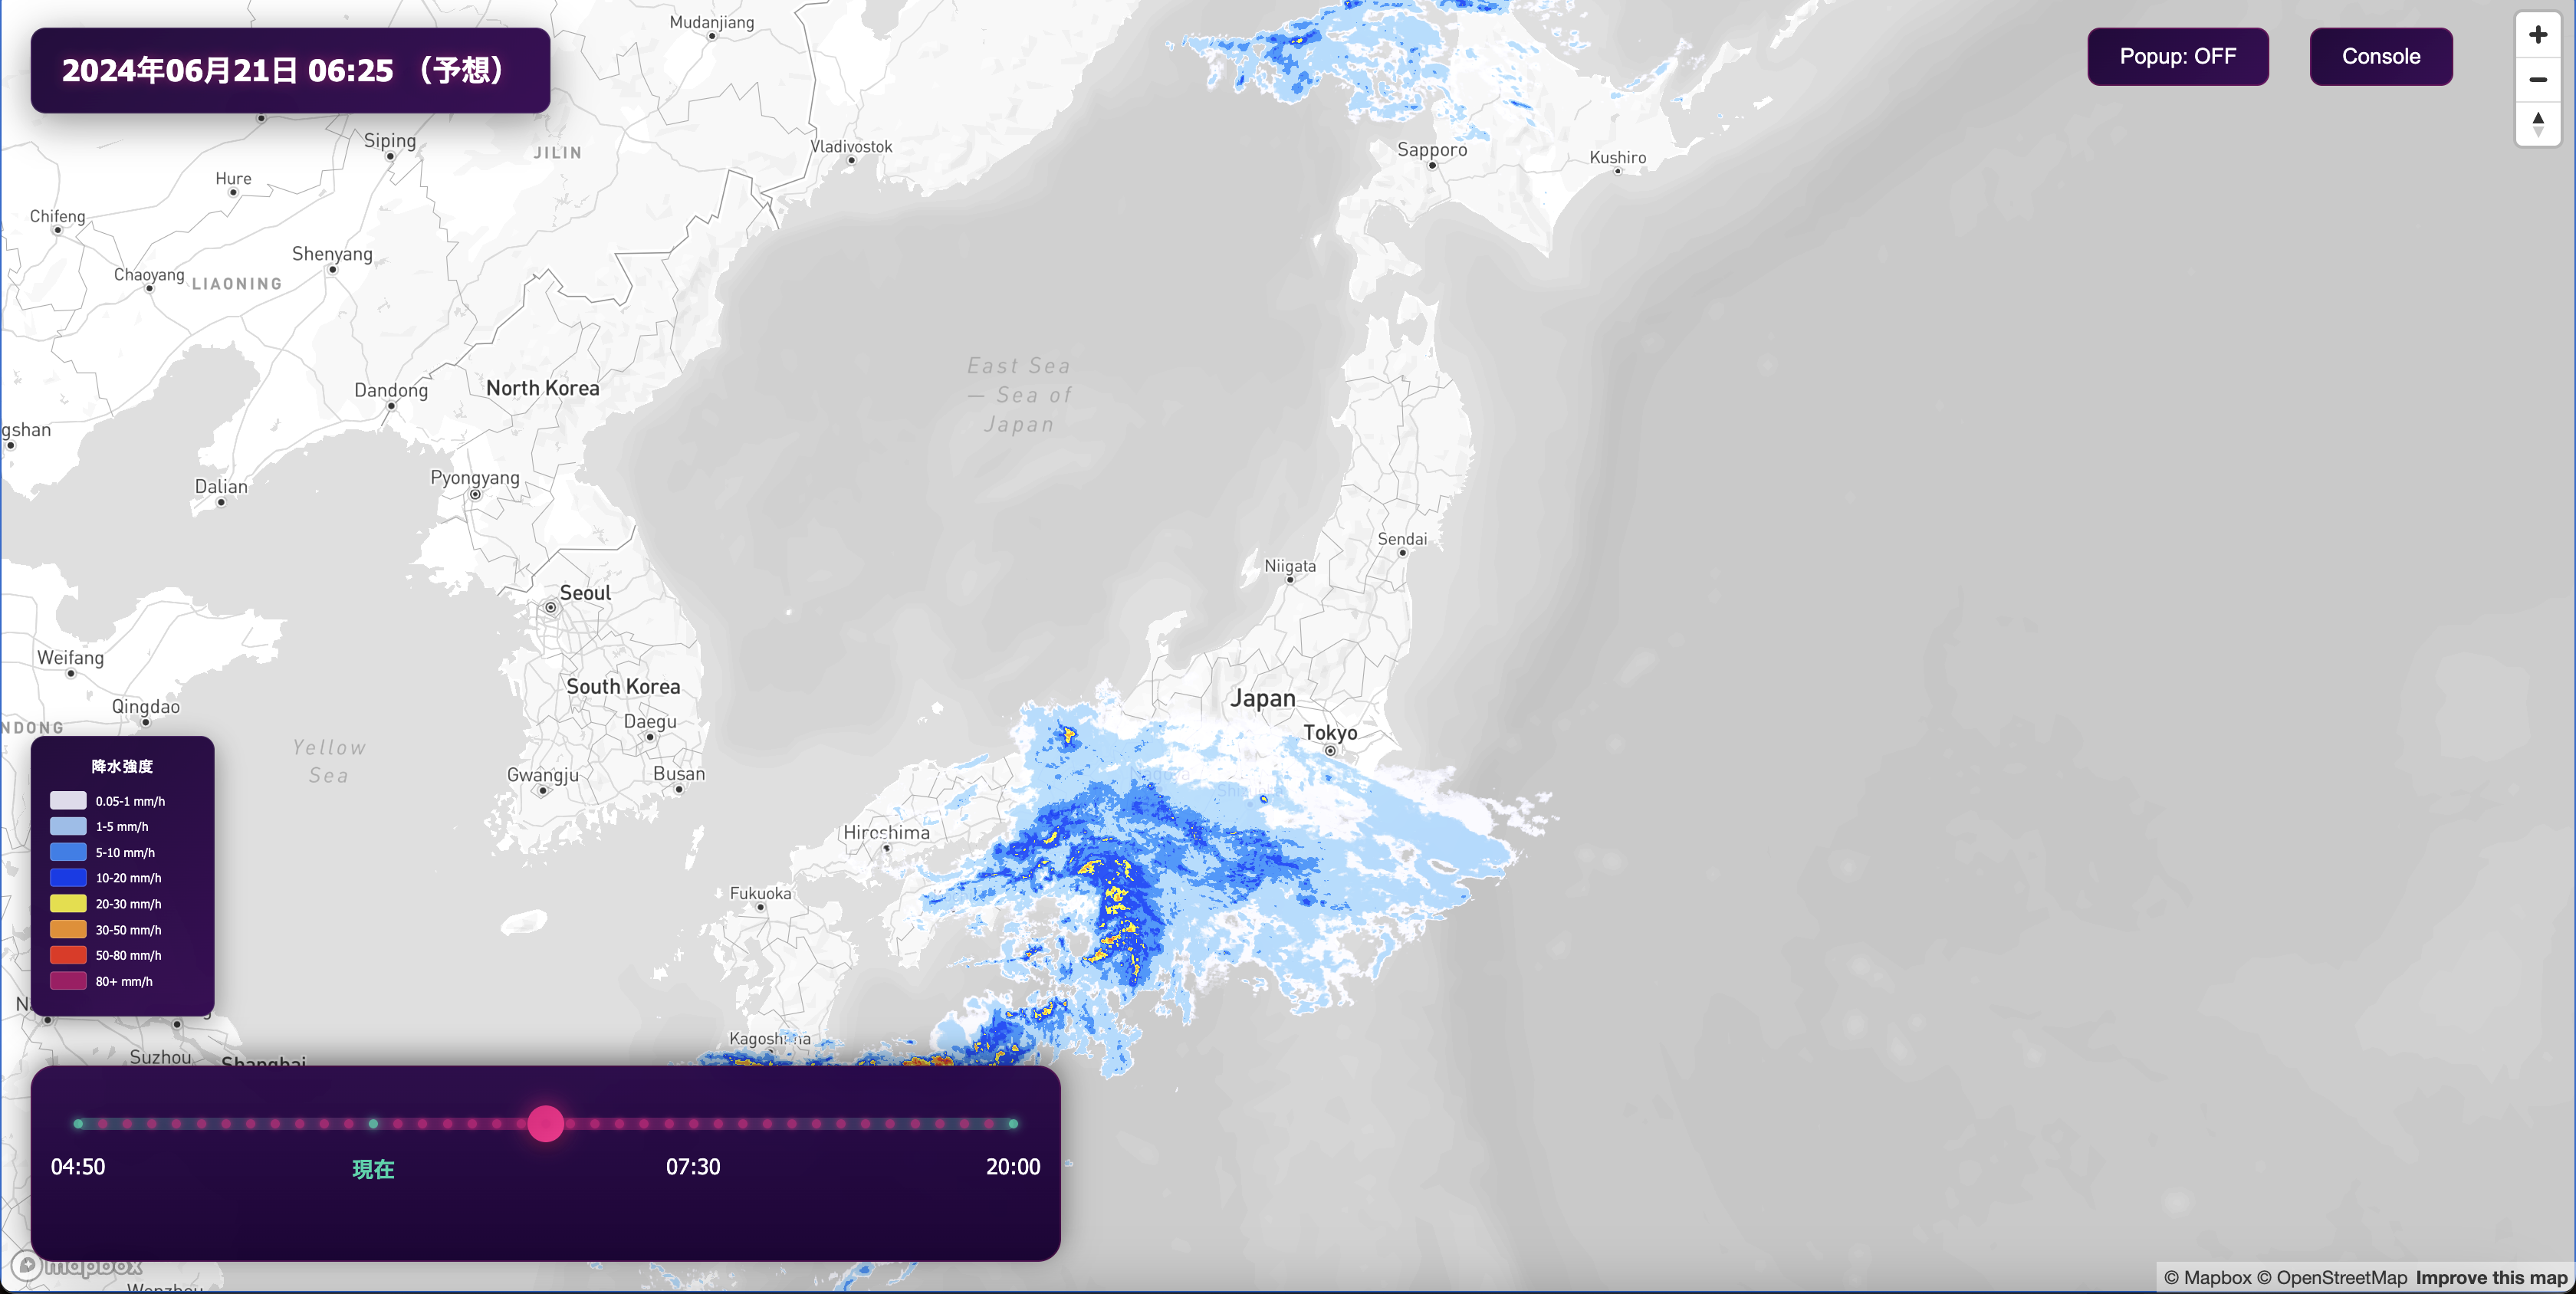
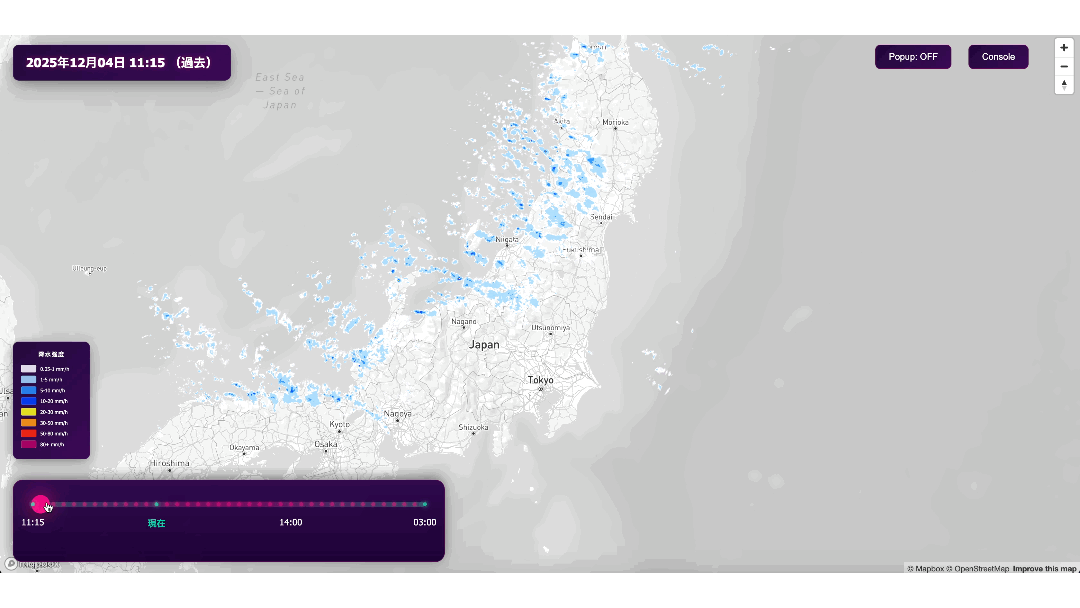
Rain cloud radar, which displays the current and predicted future positions of rain clouds on a map, is a popular service in Japan. It is utilized across various fields such as meteorological disasters, transportation, and marketing. This blog post details the process of creating a rain cloud radar using Mapbox Japan Weather Layers (JWL), a service that distributes weather data tilesets, and Mapbox GLJS. See the demo in action and check the Github repository for the full code.
About Mapbox Japan Weather Layers (JWL)
Meteorological data such as rain clouds is typically provided by organizations like the Japan Meteorological Agency in a binary format called GRIB2. Displaying this data on a map requires parsing the GRIB2 data and converting it into a tileset. Working from original raw data requires building complex pipelines and managing the infrastructure costs required to continuously convert the constantly updated meteorological data into tilesets. JWL enables anyone to easily display weather data on maps by converting it into tilesets for delivery via Mapbox, unlike conventional methods. Furthermore, by using the Mapbox Tilequery API in conjunction, weather data can be retrieved in JSON format. Read more about the Mapbox Japan Weather Layers.
The five elements that make up the rain cloud radar
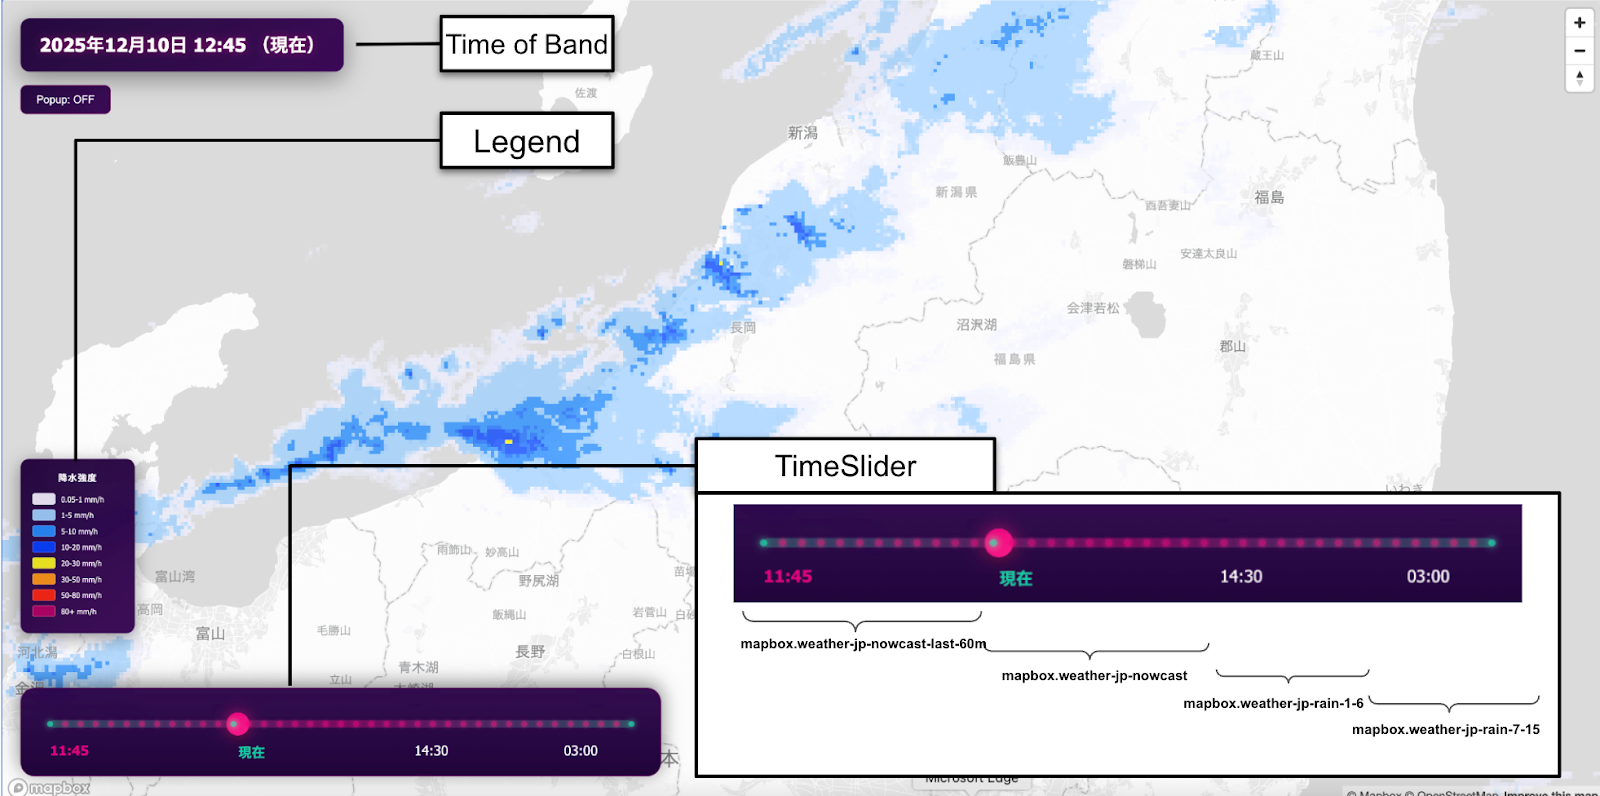
The rain cloud radar demo consists of the following five elements:
- Basemap layer
- Japan Weather Layers (JWL) tileset
- Precipitation legend
- Time slider to switch the band of the displayed tileset
- Time box showing the time of the currently displayed band
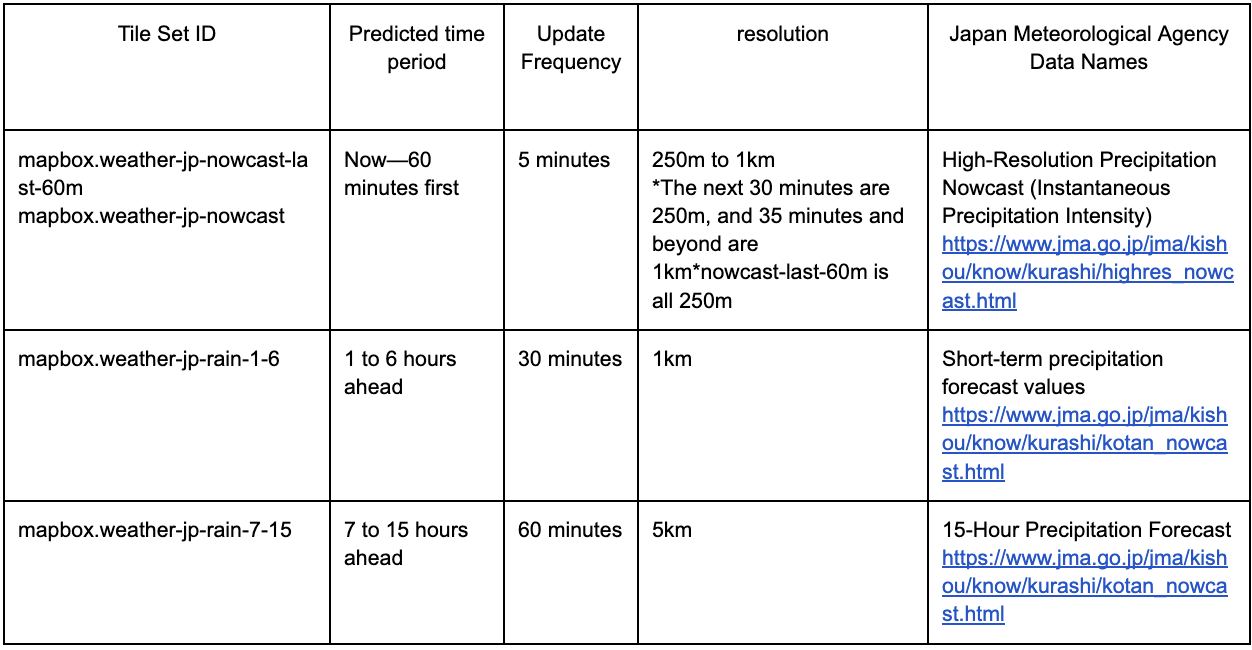
A ‘band’ is a single time slice of JWL tilesets. Each band represents different time data. For example, mapbox.weather-jp-nowcast contains 13 different time bands because it covers present precipitation and future precipitation up to 60 minutes away with 5 minutes incremental. Assuming the data starts at 9:00, the first band represents the observed precipitation at 9:00. Subsequent bands represent forecasted precipitation, with the second band being the 9:05 forecast, and this pattern continues until the end of the data, which is 10:00.
The basemap uses the mapbox://styles/mapbox/light-v11 style provided by Mapbox. The legend is displayed according to the color settings of the JWL tileset. In the time dialog, the currently displayed band (time) is converted to Japan Standard Time (JST) and shown. The JWL tileset uses the following four tilesets, and the time slider switches the band of the tileset displayed.
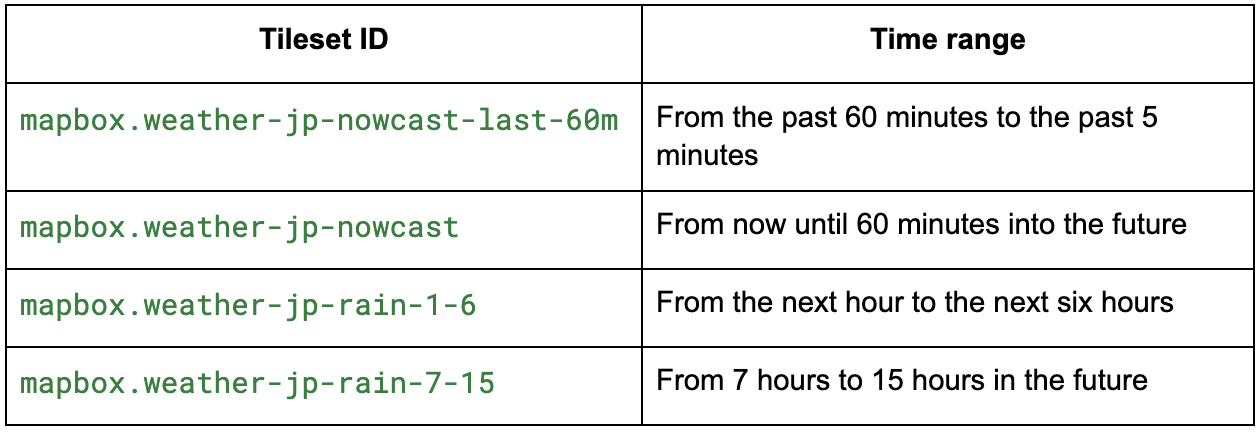
In addition to the tilesets used in this demo, see the full list of JWL tilesets available.
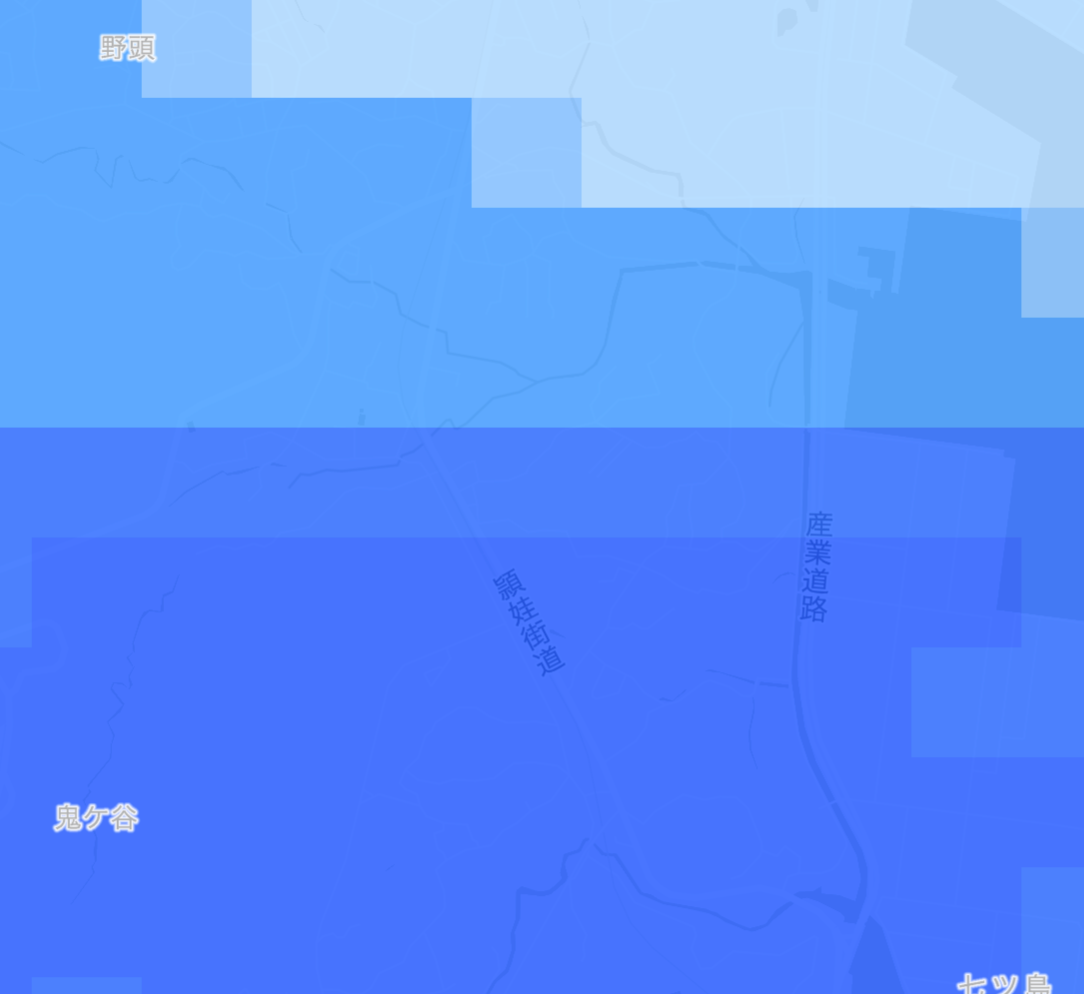
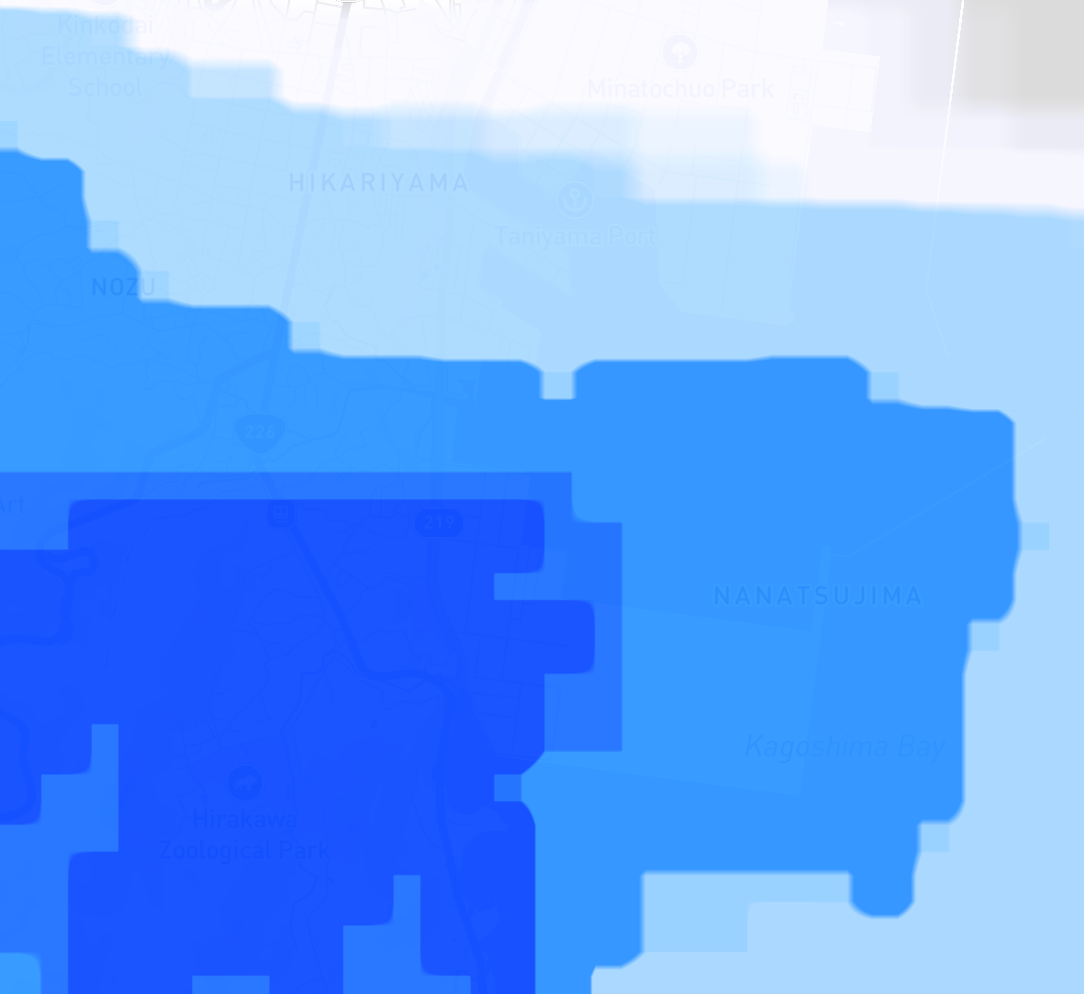
Visualize precipitation intensity by defining raster-color
How JWL precipitation values are represented by color directly impacts the user experience. The demo implementation adopts a color representation based on the Japan Meteorological Agency's standard precipitation classification. Below, when no value is present or the value is 0, the rgba is set to 0 to become transparent. Additionally, due to Mapbox specifications, if you wish to specify a color corresponding to, for example, a precipitation intensity of 1mm, you must write a value lower than 1 (0.99 in the example below) in the code.
const rasterColorExpression = [
  'step',
  ['raster-value'],
  Transparent black
  0.05, 'rgba(242, 242, 255, 0.9)',
  0.99, 'rgba(160, 210, 255, 0.9)',
  4.99, 'rgba(33, 140, 255, 0.9)',
  9.99, 'rgba(0, 65, 255, 0.9)',
  19.99, 'rgba(250, 245, 0, 0.9)',
  29.99, 'rgba(255, 153, 0, 0.9)',
  49.99, 'rgba(255, 40, 0, 0.9)',
  79.99, 'rgba(180, 0, 104, 0.9)'
];
Select a raster-resampling configuration
Setting raster-resampling to 'nearest' produces a representation with square grids arranged in a grid pattern, similar to typical rain cloud radar. Setting it to 'interpolate' produces a representation with a smoothed appearance. The default value is 'interpolate'.
map.addLayer({
    id: `rain-layer-${tileset.id}`,
    type: 'grid',
    source: `rain-source-${tileset.id}`,
    paint: {
        'raster-array-band': '',
        'raster-color': rasterColorExpression,
        'raster-color-range': [0, 100],
        'raster-opacity': 0,
        'raster-resampling': 'nearest',
        'raster-color-range-transition': {
            duration: 0
        }
    }
});
Load multiple tilesets together to achieve smoothness
Loading the tileset every time the time slider is operated causes UI delays and visual flickering. Therefore, the demo implementation adopts an approach where four JWL tilesets are loaded initially, and only the band (time) is switched in response to time slider operations.
map.addSource(`rain-source-${tileset.id}`, {
    type: 'raster-array',
    url: `mapbox://${tileset.id}`,
    tileSize: 1026
});
Organize time-series bands along a single time axis
The four tilesets cover different time periods. Therefore, to remove duplicate bands, sort the time series and position the current time to integrate them into a format usable as a single continuous time slider. Users can naturally operate from the past to the future on a single UI. Regarding overlapping bands in this rain cloud radar, due to the Japan Meteorological Agency's data specifications, the last band (60 minutes ahead) of mapbox.weather-jp-nowcast (covering rain cloud data from the present to 60 minutes ahead) and the first band (1 hour ahead = 60 minutes ahead) of mapbox.weather-jp-rain -1-6 (1 hour ahead = 60 minutes ahead) may indicate the same time. Therefore, the band from mapbox.weather-jp-nowcast, which has a higher update frequency, is prioritized for display.
allBands = [];
let lastNowcastBandId = null;

for (const tileset of sortedTilesets) {
    const result = results.find(r => r?.tileset.id === tileset.id);
    if (!result || !result.metadata) continue;

    const metadata = result.metadata;

    if (metadata.raster_layers && metadata.raster_layers.length > 0) {
        const layer = metadata.raster_layers[0];
        const layerName = layer.name || 'precipitation';
        const rawBands = layer.bands || layer.fields?.bands || [];

        // Parse and sort bands once
        let bandIds = rawBands
            .map(b => {
                if (typeof b === 'object' && b.band_id) return parseInt(b.band_id);
                if (typeof b === 'string' || typeof b === 'number') return parseInt(b);
                return NaN;
            })
        Filter the array to include only values that are not NaN.
            .sort((a, b) => a - b);

        // Apply filters based on tileset type
        if (tileset.id === 'mapbox.weather-jp-nowcast-last-60m') {
            // Remove last band (overlaps with nowcast)
            if (bandIds.length > 0) {
                bandIds = bandIds.slice(0, -1); // ← Remove last band
            }
        } else if (tileset.id === 'mapbox.weather-jp-rain-1-6') {
            // Only keep bands after last nowcast band
            if (lastNowcastBandId !== null) {
                bandIds = bandIds.filter(b => b > lastNowcastBandId); // ← Filter overlapping bands
            }
        }

        // Track last nowcast band for filtering next tileset
        if (tileset.id === 'mapbox.weather-jp-nowcast' && bandIds.length > 0) {
            lastNowcastBandId = bandIds[bandIds.length - 1]; // ← Store for comparison
        }
Switch bands according to slider operation
When the user moves the slider, the displayed band (time) switches instantly. By manipulating the opacity of JWL's tilesets, tilesets other than the displayed band become transparent. For example, when displaying the band for mapbox.weather-jp-nowcast, the opacity of the other three tilesets is set to 0.
map.setPaintProperty(layerId, 'raster-array-band', band.bandId.toString());
map.setPaintProperty(layerId, 'raster-opacity', 0.85);
Try Japan Weather Layers!
As explained above, you can easily implement weather map content such as rain radar with minimum engineering effort and cost by using the Mapbox Japan Weather Layers. Check the Github repository to get full code of the demo.
Notes regarding the Japan Meteorological Agency (JMA) data underlying JWL
The precipitation tile sets distributed via JWL are based on the numerical forecast and operational data from the Japan Meteorological Agency (JMA), which supports Japan's disaster prevention infrastructure.


Related articles
Turn AI-generated map styles into production-ready maps in minutes with Mapbox Studio
From upload to styled data layers in seconds: Smarter styling defaults in Mapbox Studio
