Building with climate prediction data
Combine Probable Futures tilesets with Mapbox applications

What if it were possible to see ranges of climate and weather outcomes we can expect in the future and make that information available in any application? Anyone could imagine and prepare for the second- and third-order effects on all parts of society, from infrastructure that will need to be updated to areas that will have changing human habitability conditions. Probable Futures, a climate literacy initiative, aims to enable anyone to do just that with free and open source maps, tilesets, styles and data available for use in any application, website, platform, or article.
Climate maps anyone can use
Probable Futures is a non-profit climate literacy initiative that makes practical tools, stories, and resources available online to everyone, everywhere. Among those tools are global maps that visualize our changing climate in different warming scenarios to show conditions like heat, humidity, drought, precipitation, storms and more. Probable Futures uses Mapbox tilesets and styles and makes them publicly available for anyone to integrate into any web or iOS application.
Imagine and prepare
Equipped with embeddable maps and tilesets, anyone can bring these maps to their own communities of users, readers, or customers by building with them.
4 ways to integrate Probable Futures maps and data
There are four ways to integrate Probable Futures maps and data into any application:
- Embeddable maps
- Mapbox tilesets and map styles
- Probable Futures API
- Download and use the raw data
Embeddable maps
For journalists, authors, or anyone who would like to put a Probable Futures map on a website without touching any code, Probable Futures embeddable maps offer a simple solution. Simply go to the Probable Futures maps, click the download button on the right side, select one of the two embeddable maps options, and add the code to any website.
The embeddable map you download will reflect the location on the map you are viewing. Specifically, the zoom level and viewport area shown when you click the download button will be reflected in the embeddable map. The two embeddable map options include a standard map that shows only one warming scenario and a comparison map which includes an interactive slider.
This is a standard embeddable map:
This map shows the number of days above 32°C (90°F) that can be expected around the world in a 1.5°C warming scenario. Try clicking on the map to inspect the data and zoom in or pan around to see different parts of the world.
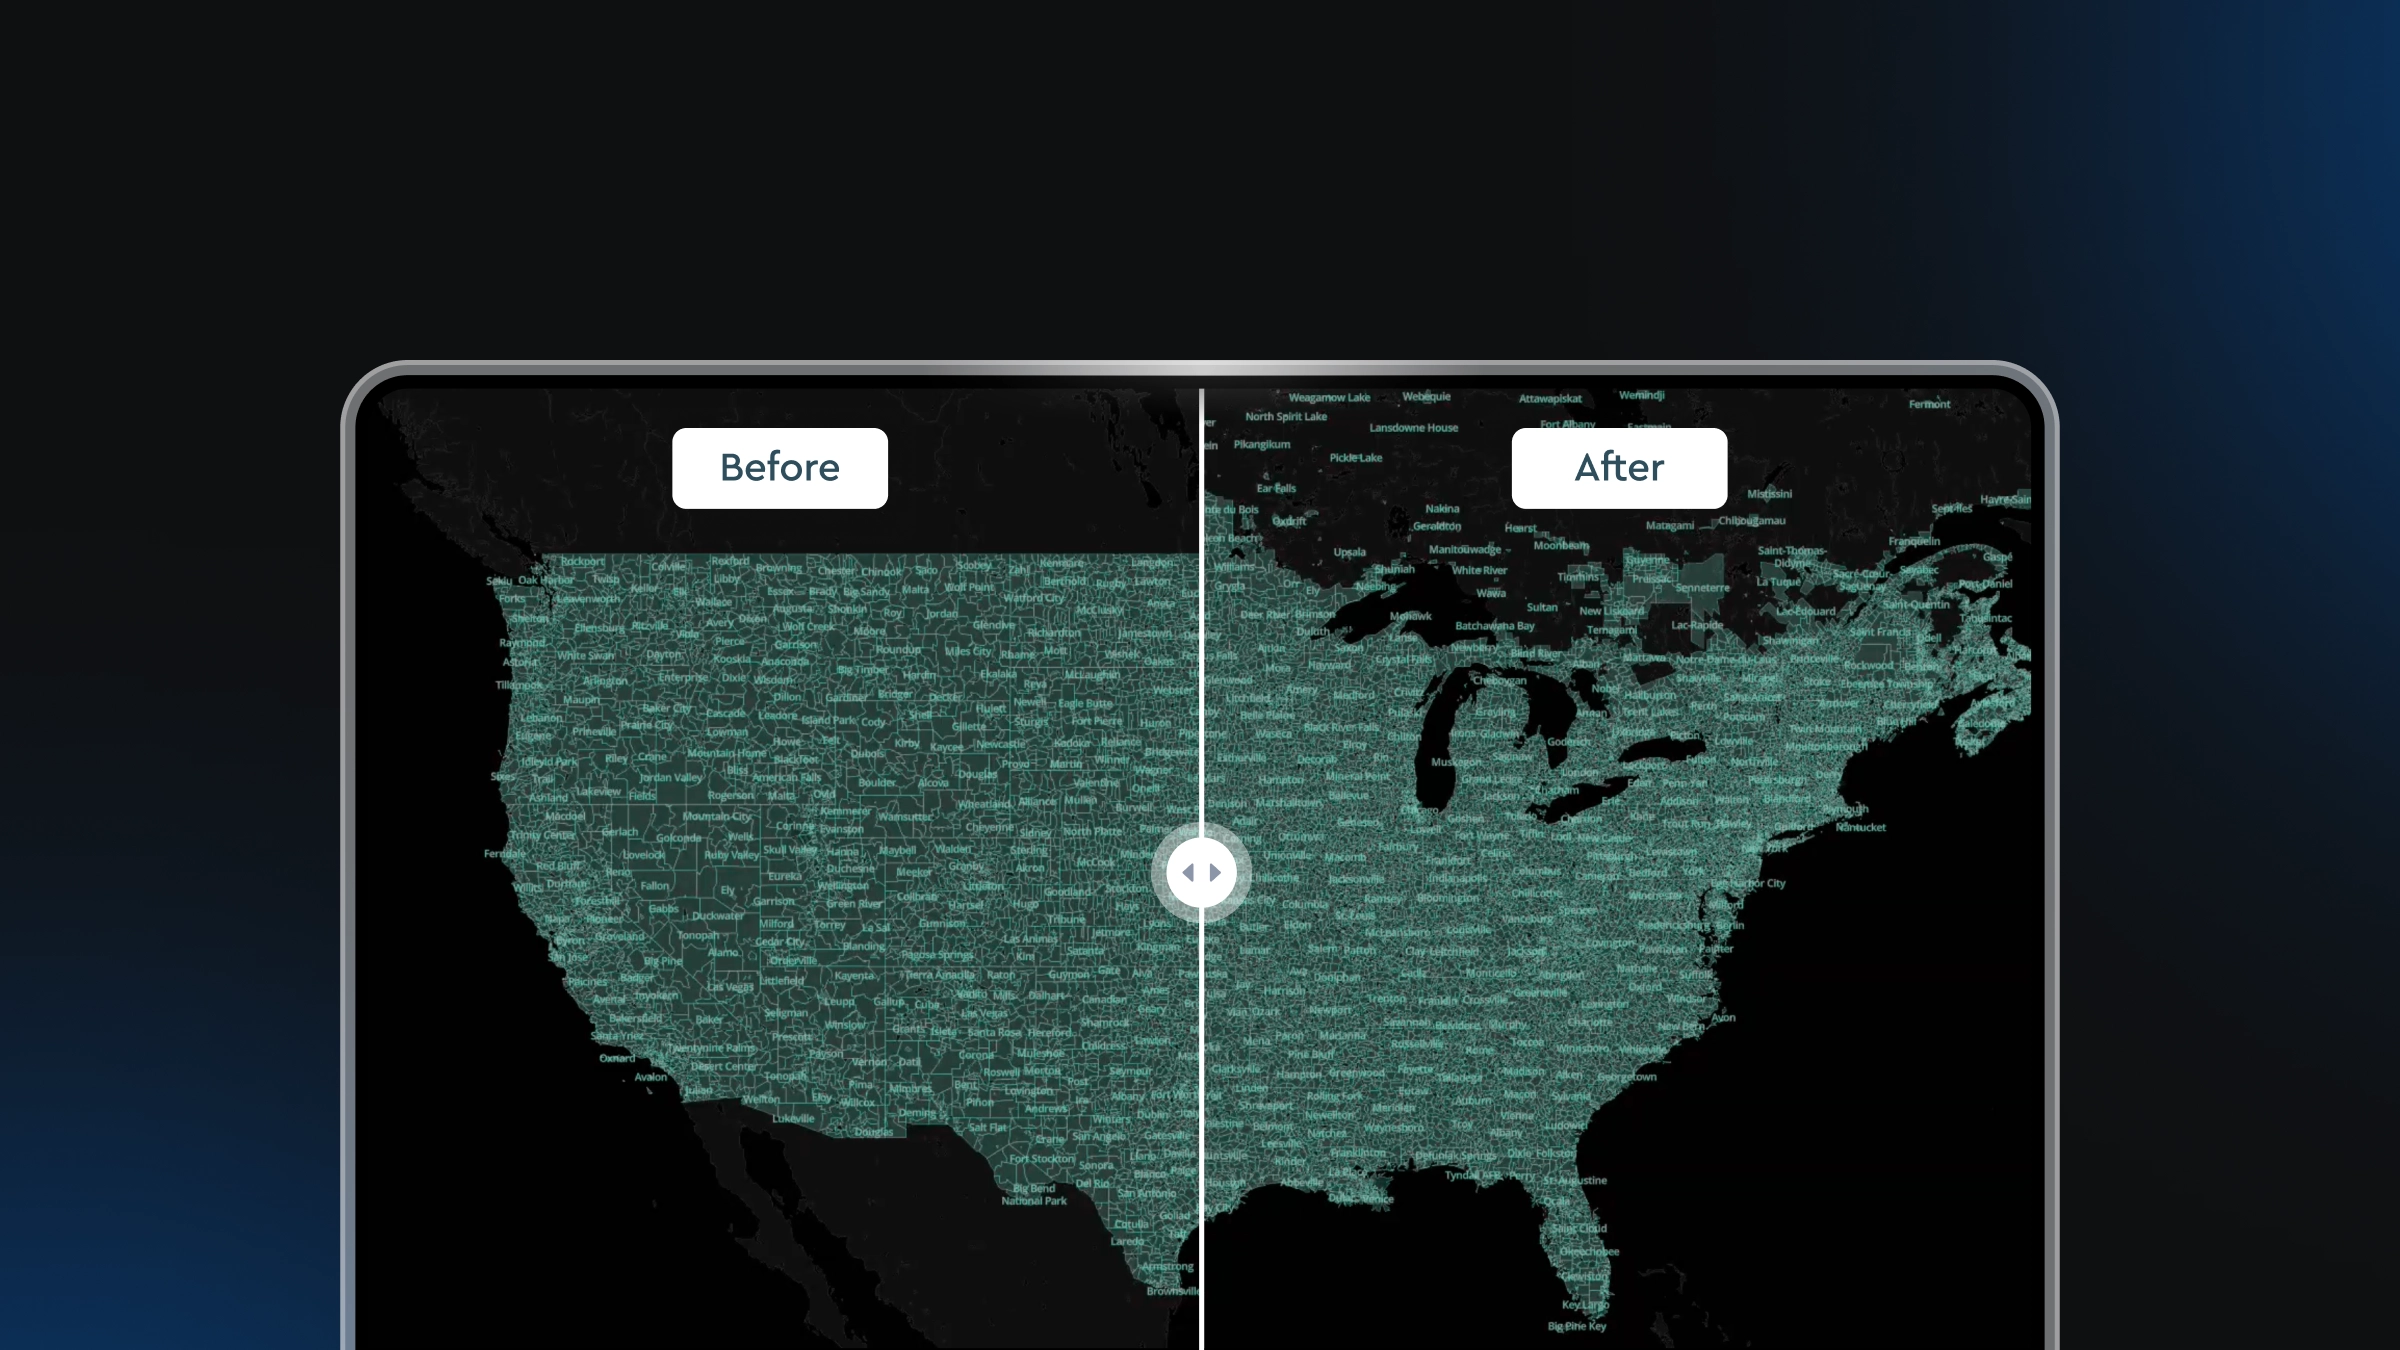
This is an embeddable comparison map:
This is an embeddable comparison map. Click and drag the line in the middle to compare the climate conditions between the two warming scenarios. This map shows the likelihood of more than a year of drought in the warming scenario experienced circa 2017 (1°C scenario, left side) compared to a 3°C warming scenario (right side).
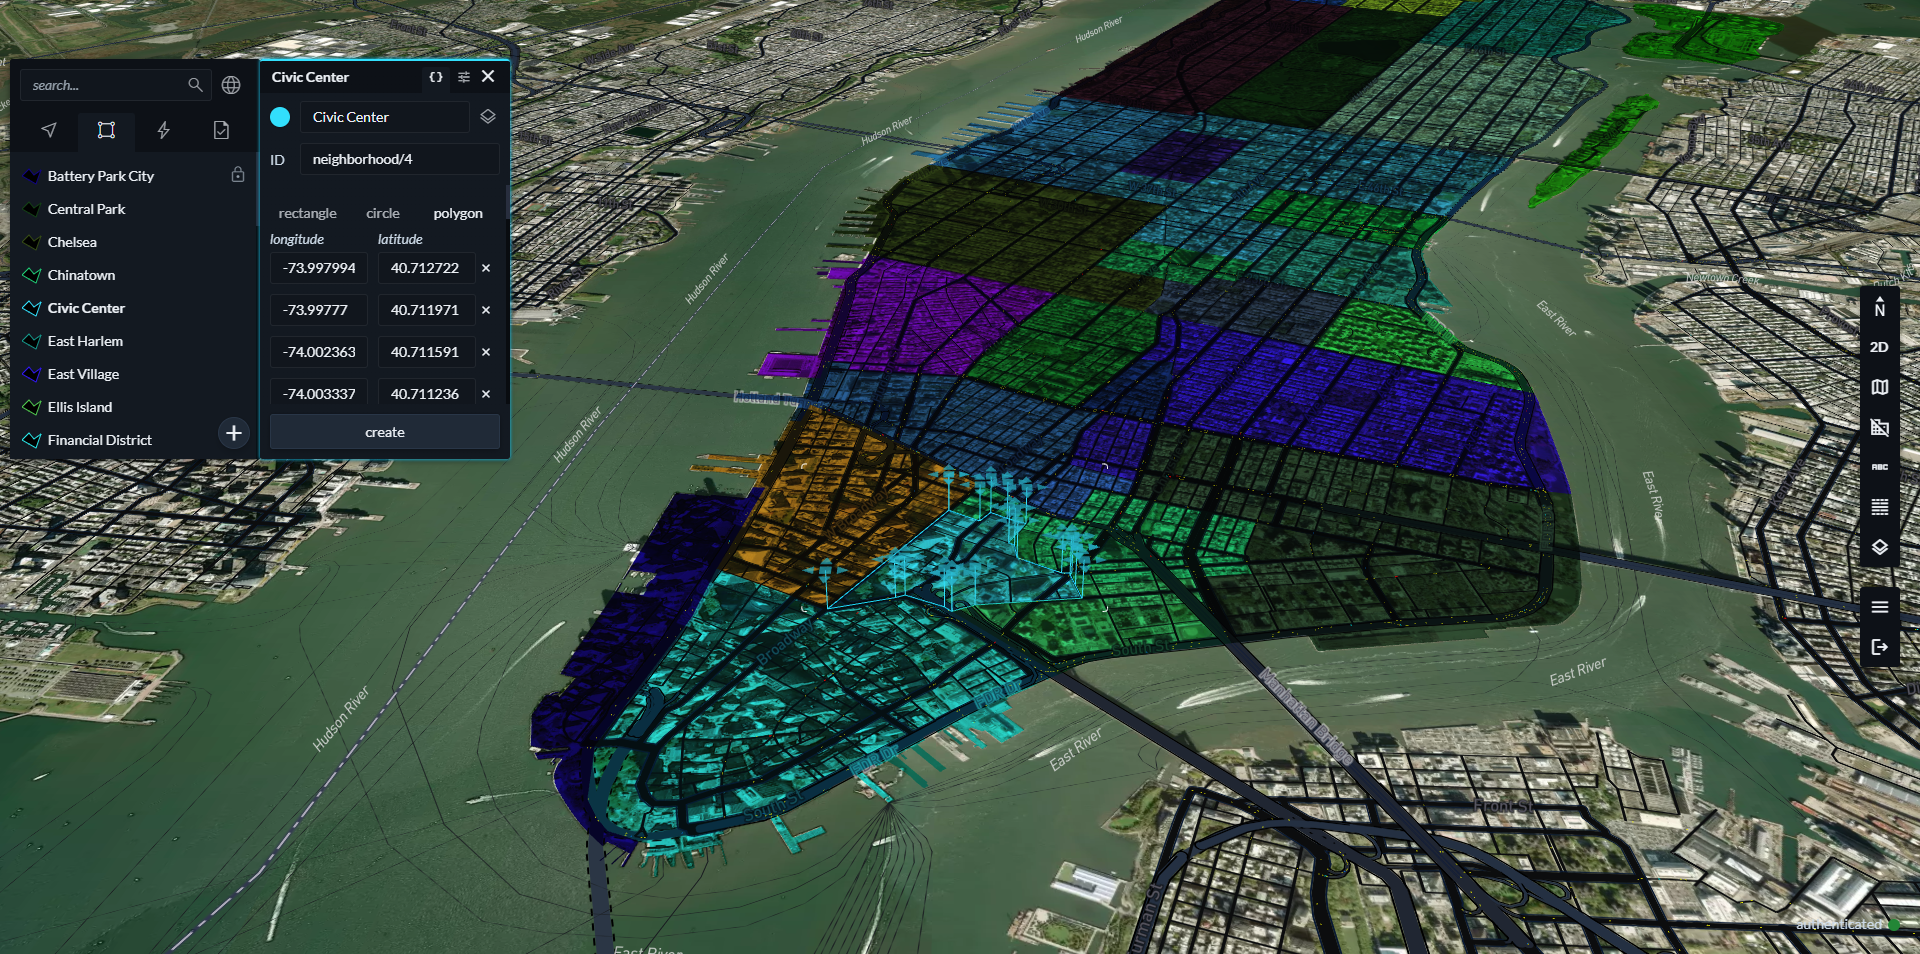
Mapbox tilesets and map styles
All Probable Futures tilesets and map styles are available publicly. This means anyone who is comfortable working with code or Mapbox Studio can benefit from the many thousands of hours of development that have gone into creating the tilesets and styles by adopting all or part of them in any Mapbox mapping application. This option enables full customization: change colors, add layers, and much more. While the full styles are available for ease of use, integrating the tilesets can be done without using the whole style or all layers.
To quickly and easily get started with the tilesets and map styles, follow the Probable Futures Mapbox quick-start guide. If you would like to create more customized maps using Probable Futures tilesets, see the tilesets page of the Probable Futures developer documentation.
Probable Futures API
With the Probable Futures API, anyone can request climate data for any place in the world by providing a location. API responses can be customized to request only the specific information that is needed: specific map(s), multiple percentiles, and any warming scenario. Requests can be an address, place, city and country, or latitude and longitude coordinate. To get started, request an API key or learn more about how to use the API in the API section of our documentation.
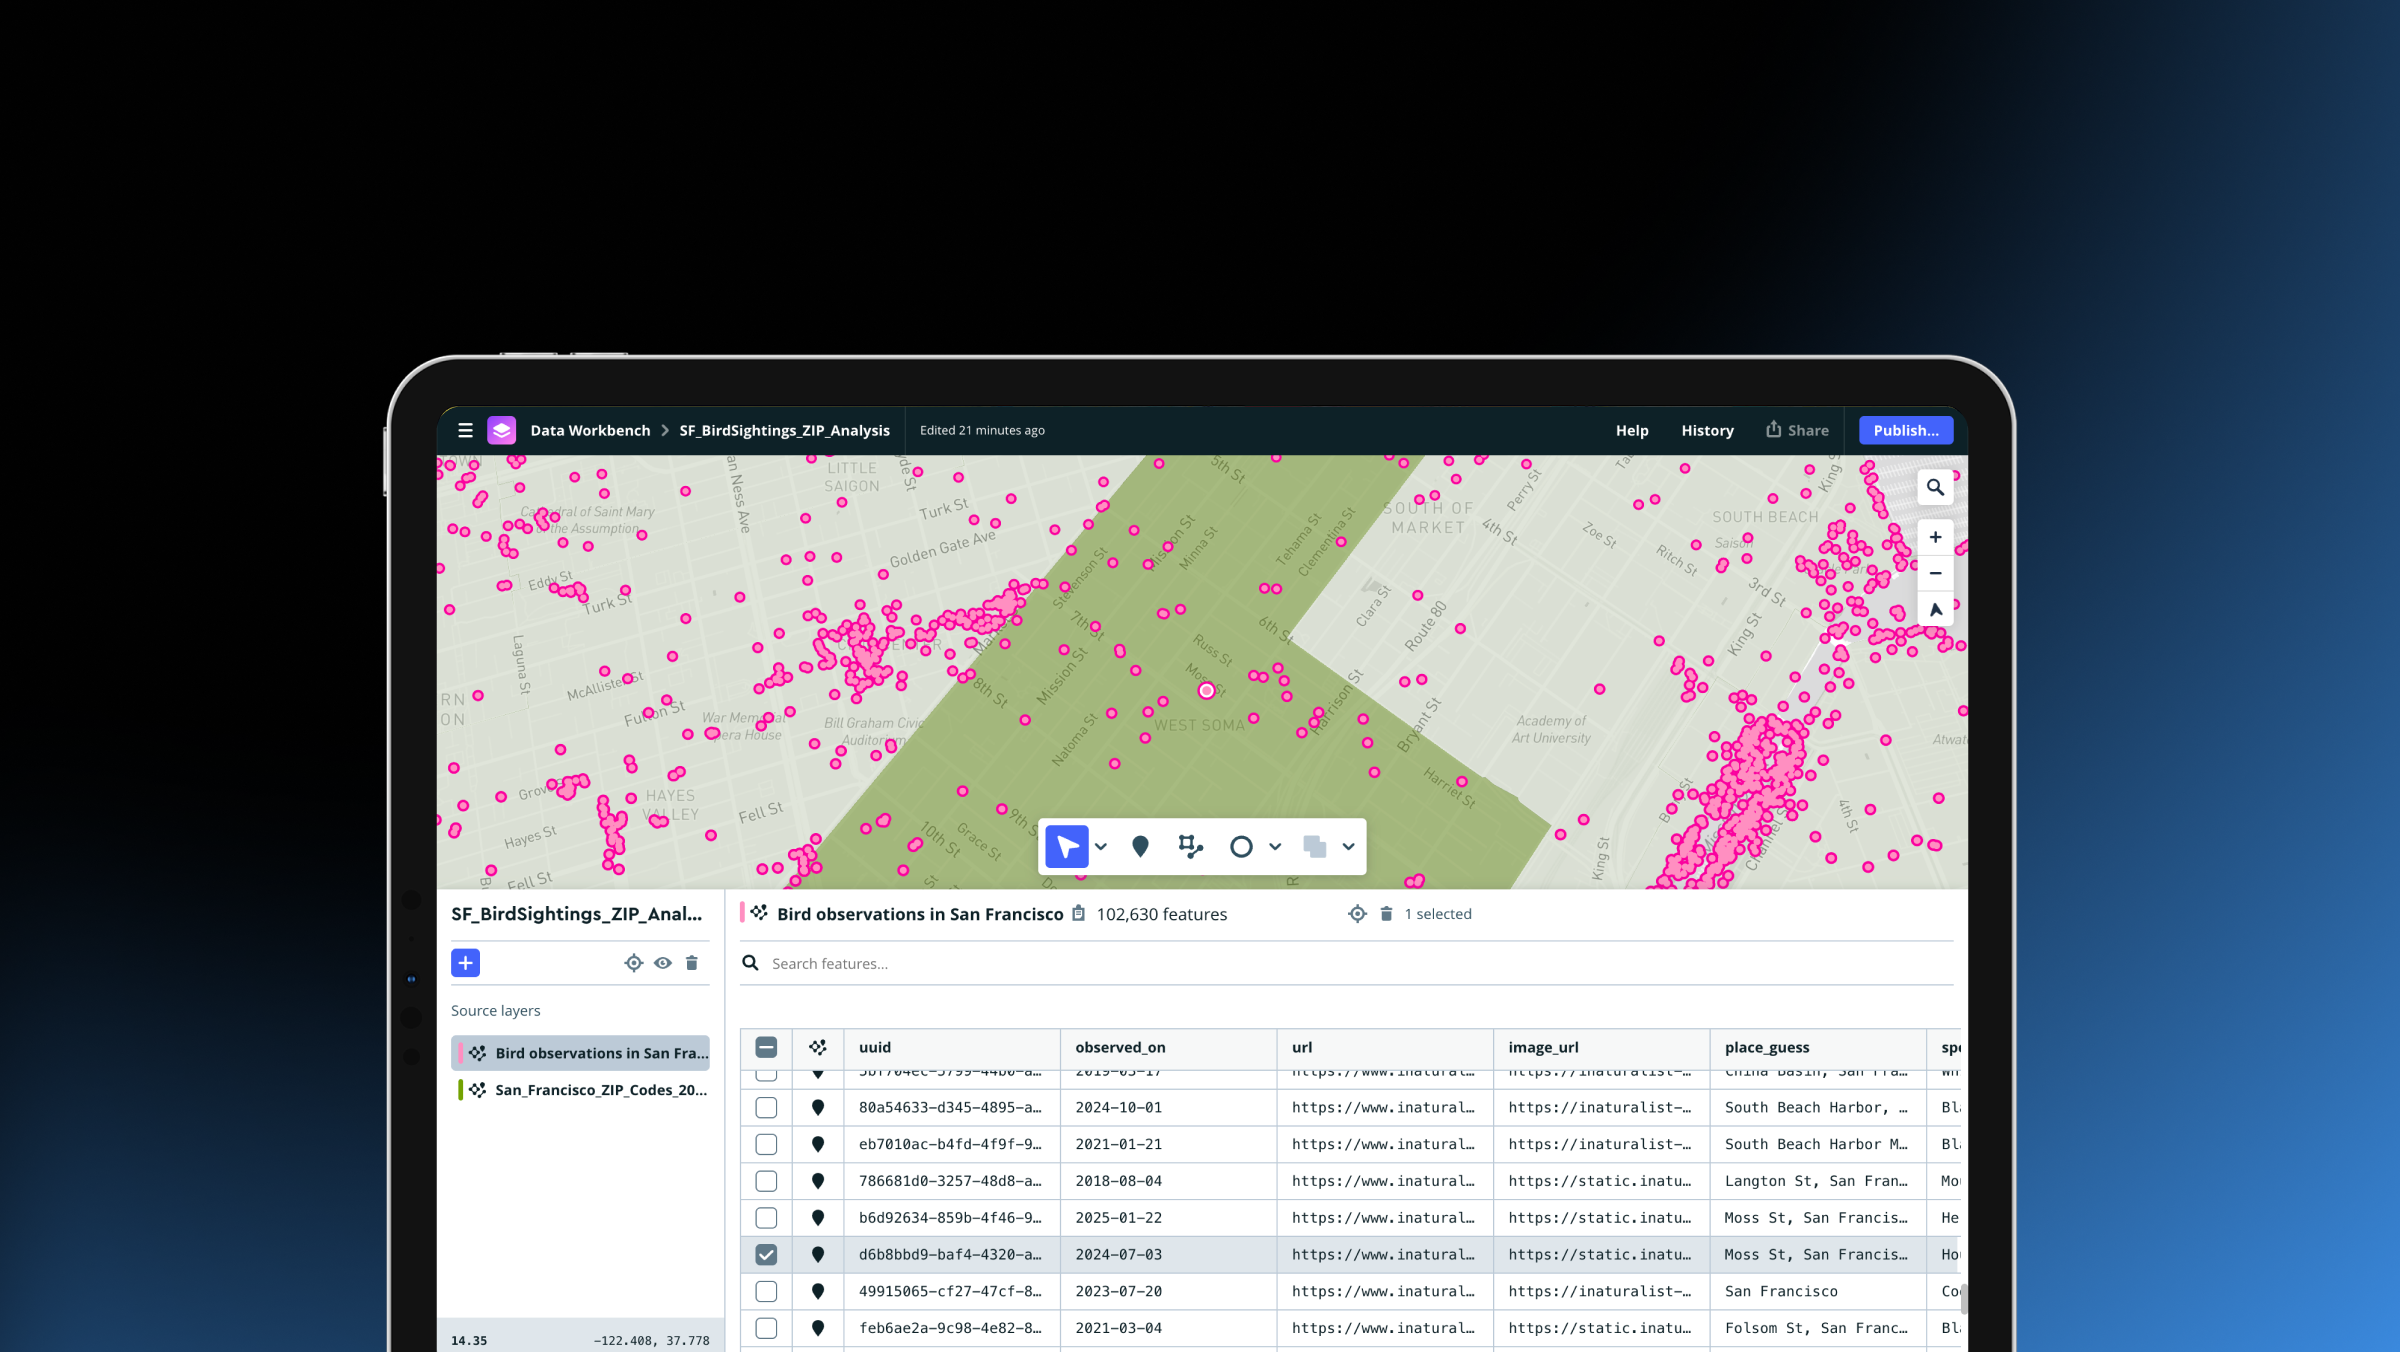
Download and use the raw data
For analysts and anyone who wants to directly work with the data, there is an option to download all of the Probable Futures data. To get started, request access to Probable Futures Pro, a completely free tool for interacting with Probable Futures data in more advanced ways.
After logging in to Probable Futures Pro, visit the Datasets tab to download data in a variety of ways, such as:
- Data for a specific country. For example, one could download data only for Portugal.
- Data for certain outcome percentiles. For example, one could download only the 95th percentile data which can be expected in more extreme years in a given warming scenario.
- Full datasets for each Probable Futures map. For example, one could download all the data for all maps across the world.
Getting started with the maps and data
As you get started using our maps and data, here are some resources to help you along the way:
- The Probable Futures platform includes essential context for living in a changing world, with audio or written learning options.
- There is a small community of people who are interested in building with Probable Futures maps and data or using Probable Futures maps and data in their work. Learn more or join the community.
- To learn more about the integration options available, please visit the Probable Futures integrations page.
To learn more about harnessing the power of climate data, check out this webinar:
The team at Probable Futures would love to hear from you. Whether you have questions about how to get started, or you already created something and are willing to share what you made, please reach out to me.


Related articles
Drag, drop, edit, publish: A simplified workflow for custom data
Mission-ready mapping: Securely bring together maps, AI, and response