Topology: A Big Word With Big Implications For Your Data
How topological maps can vastly improve the quality of GIS data

When creating high-quality maps that provide users with beautiful visuals, seamless data, and easy utilization, one word comes to mind: Topology. Topological maps are vital for building geographic information systems (GIS) that combine spatial data with the tools to visualize, analyze, and manage that data.
From business intelligence analysis to customized territory planning to logistics management, customers utilize GIS data in countless business solutions. However, many open-source datasets haven’t gone through the extensive process of applying topological rules––leading to ugly maps, spatial inconsistencies, and inaccurate analysis results.
Mapbox Boundaries provides topologically correct data for mapping and analysis, allowing customers to quickly glean insights from thousands of data sets and billions of data points. Companies can then apply those insights to their business operations, obtaining improved results and out-pacing the competition.

What Is Topology?
Topology is a branch of mathematics that deals with the interconnectedness of vertices and edges, preserving properties of geometric objects and relationships in graph networks.
In mapping, the term topology is used to describe two separate—but related—processes. First, topology describes how geospatial vector features (e.g. points, lines, and polygons in two-dimensional space) are connected in a specific order to construct a specific shape. And second, topology describes the relationship between neighboring features and how they interact.
While these concepts may appear abstract at first, the application of topology is vastly important to data visualization and geospatial analysis.
Why Is Topology Important For GIS Data?
Topology is paramount for GIS data for two reasons: Consistency and precision.
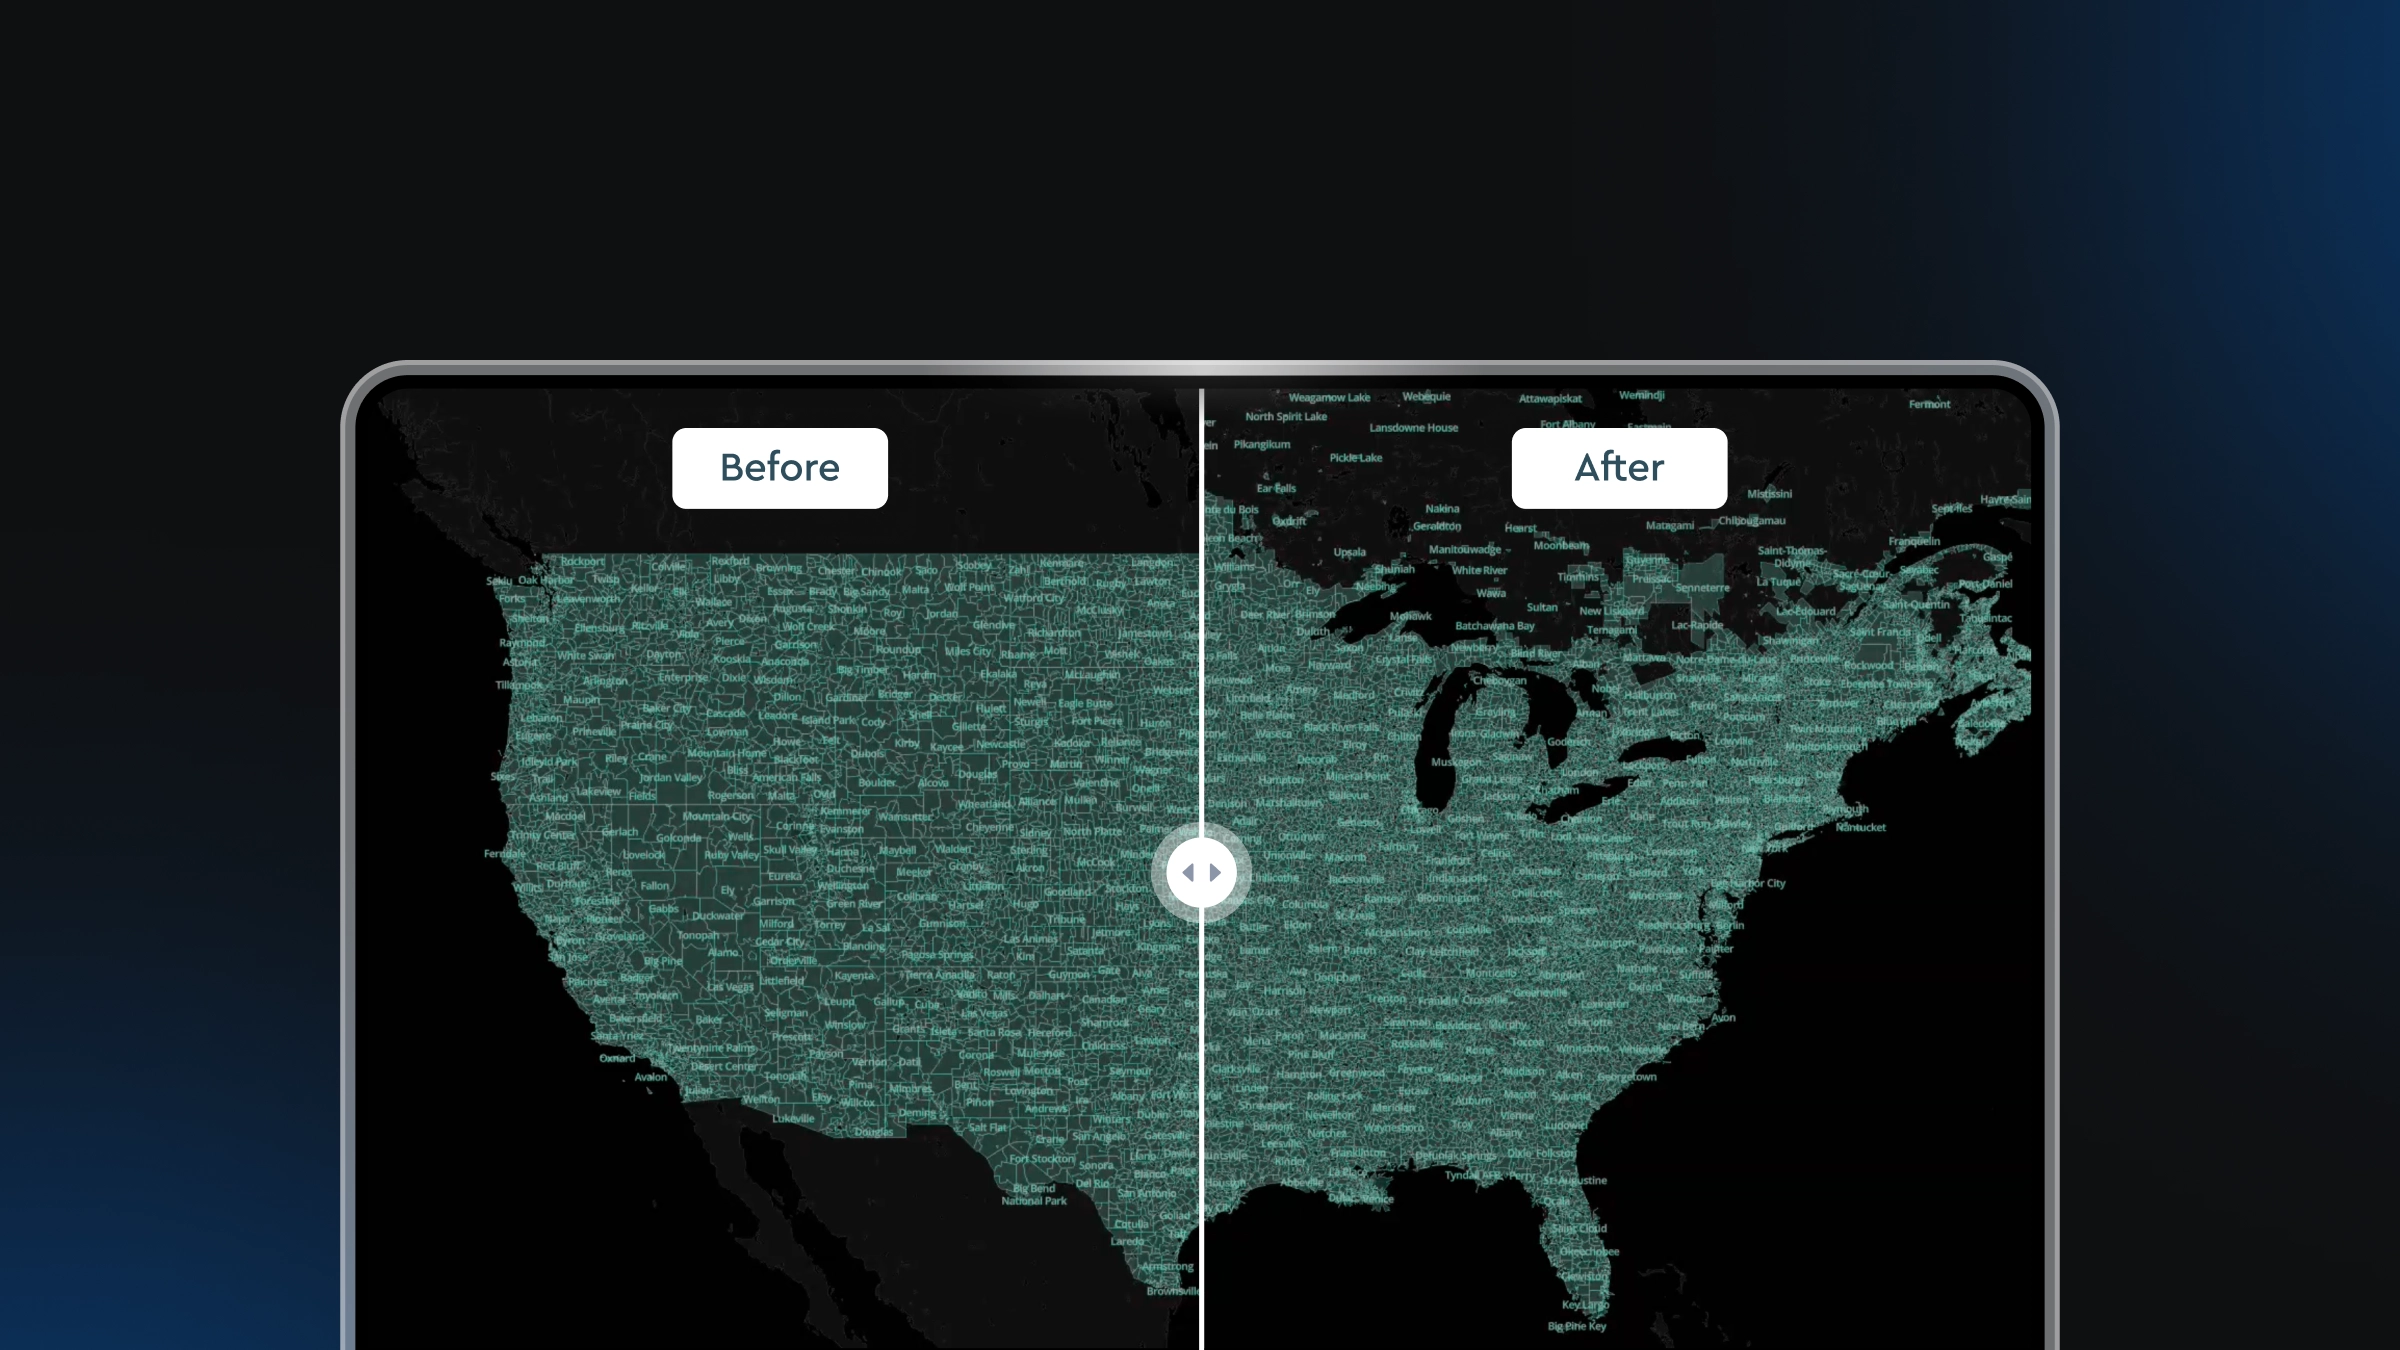
Consistency: Incorrectly constructed features lead to invalid geometry, most notably caused by self-intersections. Plus, things get trickier as maps get more complicated. When zooming in and out, unmatched boundary edges create a jarring visual experience on the map and can also lead to missing features when generating vector tiles at various zoom levels. Topological maps are consistent in the sense that no matter how the map is manipulated, the features remain valid and the boundaries remain seamless through hierarchical edge-matching.
Precision: Incorrectly noded neighboring features lead to slivers (gaps between shapes) and overlaps (shapes smushed together). These slivers and overlaps in turn lead to inaccurate, unreliable, or non-deterministic spatial analysis results. To achieve deterministic results that businesses can rely on, their GIS data must be precise. While other datasets may over-simplify boundaries, Mapbox polygons are always perfectly matched to adjacent boundaries.

Mapbox Boundaries Approach To Topology
Mabox Boundaries is a collection of global boundary polygons, expertly curated across every country, that supports data visualization and geospatial analysis needs. Customers can apply Boundaries data to support multiple use cases, such as:
- Visualizing county-level data like unemployment in the United States
- Creating interactive maps that showcase data like top streaming songs per country
- Allowing users to search for business locations by state or zip code
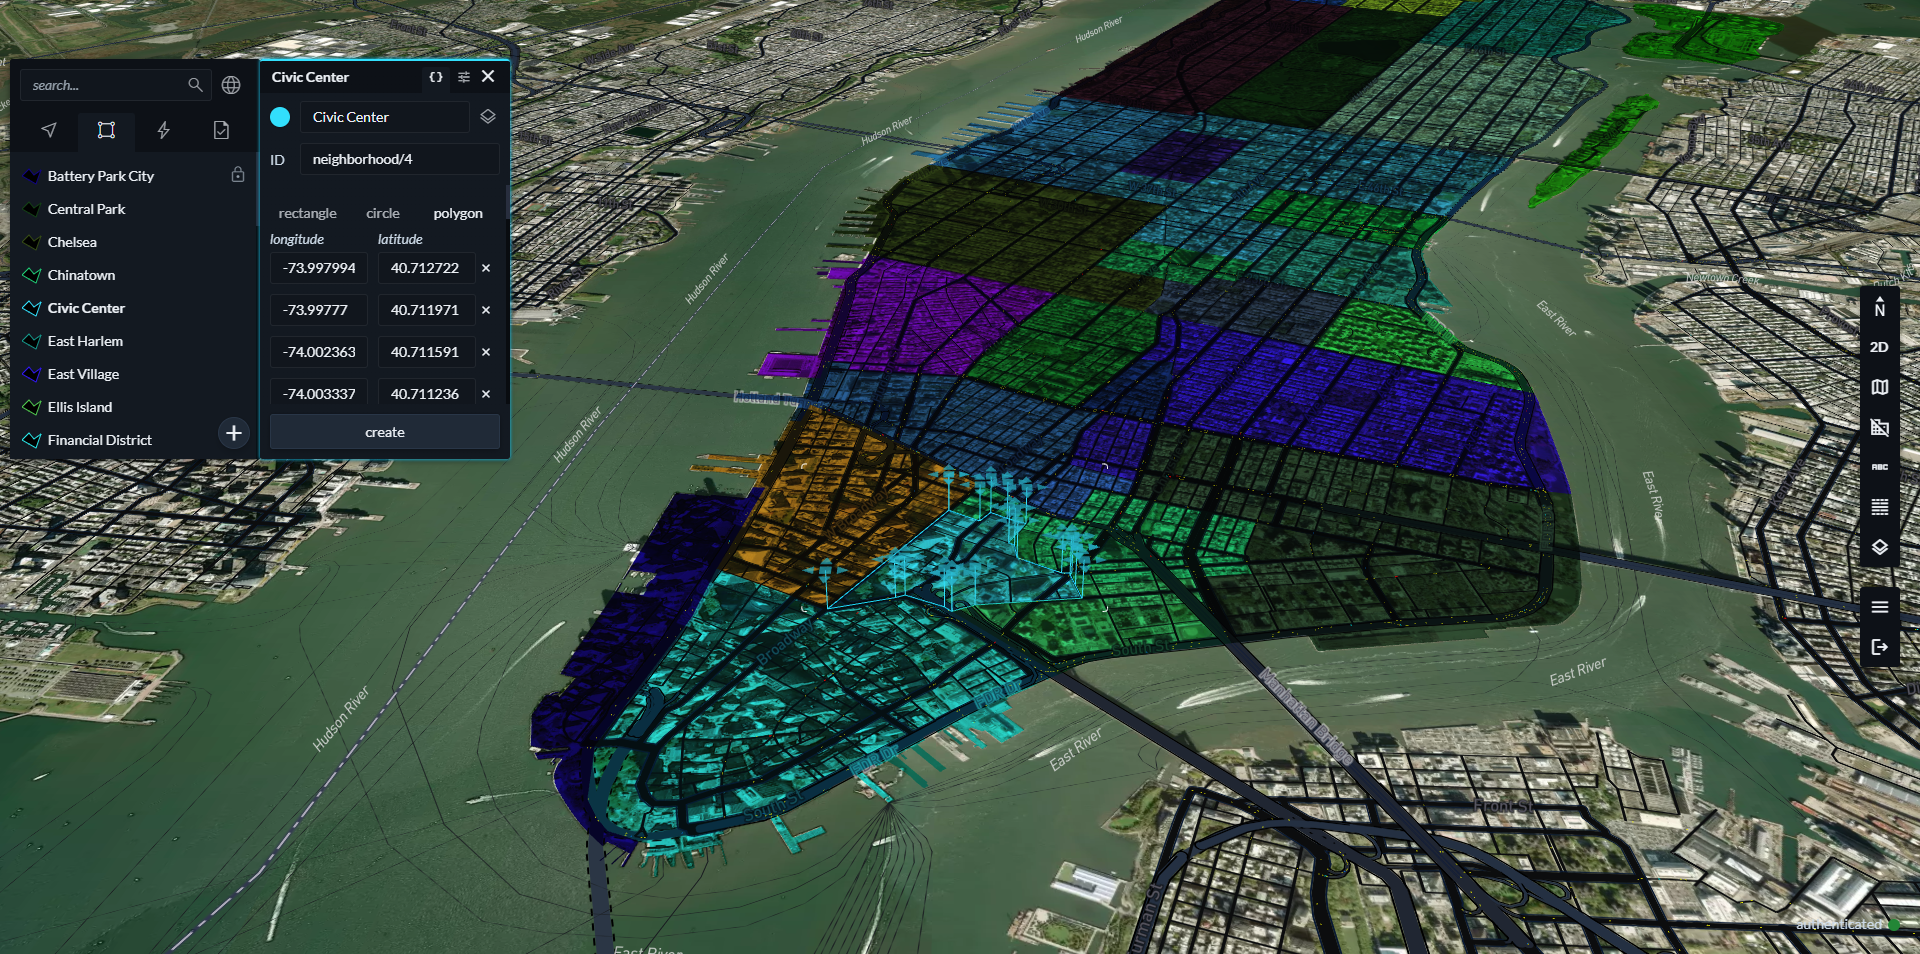
- Merging multiple polygons to form custom areas likes sales territories
- Mapping highly-accurate, complex geography like the coastline of Canada
Boundaries uses topology to precisely edge-match polygons, and our developers have been able to scale data alignment globally in five steps.
Step 1
Define world country boundaries based on various canonical data sources, with alternates based on worldviews and disputed borders.
Step 2
Identify the lowest nested data level for each data type in each country.
Data levels are data sets organized into a hierarchy. For example in the United States, counties (admin level 2) are subdivisions of states (admin level 1), which are subdivisions of country (admin level 0). The number of levels available will differ by country and data type.
Data types are boundary data sets classified into five different categories: admin, legislative, locality, postal, and stats.
Step 3
Align the lowest nested data level to its country boundary (fill in gaps and remove boundary overlaps).
Step 4
Perform topological validation and maintenance on the aligned data from step three. This ensures boundaries are accurate, consistent, and precise.
Step 5
Build upper data levels using the combined nested features that are within it (from step four).
Using the United States data levels as an example: the Mapbox developer can rebuild a U.S. state polygon by identifying all the counties that are within that state using point-in-polygon intersection. Then, they construct an exterior ring from those counties to build a simple polygon state feature.
Benefits of Mapbox Boundaries Approach To Topology
Mapbox’s approach to topology enhances both operational performance and product quality, both of which lead to customer satisfaction.
Aligning data sub-levels to country boundaries can take a long time based on the size and complexity of a border. Operational performance is therefore enhanced because developers only have to perform topological alignment on one nested data level.
This also enhances product quality for an obvious reason: All nested-levels of data are perfectly edge-matched with no gaps or overlaps between polygons, which represents a seamless fabric.
With Mapbox Boundaries, customers can cleanly visualize the entire world with high-speed rendering, precise data sets, and beautiful maps.
Business’s Top(ological) Priority
By using topology to achieve unmatched geocontext precision and countless data aggregation possibilities, Mapbox Boundaries is the premier solution for enhancing business intelligence and data visualization. It can be integrated with Mapbox developer tools to create custom data sources on websites, apps, or dashboards. Perfect topology means a perfect fit.
*The Mapbox Boundaries product consists of over 1000 datasets made up of roughly 5 million boundary features worldwide, resulting in trillions of individual vertices


Related articles
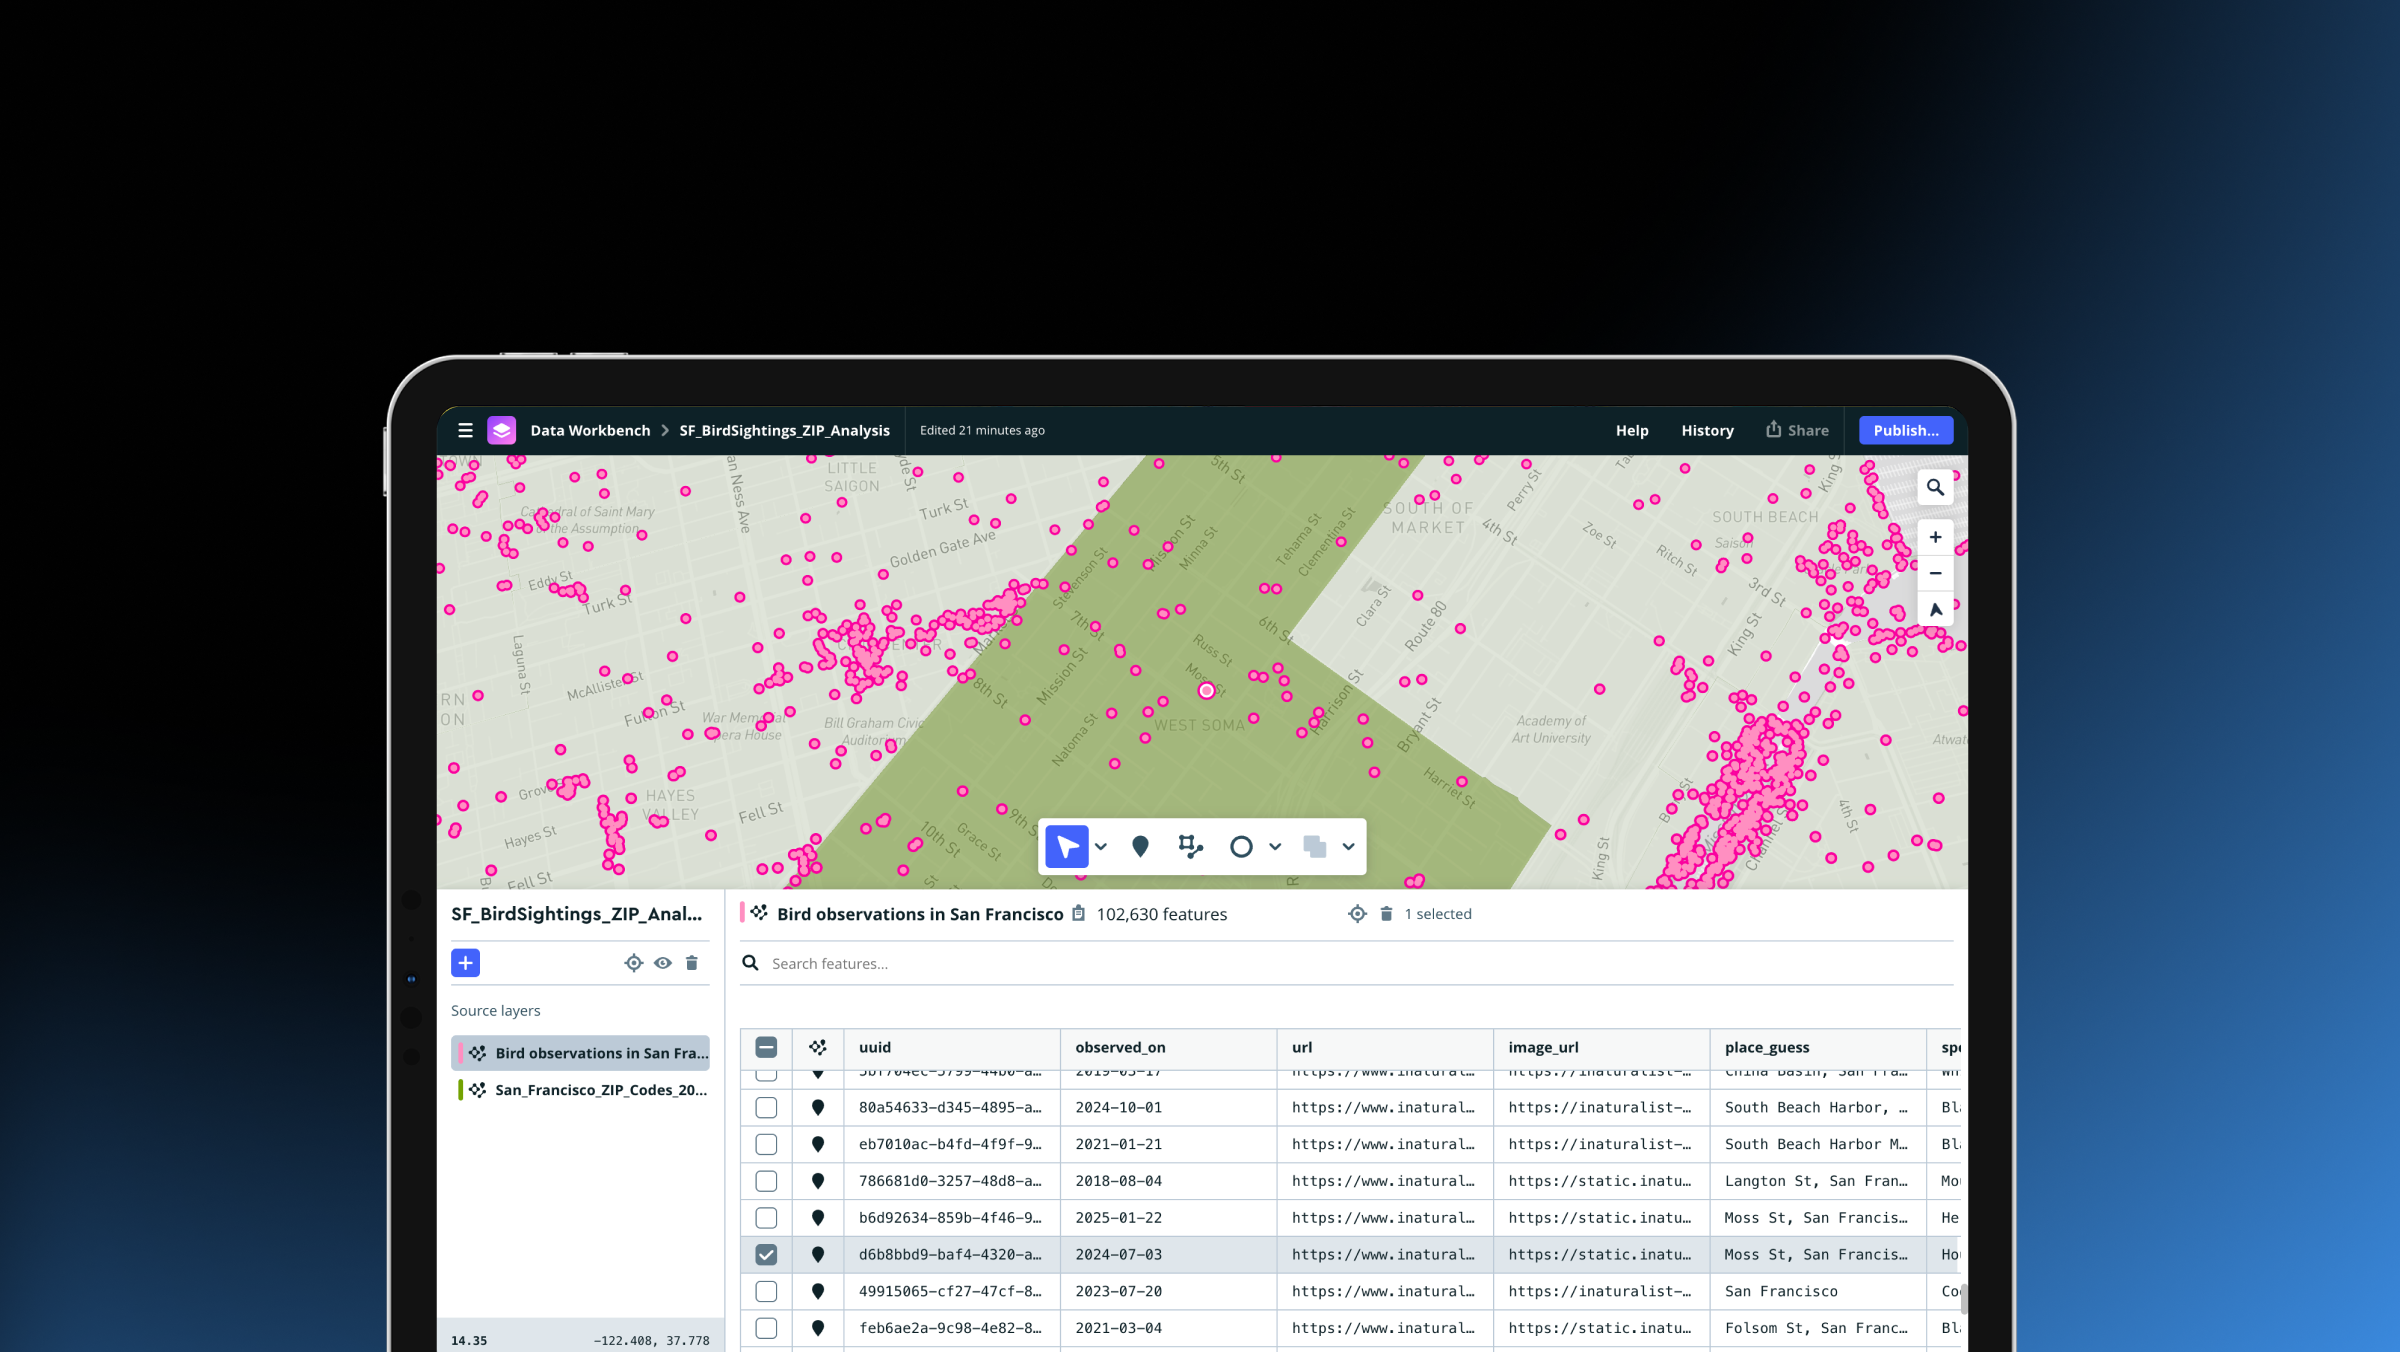
Drag, drop, edit, publish: A simplified workflow for custom data
Mission-ready mapping: Securely bring together maps, AI, and response