Expanding the boundaries of visualization
Mapbox Boundaries rolls out over 200,000 new or updated geographic boundaries across the Americas and Asia

Borderlines on the map represent how countries are administered, how mail is delivered, how population census is determined, and how geographical locations are understood around the world. These borderlines are in constant flux – changing, shifting, or disappearing entirely. For example, in the last year alone, the Indonesian government created three new districts in Papua, the Borneo state of Sarawak added five new districts, and the United States Postal Service changed or added zip codes in Arizona, Maryland, and New Jersey, among other places. When these borderlines change, the maps we use to understand the people, places, and things within them don’t magically update; it takes a significant amount of work to make sure that maps reflect the most up-to-date information.

Mapbox Boundaries recently released an update that includes over 200,000 new or updated boundaries across 59 countries, so you and your maps can stay in step with changes around the world.
Asia and the Americas - Just got an update

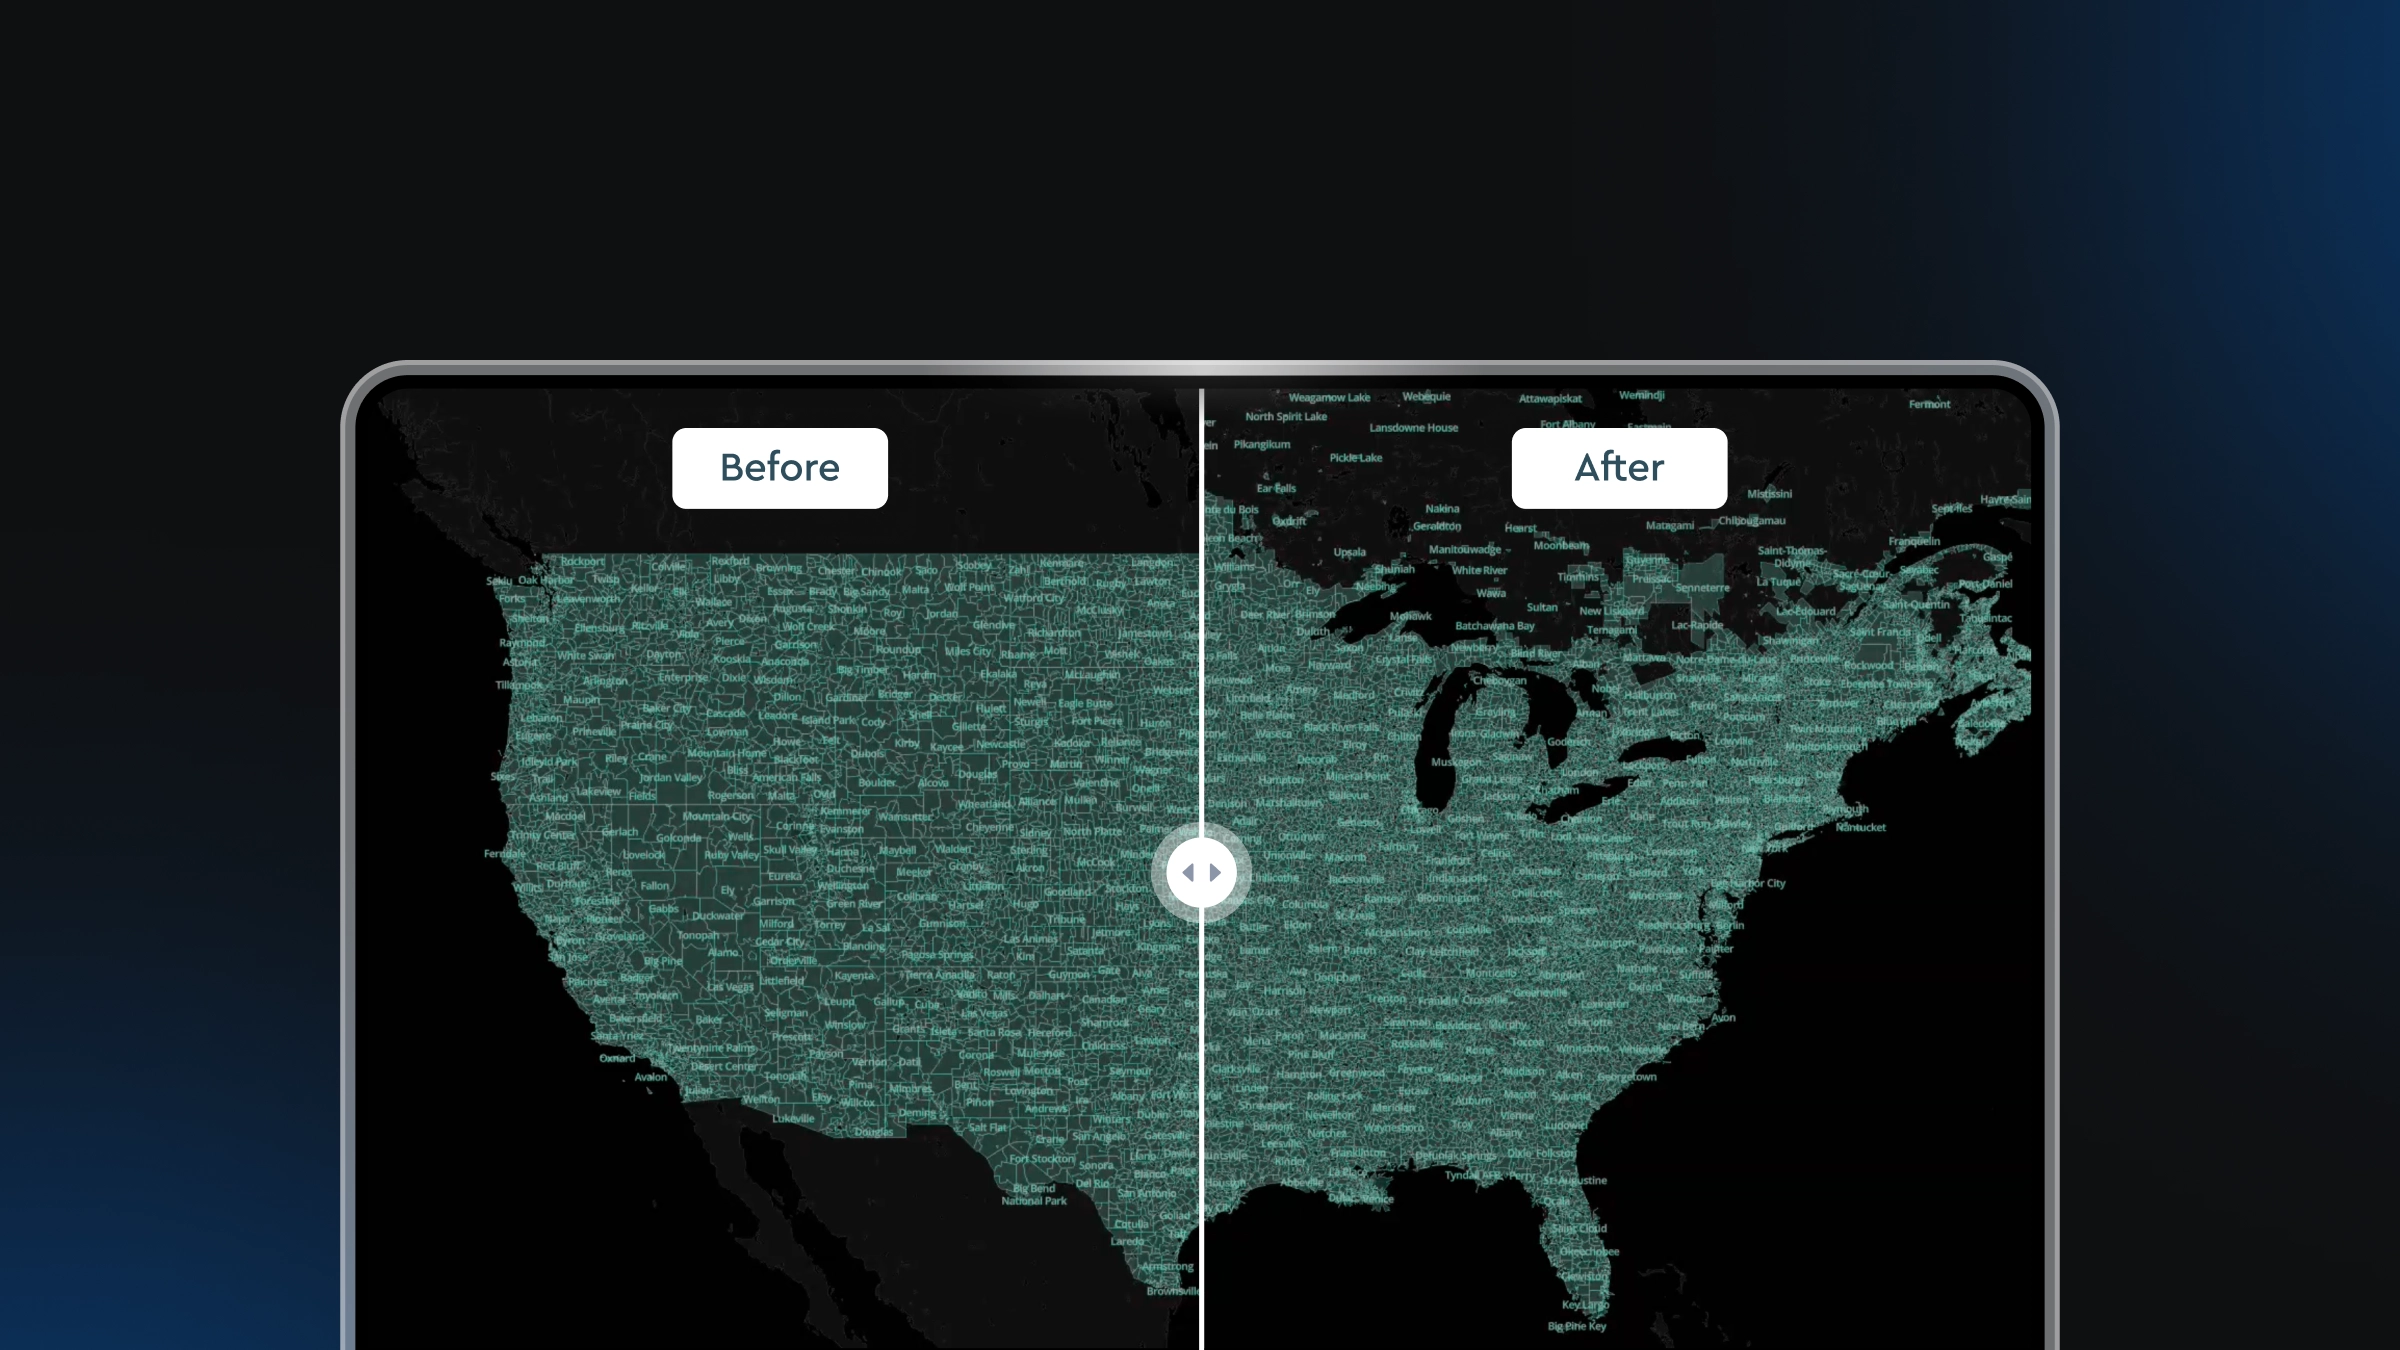
We have added nearly 80,000 new areas across our administrative/government, postal, and statistical boundaries in Asia and the Americas. Additionally, we’ve updated international borders to match the Large Scale International Boundaries (LSIB) dataset published by the US State Department in order to provide a common standard.
If you’re creating visualizations tracking changes across Indian mandals and tehsils or planning sales areas by the 5-digit Mexican postcodes, this update will enrich your maps and applications with more comprehensive and accurate boundaries than ever before.

Expanding locality
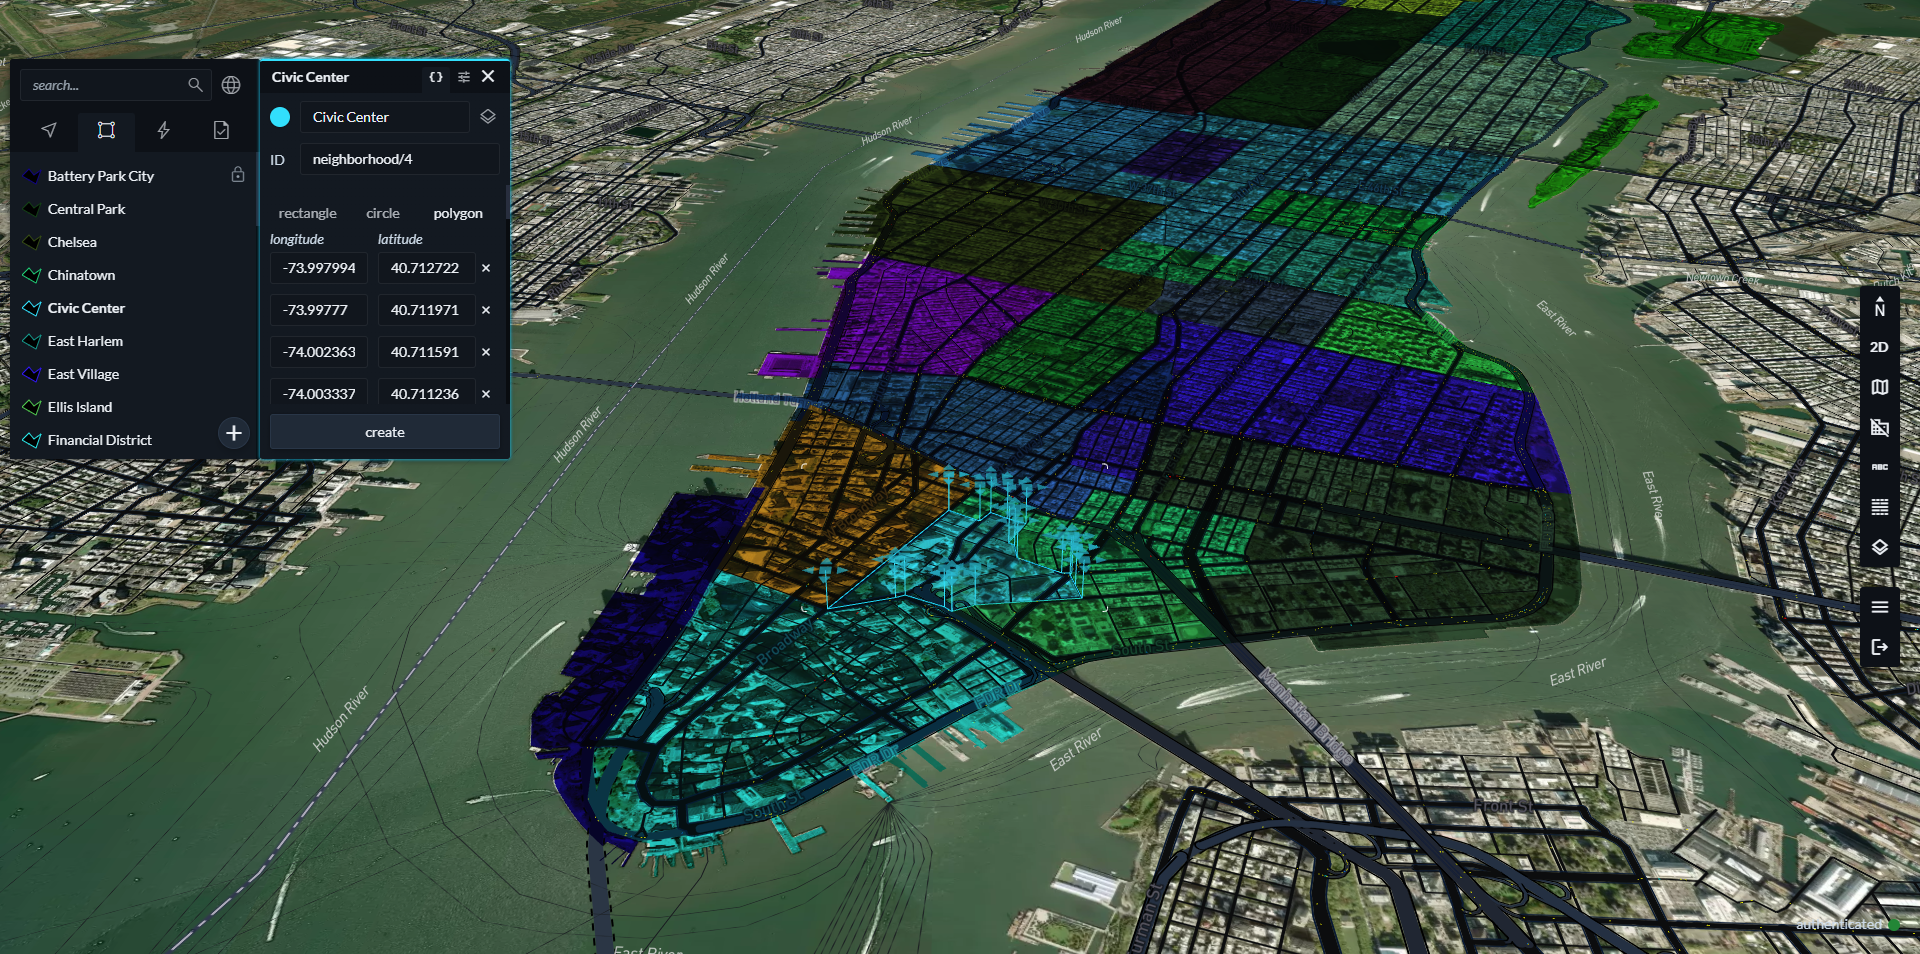
In 2019, Mapbox Boundaries released locality layers, providing neighborhood areas, Census Designated Places (CDPs), and metropolitan areas. These areas provided our users with a more granular picture, visualizing places in ways more aligned with the way people think of them than the way they are legally defined. With our new release, we’ve expanded this picture in the US by over 122,000 new places, localities, and neighborhoods. These updates have aligned Boundaries data with the data from other Mapbox Search products, making it easier than ever to create accurate and beautiful visualizations that can unlock the insights hidden in your geospatial data.

Building with Boundaries
The quality of every boundary hasused in analyses and tools across industries and the mapping community since its release.
Examples of access include:
- Advanced business intelligence solutions within platforms such as Tableau and MicroStrategy
- Logistics tracking with geofencing for smart notifications
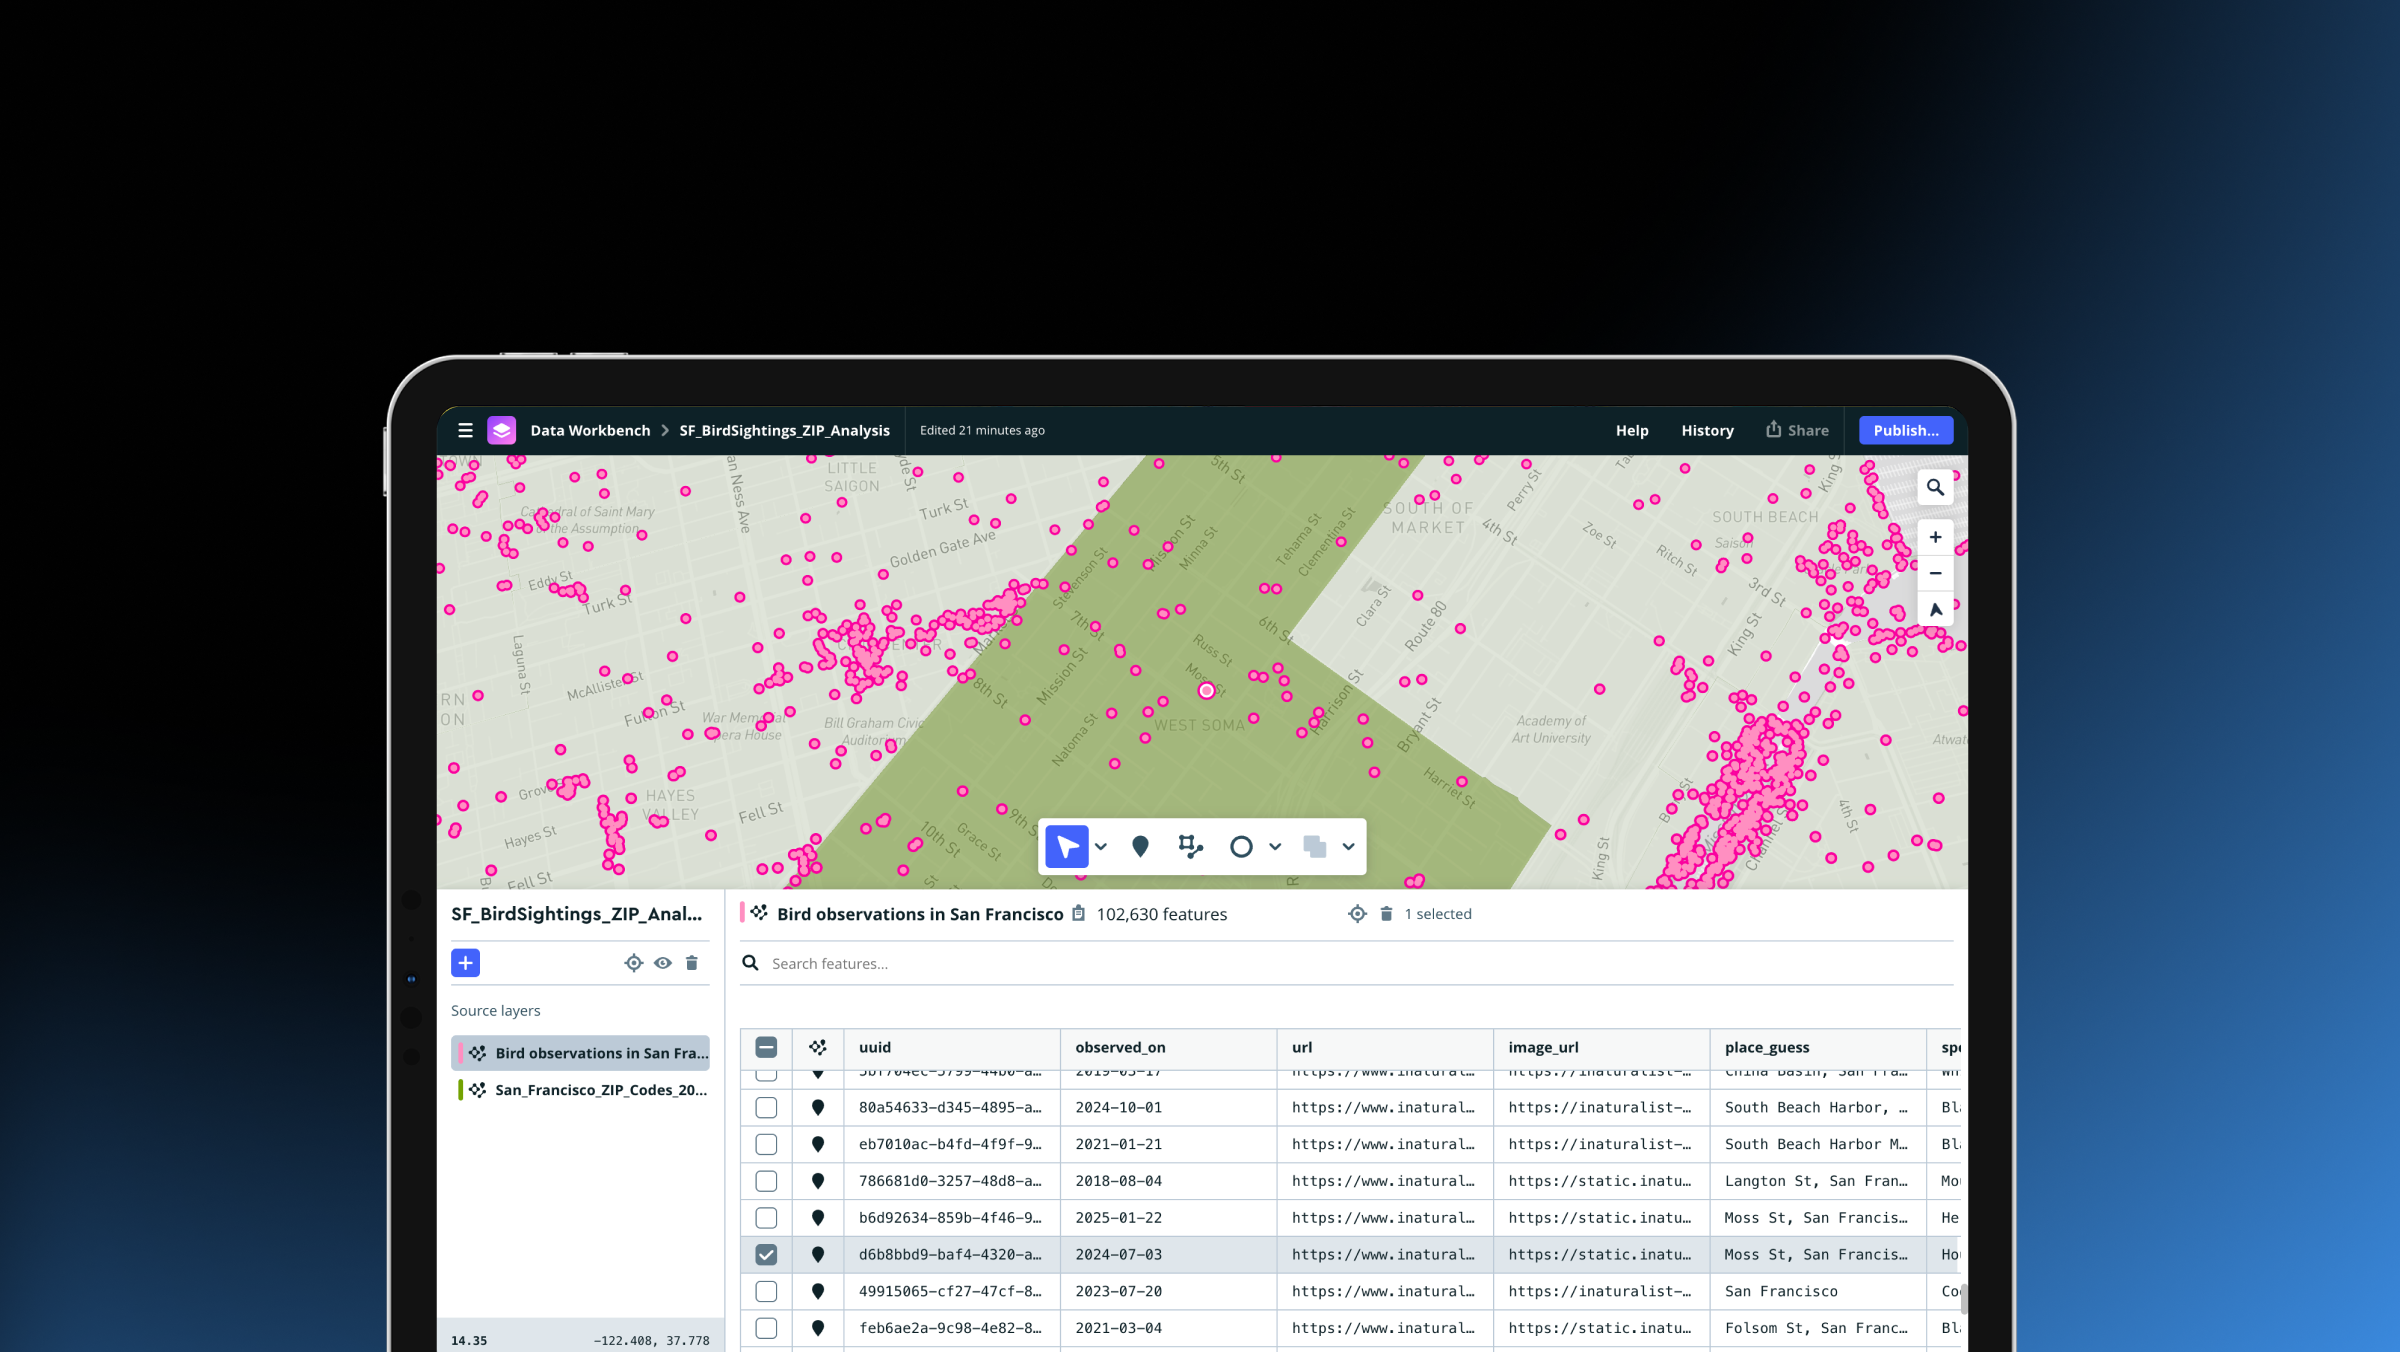
- Data visualizations depicting everything from refugee migration patterns to trends in entertainment and sporting events.
See how Mapbox Boundaries can help with your use case. If you’re ready to get started with Boundaries, reach out to our team.


Related articles
Drag, drop, edit, publish: A simplified workflow for custom data
Mission-ready mapping: Securely bring together maps, AI, and response