Inspiring map projects from BUILD with Mapbox 2025
Real stories from teams who use Mapbox to create thoughtful, practical, and people-focused experiences across aviation, real estate, conservation, and city planning.

Digital maps have quietly become one of the most relatable tools in daily lives. People use them to pick a new home, plan a trip, or check how long it takes to reach the airport. But behind every smooth interaction is a long chain of design choices, data decisions, and creative thinking.
At BUILD with Mapbox 2025, teams across industries (real estate, aviation, government planning, conservation, and more) shared how they build thoughtful, human-centered products using Mapbox. Their stories illustrate how maps can help everyone understand the world in a clearer, more meaningful way.
Cecilian Partners: Designing maps that feel human
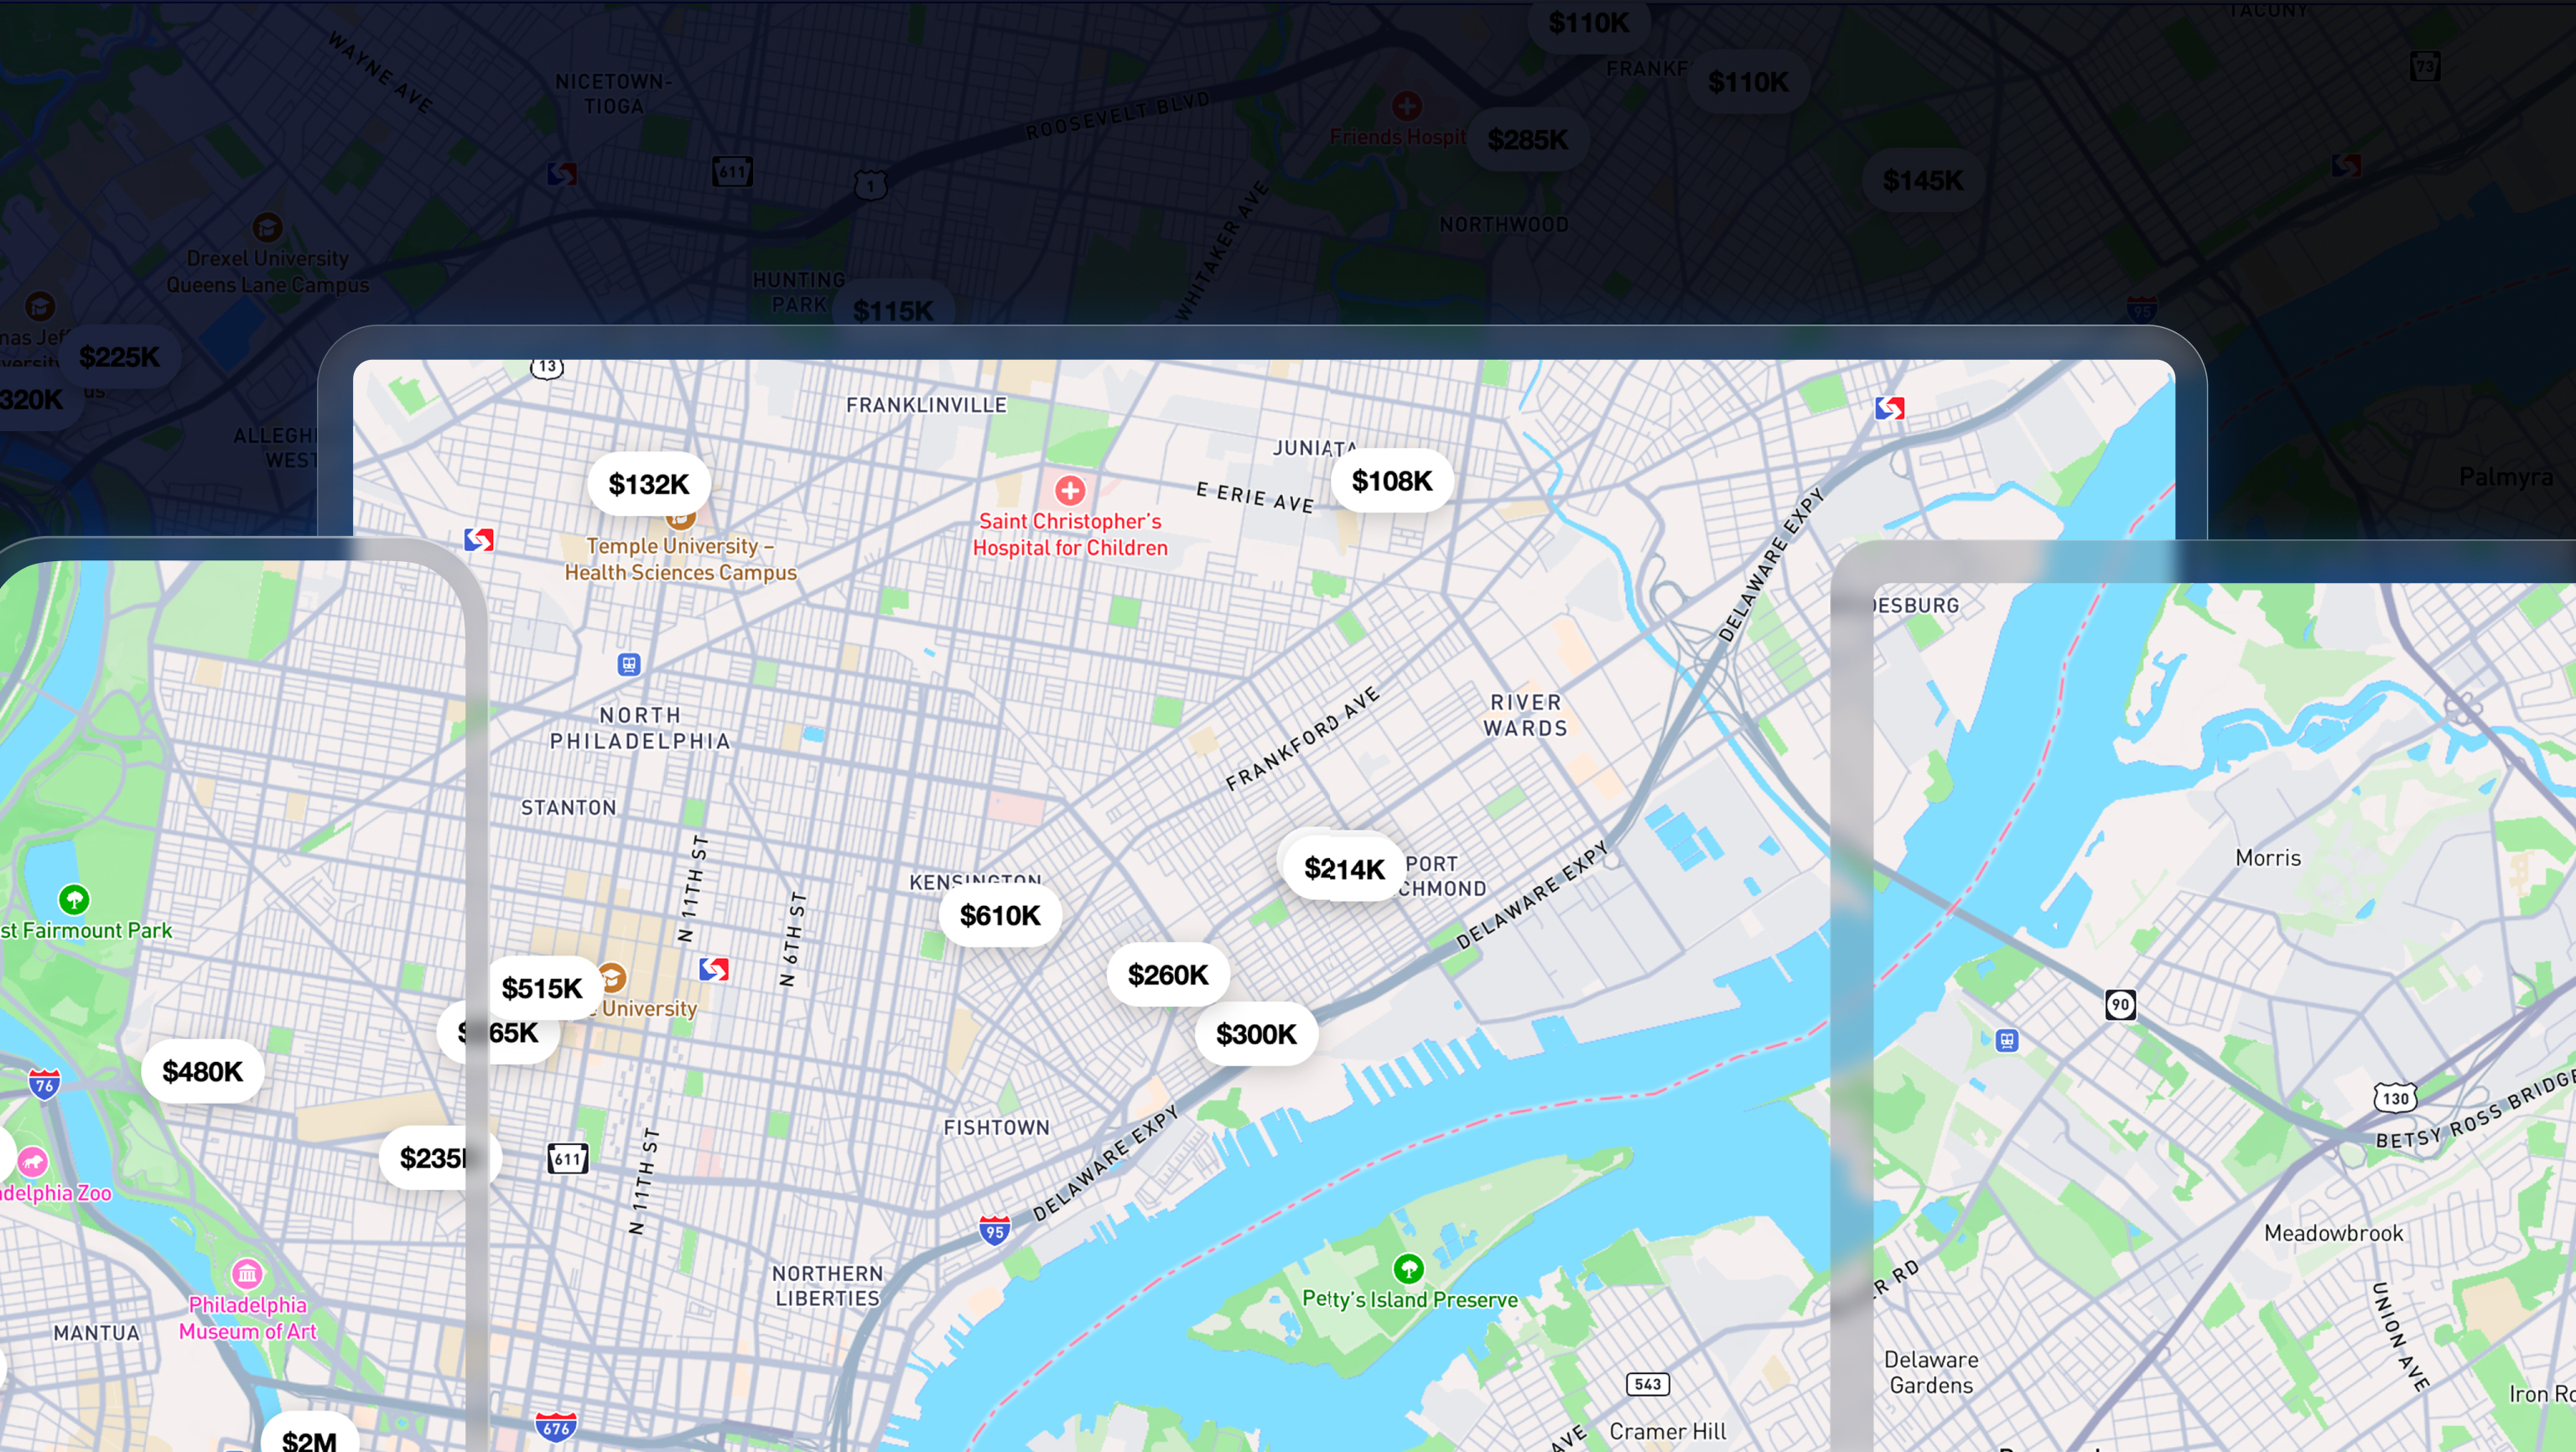
Phil Worland and Luke Decker at Cecilian Partners shared how their team creates digital maps for homebuilders and real estate developers that still feel personal and handcrafted. Instead of treating maps as simple reference tools, they think of them as storytelling instruments. Their work pulls inspiration from old-world mapmaking, where maps were not only factual — they expressed identity, culture, and beauty. To recreate that same warmth, Cecilian Partners blends detailed topography, local amenities, artistic styling, real-time lot information, and 3D elements like buildings and trees. The result is maps that feel both expressive and functional, using four custom core map styles (Soul, Mesa, Peak, and Dune) that show the range of design possible when you pair creativity with a flexible map platform.

How Mapbox enables the ‘art of place’ in real estate
In their presentation, Cecilian Partners explained how traditional tools like static PDFs or editable images made with basic software simply cannot keep up with modern homebuyer expectations. Communities change quickly. Inventory changes daily. People want maps that speak to how they actually experience a neighborhood.
“Mapbox was the natural choice because there's no other platform that can enable this kind of customization, this kind of flexibility, the cost-effectiveness of it, the visual appeal of it, the fact that Mapbox is constantly innovating, and those are innovations that we take directly to our customers. It really hits all of those things and puts us in a position to deliver really unique and innovative solutions for our clients.” - Phil Worland, Co-founder & Chief Product Officer, Cecilian Partners
With Mapbox Studio and Mapbox GL JS, Cecilian Partners has built a system that:
- supports hundreds of communities with consistent performance
- matches the artistic quality of old-world maps
- stays lightweight on phones
- avoids delays even with large datasets
In particular, two features stood out about the property maps that Cecilian Partners creates:
- Point-of-interest explorer: The maps do not only display ‘default’ points of interest pins. They are filterable by category and connect to detailed photos, descriptions, and travel time information, making it easy for buyers to picture themselves living within the surrounding community.
- Lot management tools: Buyers can check prices, builders, amenities, and layout details all in one place, giving them the confidence to move forward in the sales process.
Phil and Luke’s presentation reminds us that even in a digital world, people still connect with maps as emotional objects, not just tools, and especially during the home buying journey the ‘art of place’ and geospatial storytelling carries immense value.
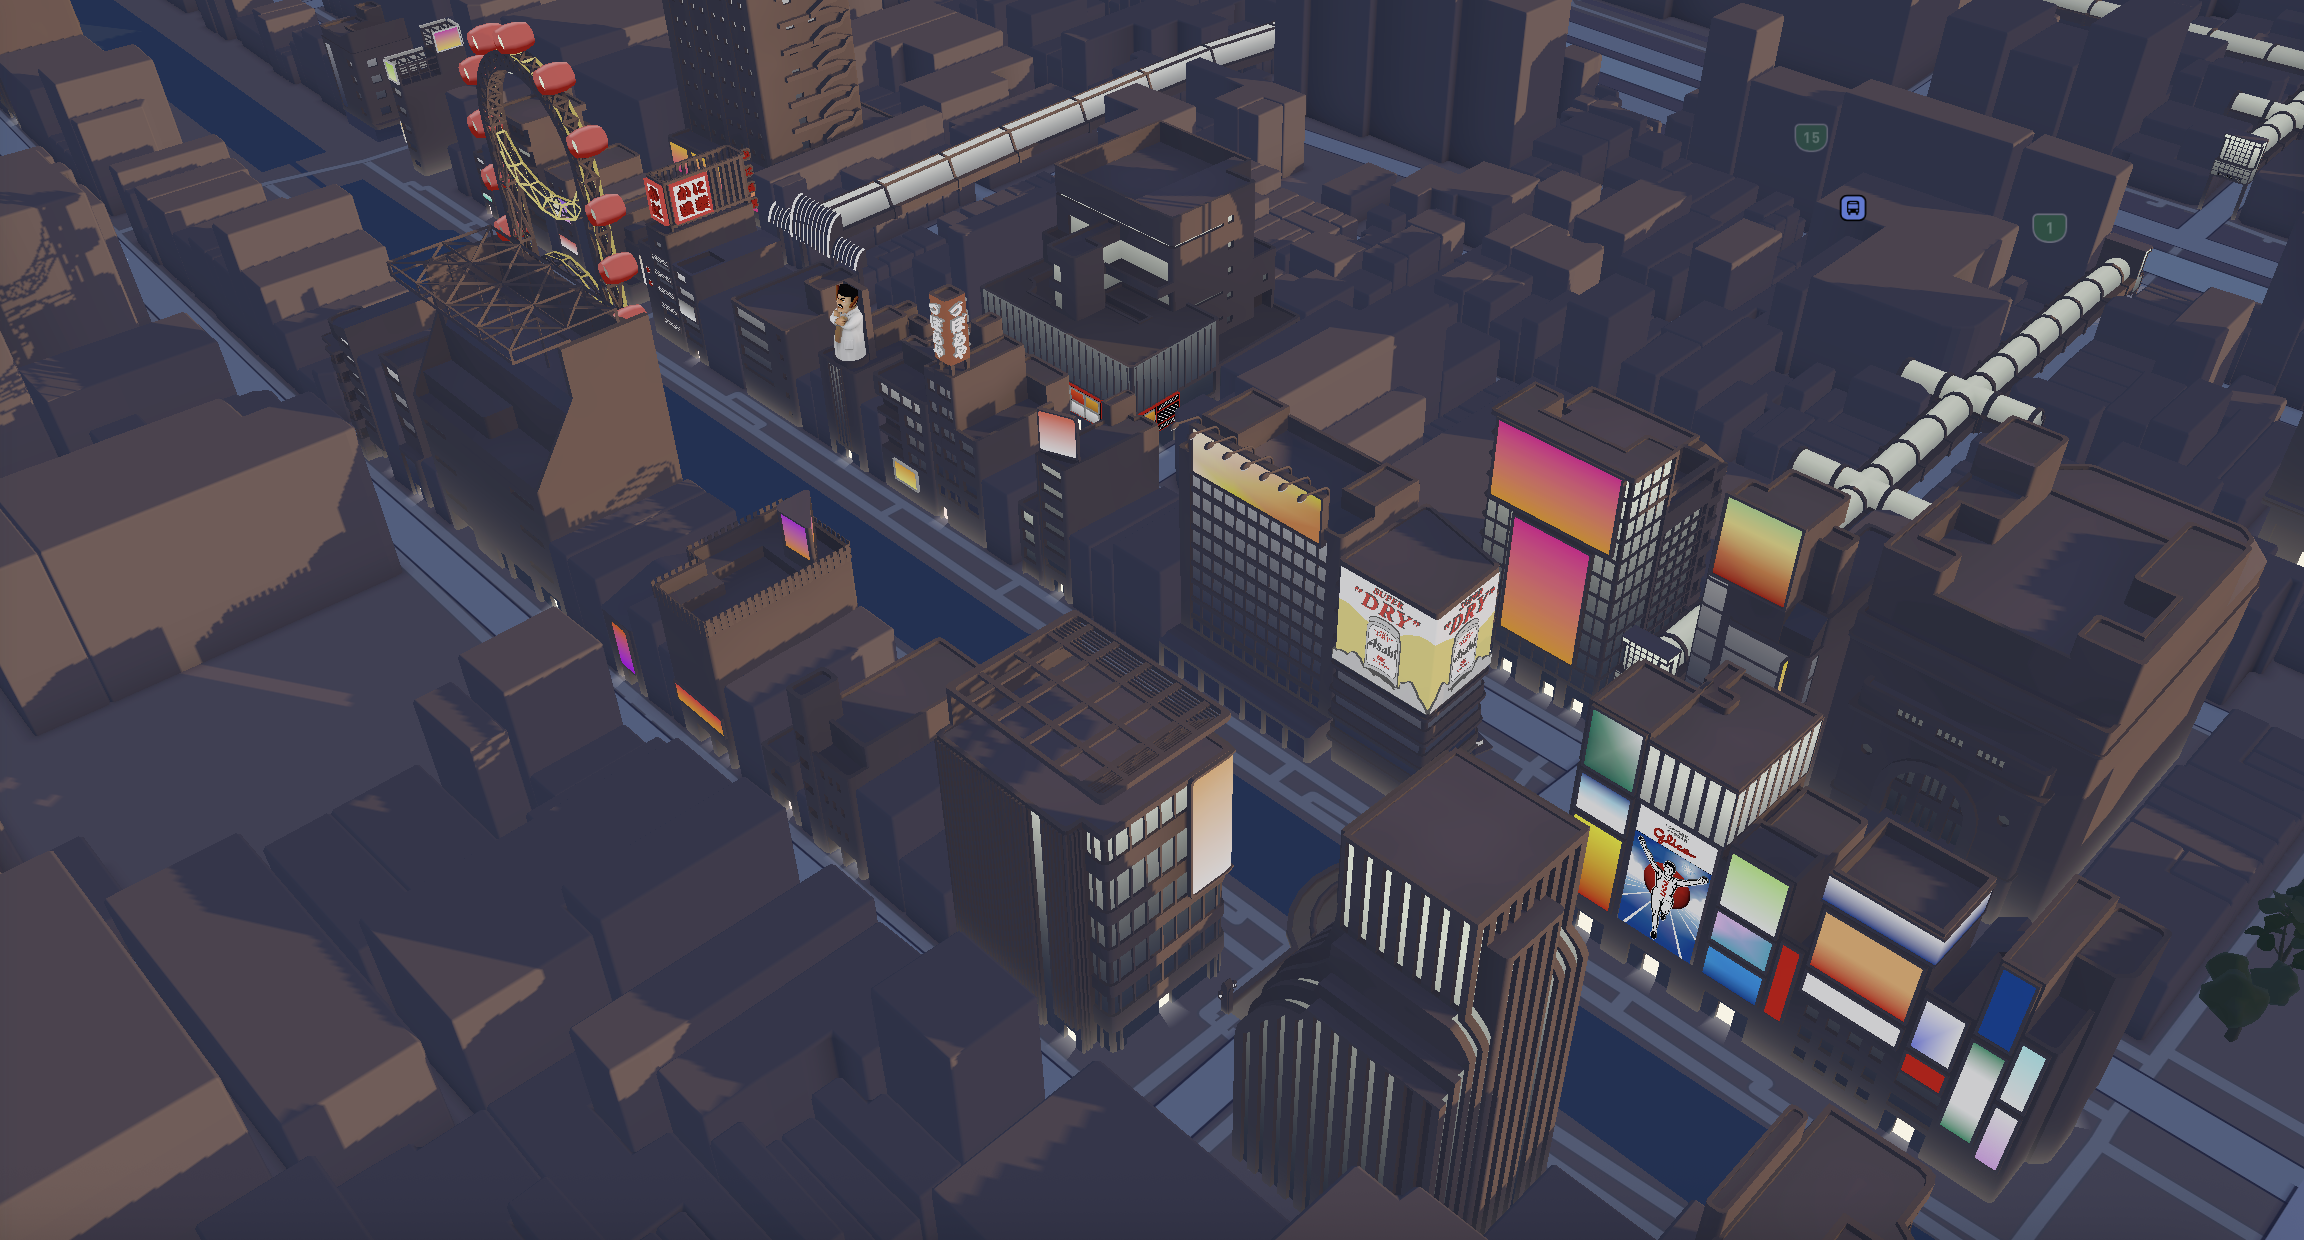
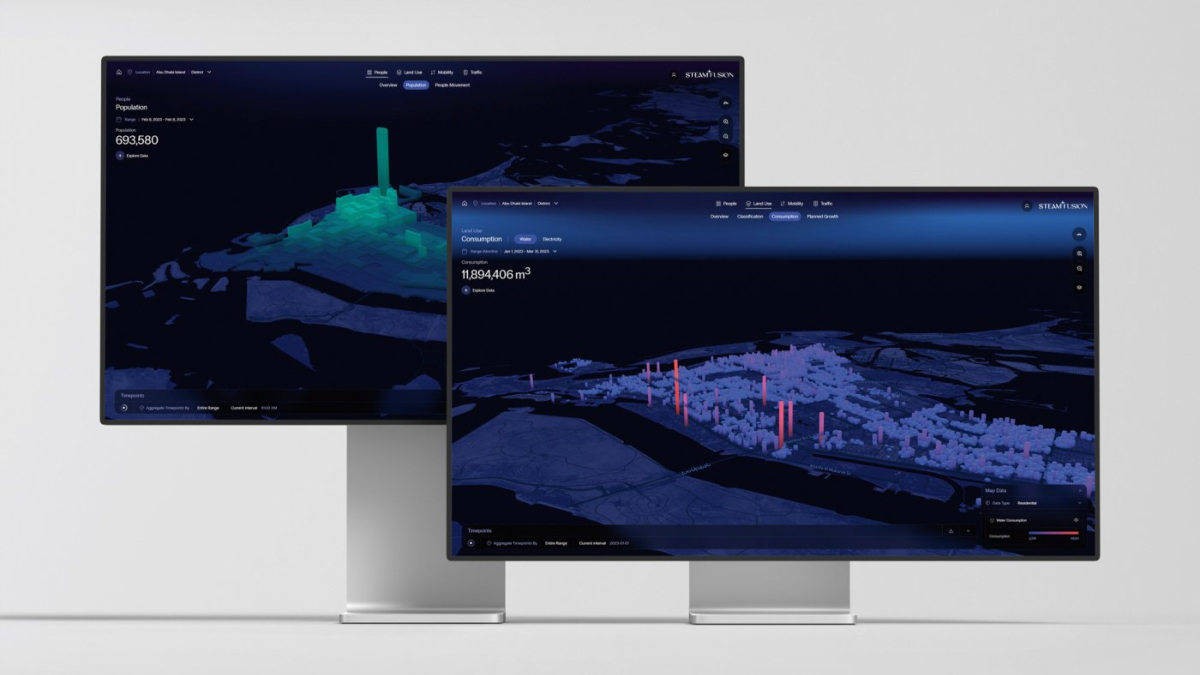
Pixonal & Abu Dhabi Mobility: A city-scale Digital Twin
Mohamed Said, Co-Founder and CPO of Pixonal, shared a tour through one of the most advanced city-planning systems in use today. Built for Abu Dhabi Mobility, the ‘Fusion’ platform by Pixonal helps to shape decisions that affect millions. Fusion integrates a digital twin of the entire city—complete with real-time infrastructure, mobility, and traffic data—augmented with historical trends and predictive analytics extending through 2050.
Translating data into decision-support insights
In Mohamed’s presentation, learn how the immersive Fusion platform empowers planners and policymakers to simulate, evaluate, and optimize city-wide decisions with confidence.
Abu Dhabi Mobility collects over 70 billion data points every single day. Pixonal’s goal was to turn that flood of information into a single system planners could understand and act on. With a clean, modern map-based interface, built on a Mapbox 3D basemap, the Fusion platform helps planners to:
- View tall buildings and infrastructure from multiple angles
- Assess land use
- Compare city districts
- Simulate future mobility scenarios
- Overlay demographics and land details
Fusion has already earned three Red Dot Design Awards, which came as no surprise after seeing the session demo. Pixonal’s work demonstrates how modern maps help cities grow smarter, more organized, and easier to understand.
GE Aerospace FlightPulse: Giving pilots clearer insight before every flight
The aviation-focused session by Jonathan Morrell and Richard Pineo of GE Aerospace showed a whole new perspective on maps for navigation – in the air! FlightPulse is an iPad app used by pilots worldwide, and includes module called Preflight, built with Mapbox.
Pilots often fly into unfamiliar airports. Being able to study historical flight paths helps them understand where planes typically turn, common approach patterns, altitude behavior, and weather-related routing tendencies. Preflight in FlightPulse turns years of flight data into a clear visual map for pilots to reference so they can notice risks early and make more confident choices.

Beautiful map design for practical flight safety information
The presentation showcases not only the stunning design and functionality of the FlightPulse app, but also takes a technical look at how Jonathan and Richard have used Mapbox to enhance the map experience, including:
- 3D camera moves showing approach paths
- Color-coded routing patterns
- Animated flight path lines
- Point-based data for hotspots
- Smooth transitions pilots can review during prep time
“The map remains perfectly performant… if I really pump up [the data] I can still zoom all around, I can zoom into the airport, I can see these events. I can do everything, and it’s just perfectly smooth. And kudos to the Mapbox guys because that’s quite an achievement to show all these polylines without any real hit [to performance].” - Richard Pineo, Senior iOS Developer, GE Aerospace
Even for non-aviation use cases, the session highlighted great examples of clean map styling, simple but effective 3D animation, and techniques for handling dense line data. This was one of the audience favorites because it showed how maps can support human judgment in moments where clarity matters most.
Ai2: Conservation tools that protect wildlife and fisheries
This session by engineers from Ai2 showcased two applications with conservation missions: Skylight for maritime monitoring and fisheries protection and EarthRanger for wildlife conservation and protected area management. Both are used around the world and powered with Mapbox. Together, these platforms support 48,000 personnel, 13,000 tracked animals, and 1.3 million monitored vessels each month. They also process billions of data points from satellites, sensors, and field teams.

Skylight: Protecting fisheries
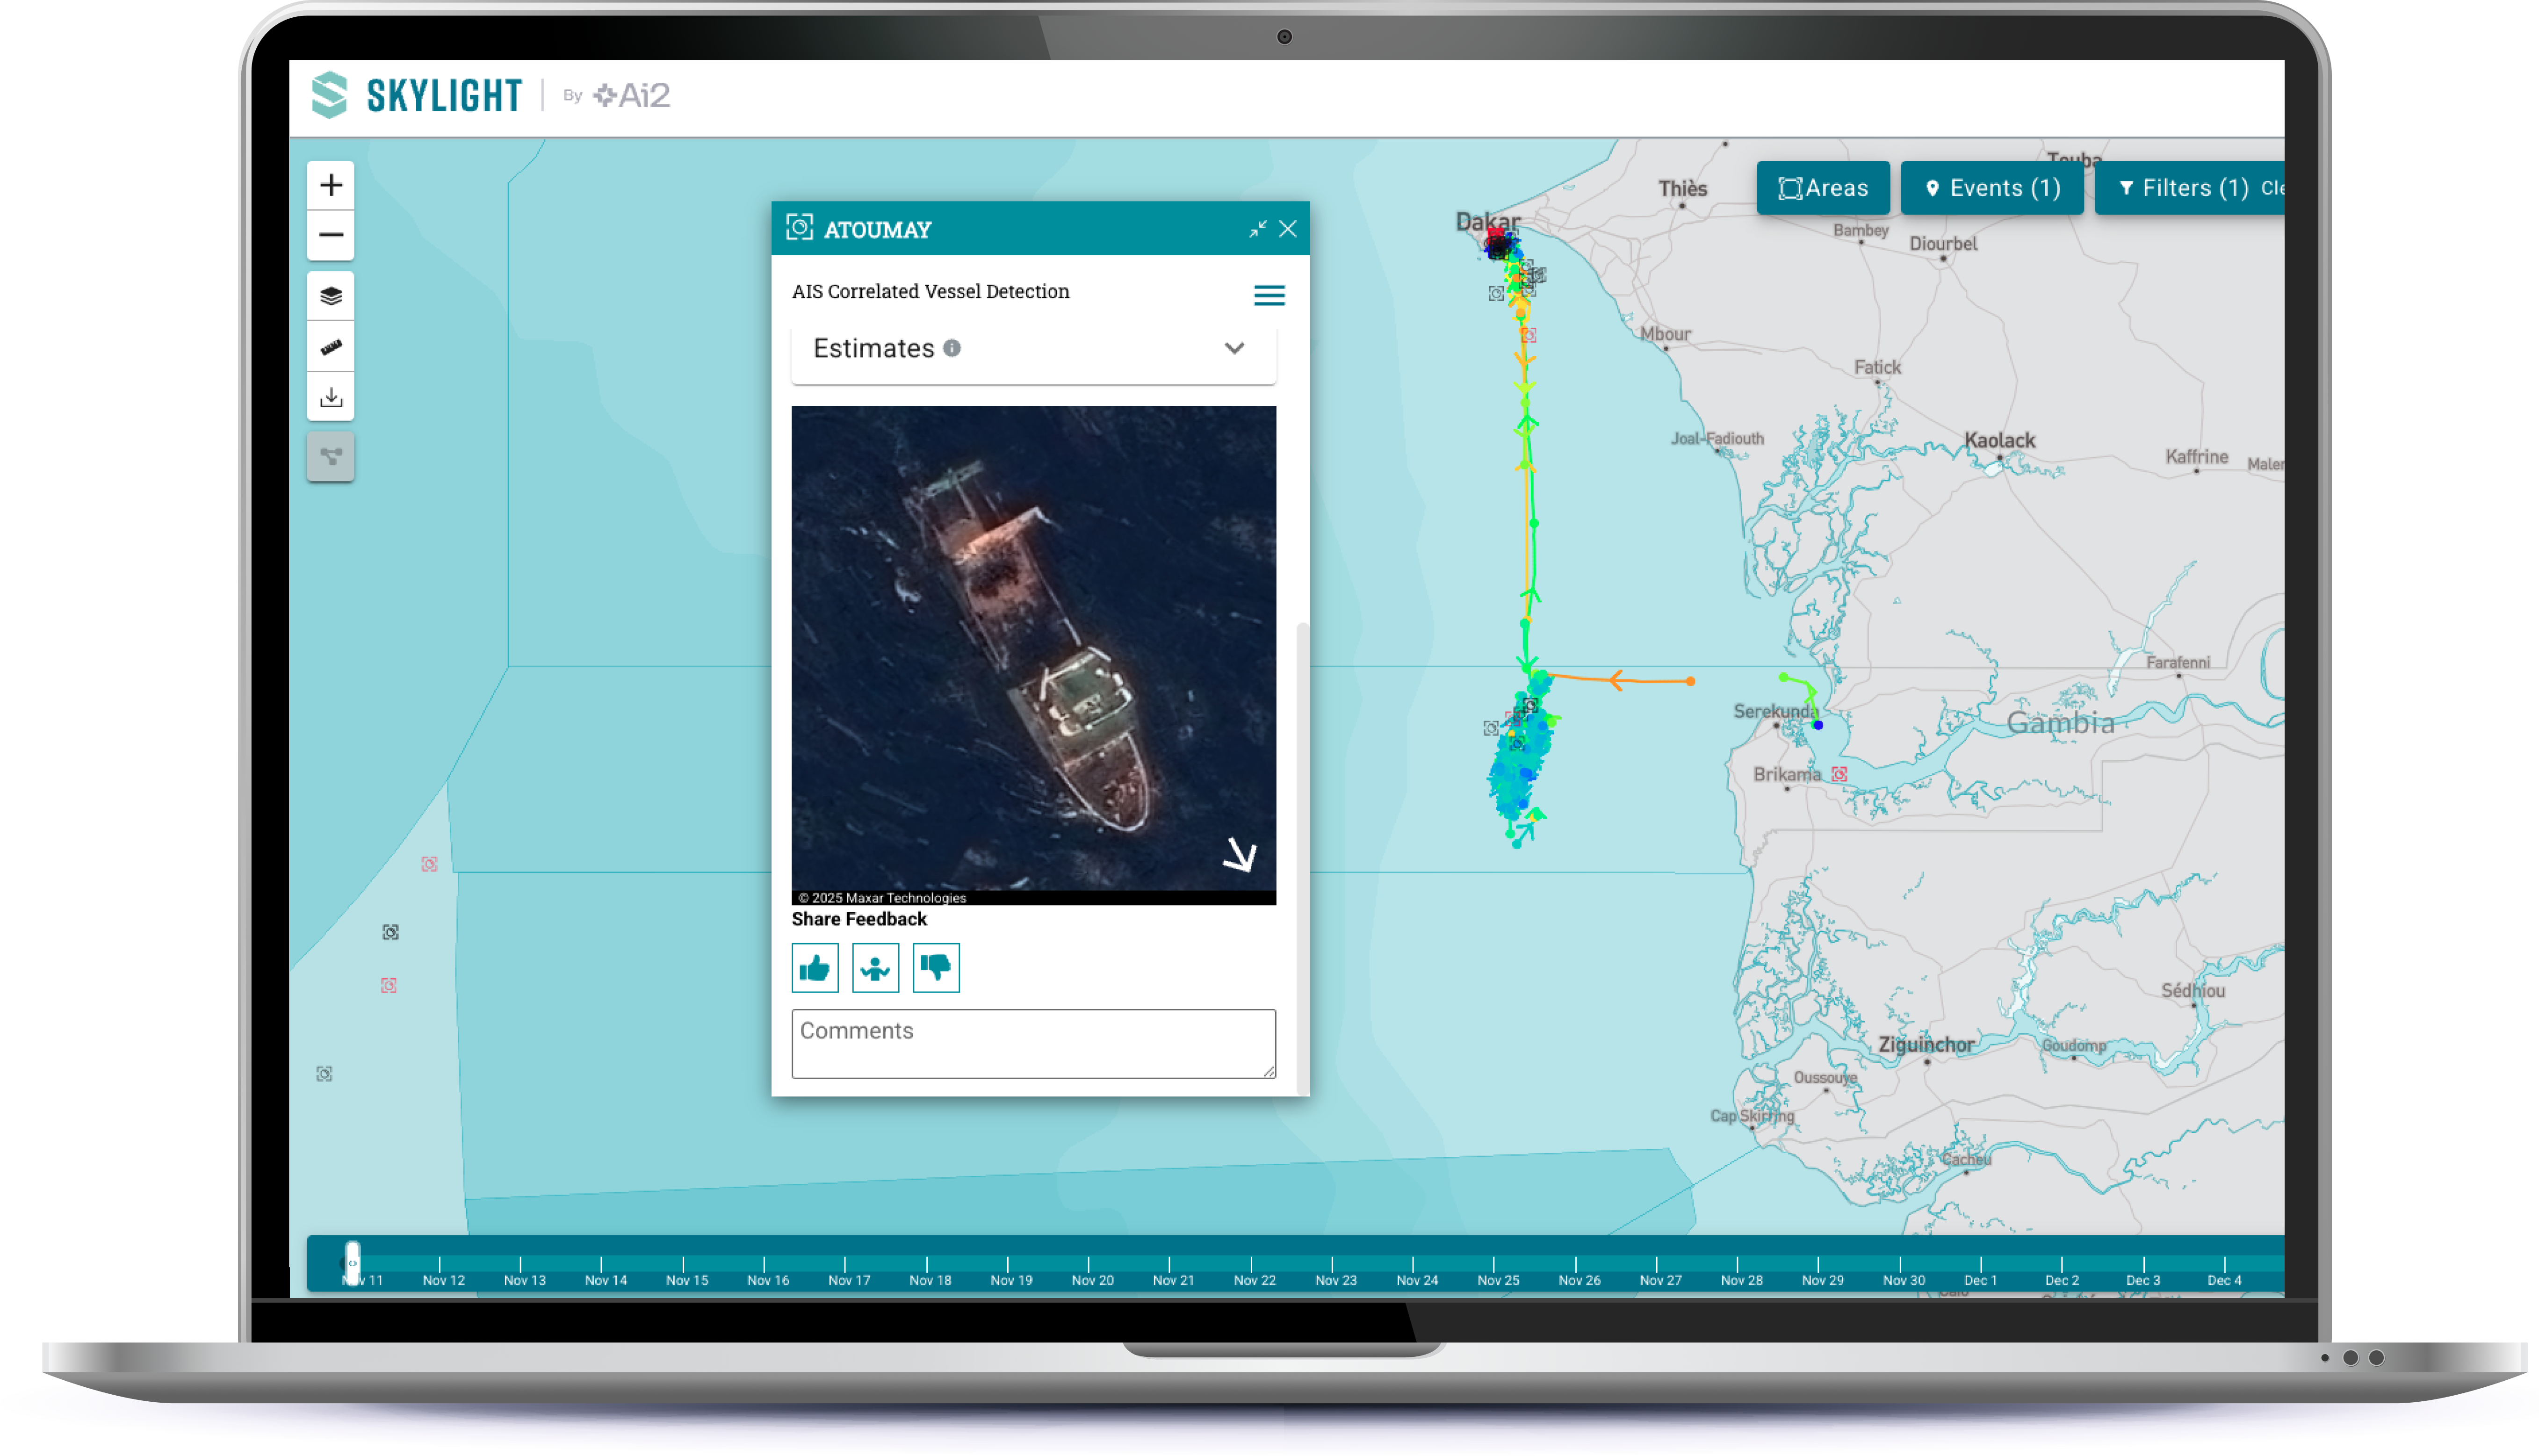
Skylight highlighted:
- automated vessel detection from satellite images
- custom bathymetry maps
- tools to spot suspicious movement
- alerts for possible illegal activity
EarthRanger: Supporting rangers in the field
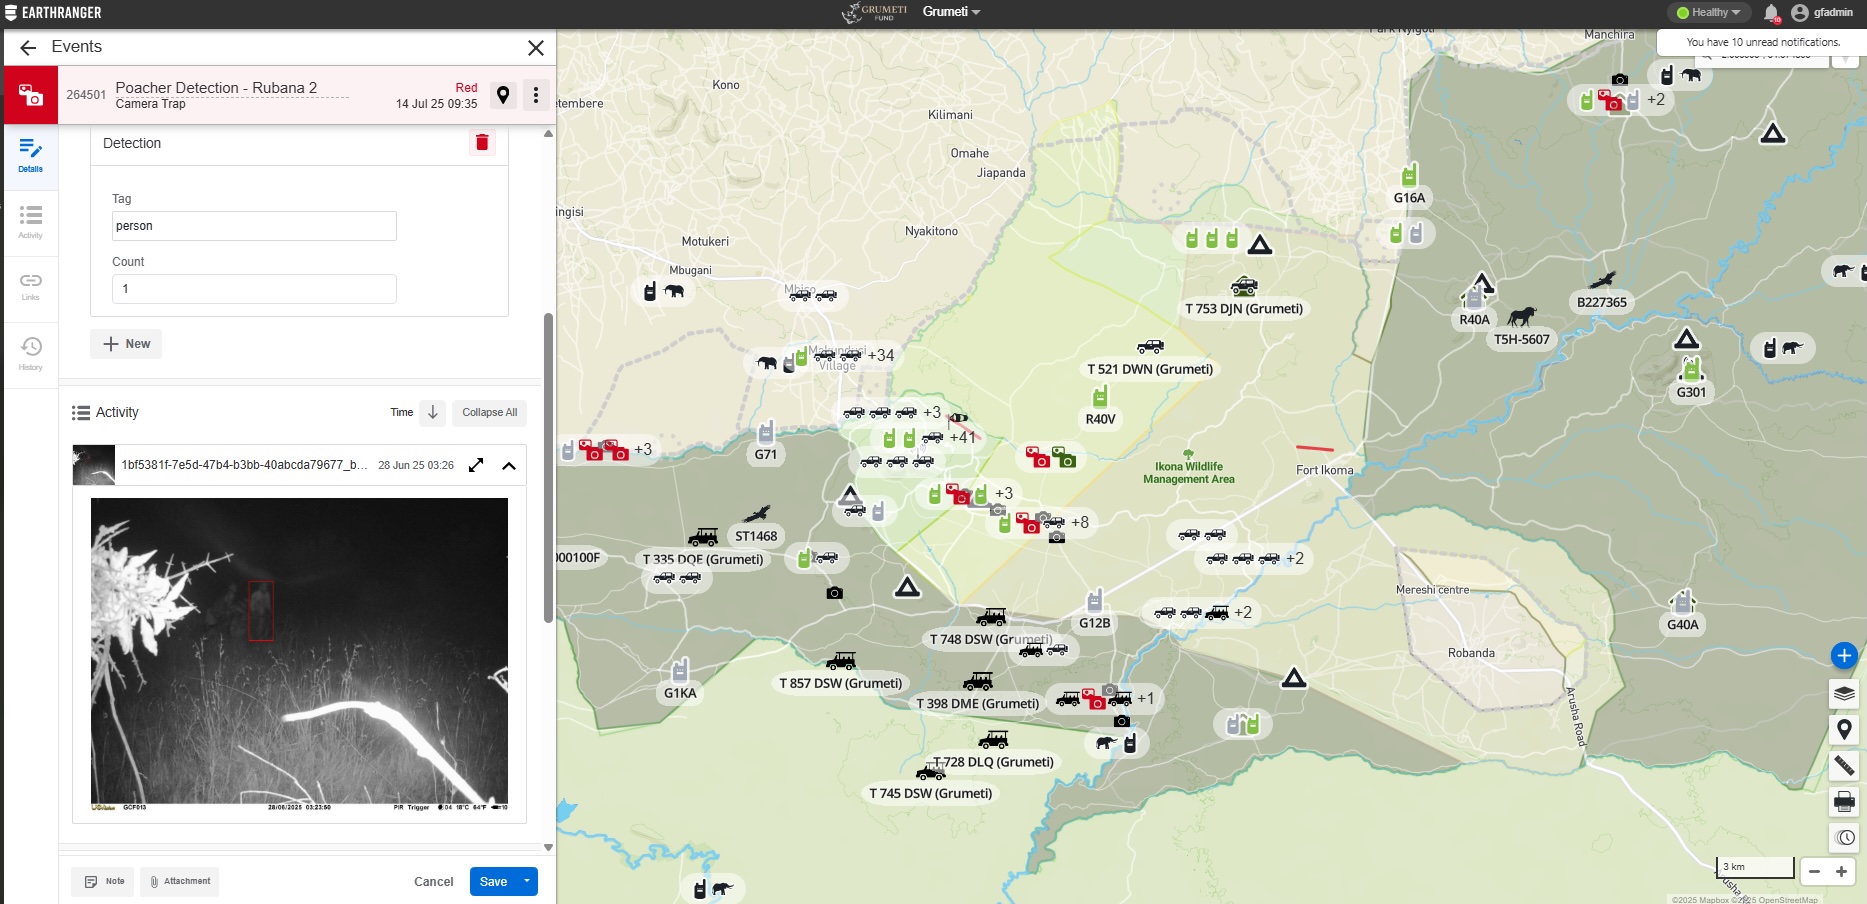
EarthRanger highlighted:
- custom dynamic symbology
- tools for tracking animal movement
- mobile-friendly features for rangers
- timelines to understand patterns
- real-time reports from the field
Both teams explained how Mapbox helps them turn massive datasets into clean visuals that field teams can understand instantly. Their sessions were thoughtful, honest, and filled with stories about the people who protect ecosystems every day.
“I want to show the really high performance. We can have sites that have over 1,000 or 1,500 icons, all dynamically generating these icons on the fly. On a large site, you’re going to get an order of millions of these sensor data.” – Daniel O’Neill, EarthRanger Mobile Lead, Ai2
Maps with meaning
BUILD with Mapbox 2025 brought together people who push digital mapping forward in thoughtful, human-centered ways. From homebuyer experiences to nationwide conservation efforts, each session showed how maps can give clarity, confidence, and deeper understanding.
Whether the goal is to support pilots, inform city planners, guide rangers in the field, or help families choose a new home, the message was the same: when maps are built with care, they help people make better decisions.
Frequently asked questions
1. What is BUILD with Mapbox?
BUILD with Mapbox is a virtual conference hosted by Mapbox where developers, designers, and product teams share how they created applications with Mapbox tools. Sessions include demos, Q&A, and practical insights.
2. Where can I watch the BUILD with Mapbox sessions?
You can view all BUILD with Mapbox 2025 recordings on YouTube.
3. Who benefits from using Mapbox?
Product teams, engineers, developers, and builders across industries. Real estate, aviation, conservation, government planning, retail, logistics, outdoor apps, and many others use Mapbox to create custom map experiences.
4. How can I get started with Mapbox?
Create an account to get started and take advantage of free tiers that let you begin building without friction—only pay for what you use. A single account gives access to all self-serve products, with the option to upgrade to additional services or annual contracts. Mapbox also offers award-winning documentation, plus personalized recommendations after sign-up to help you find the best place to begin.


Related articles
Build once, run everywhere: Web support comes to the Mapbox Maps SDK for Flutter
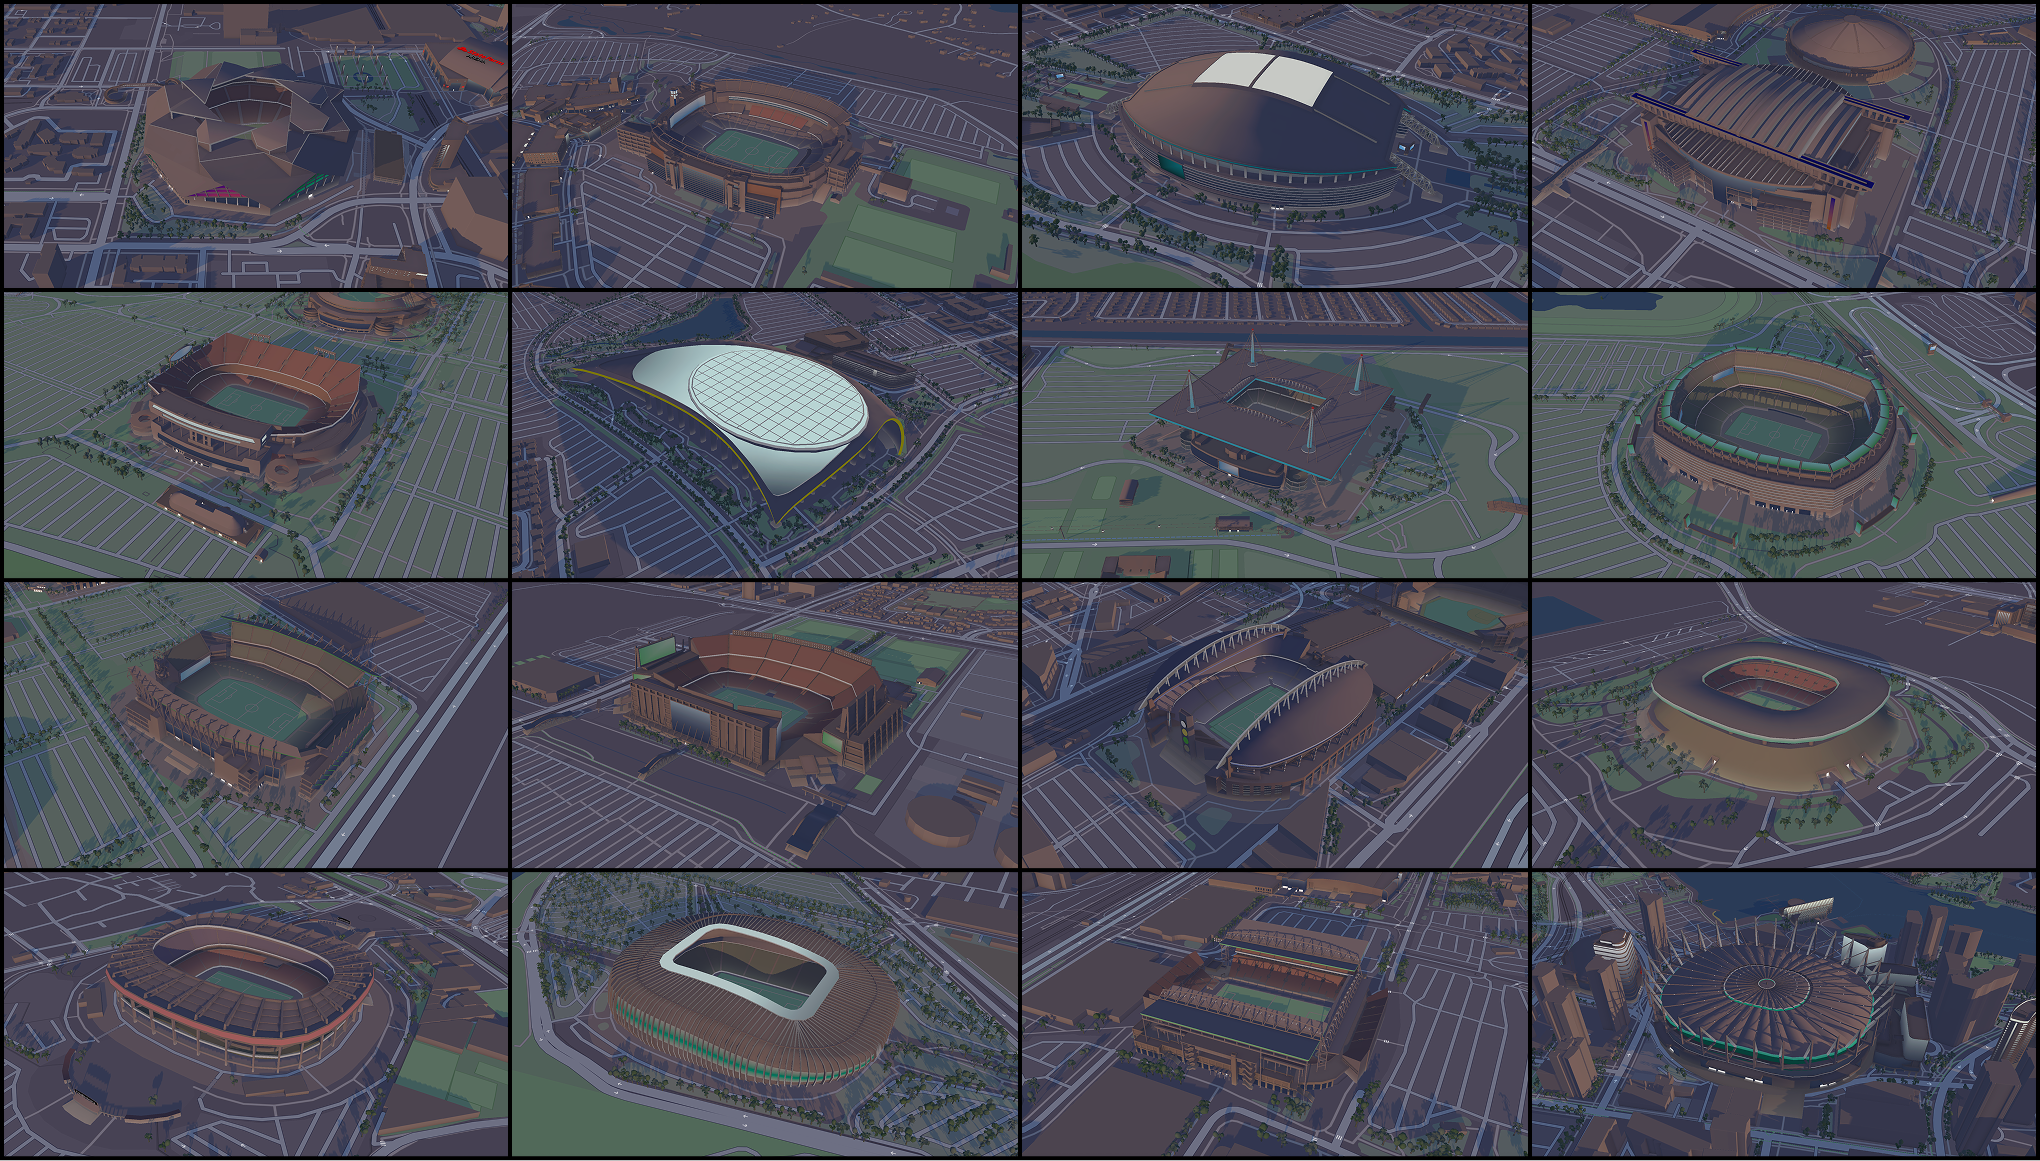
From airports to stadiums, maps are elevating the soccer fan experience