Mobile Device Telemetry as a Sensor
Calibrating Mapbox Movement

Mapbox Movement is a data product used by academic groups to study people’s responses to the COVID-19 crisis, large retailers, logistics companies, and sales teams to help them prioritize locations for their operations. It’s helping answer important questions about the density of people in any given area and how much those people move around, relative to other areas and prior dates. Mapbox Movement is our proprietary data set that uses aggregated mobile device telemetry as a calibrated sensor to approximate people density over both space and time. This post will briefly describe what the Mapbox Movement data is and then explain in detail how it is calibrated.

It is not possible to accurately measure human density everywhere, all of the time. However, it’s really easy to do it over only a little bit of space and time. The ubiquity of GPS-enabled and internet-connected devices like smartphones or in-car navigation systems and the stream of anonymized data they produce allows Mapbox to measure device density over space and time, almost everywhere, and almost all the time.
A note on privacy: At Mapbox, we work hard to ensure that we collect and use only fully anonymized data from our users, and that we remain responsible custodians of the data that we have collected. You can read more about our privacy policies here. You can read more about the principles we follow concerning telemetry data usage here.
In a single sentence: the Mapbox Movement product represents aggregated (and anonymized) GPS telemetry coming through Mapbox as a sensor which we calibrate to obtain interesting and valuable data about relative trends in the density of humans over space and time.
A Tale of Three Blocks: An example from our free-to-try public data, showing the effect of COVID19 restrictions over the course of Feb/March/April 2020, as measured on three different city blocks in San Francisco:


A few trends:
- The Transbay Bus Terminal (a major workday commute hub) showed a clear weekly trend before the shelter-in-place advisory (it was very active during the workweek but quiet on the weekends), but it went totally dark after the shutdown.
- Golden Gate Park was relatively steady the whole time, as everyone continued to go outside for fresh air.
- Activity at Costco declined a bit, but then quickly returned to pre-pandemic levels as people stocked up supplies for home.
- Note the dramatic dip in Costco’s activity on April 11th: Costco was closed for Easter Sunday.
Calibrating the sensor
Good calibrations are always difficult and that’s especially true here: actual ground-truth measurements of that density-of-humans number simply do not exist at the very fine spatial and temporal scales required. Other similar data sets exist from other providers and we compare our data to them regularly for sanity-checks (see our comparison to Apple mobility, Google mobility, and the Economist’s Normalcy Index in this announcement), but none of those are “ground truth” either.
Mapbox Movement has a significant advantage over our competitors in the “calibrating device density” game: Mapbox-powered maps are used by a great number of different apps, each targeting a different subset of the population, running on both major mobile device platforms (iOS and Android), all around the world. Using the law of averages it is possible to calibrate the data against itself.
The power of the middle: If we assume that each app samples a different, uncorrelated subsample of the overall population, then we can calculate device-density timelines of activity for each app, and then take the median curve across all of those timelines. That median curve will be a much more reliable measure of trends in human density than any raw aggregation of device density could be. This assumption doesn’t hold if the user bases of different apps are too highly correlated with each other. However, our data shows much of the time they are less correlated than you would think - Mapbox powers everything from weather apps to in-car navigation to fitness apps and location-based games, each of which really do sample very different subsets of real humans.
The middle in action: The plots below show proxies for our per-app device density counts in San Francisco, over Feb/March/April 2020 - each colored line shows the aggregated and anonymized data coming from a single app. Note: these curves are correlated with the per-app device density, but are not direct measures of those values.


This diversity-of-apps concept is a double-edged sword: the apps that use Mapbox occasionally churn. Sometimes large volumes of data begin flowing from a new app that recently started using Mapbox, or an app may suddenly go dark, or maybe, some app just goes viral for a few days in one city. If any of these individual apps are popular enough, these sorts of changes will significantly affect the population-sampling rates (and thereby total data counts). Median-to-the-rescue again: the median-across-providers mechanism works great to handle app churn, in addition to handling biased-subpopulation effects.
Thinking about time and space: The median-across-apps curve is effective, but it only works when enough data from enough different apps exists to calculate the median curves. The median-across-apps idea is data-hungry; if a data set strictly requires enough telemetry to take a median across apps, the resulting data product would only be available over relatively large areas (e.g. a city) and not available at much finer granularities (e.g. single city block) required for most customer use cases.
Even if actual activity varies hour-by-hour and block-by-block, the demographic and app-churn effects calibrated out of the signal really only vary over longer timescales (e.g. day-to-day or month-to-month) and larger spatial scales (e.g. city-to-city, or city-vs-suburban-vs-rural). We can take advantage of this fact to calculate a unit-less correction factor F, by calculating the median-by-app curve on those larger scales and measuring the fractional difference between that curve and the actual device density curve. Then we can smoothly interpolate that F down to the smaller spatial scales required so as to apply it to uncalibrated device densities resulting in calibrated activity measures at finer spatial granularities.
Let's illustrate this with gifs:


The calibrated result
Japan offers a great example of these approaches coming together: over the course of 2019 and 2020, Mapbox dramatically expanded its footprint in Japan and the amount of telemetry there skyrocketed. Japan's official COVID-19 response looked a lot different than that of the US, but COVID affected the whole world. Looking at that same Feb - Apr 2020 time period but in Japan, shows what the activity on the streets of Japan looked like over those months.

The raw (uncalibrated) device density curve is wrong - or at least a poor proxy for human density since activity in Japan did not actually double overnight in April. On the other hand, the calibrated activity curve looks great. It shows what was actually happening - a continuing decline in activity as Japan began slowing down and staying at home. So what happened with that wonky device curve? A new application built with Mapbox began generating enormous amounts of data in Japan.
And getting to that nice calibrated activity curve? It is all in the median. Here is the per-app device density curves over that period, overlaid by the median curve in black:

Observe the red curve in the upper right - the new app launches on April 1st - going from 0 to 10,000,000 in 24 hours! (Note the log scale on the Y-axis.) But, the median curve remains nice and stable. So the F-factor, calculated by way of the median curve, allows the benefit of the increased accuracy from this dramatic expansion in data coverage, without wrecking the timelines for comparisons.
Smoothly interpolating over varying spatial scales
How do we account for variations in demographics across various cities and between cities and rural areas (ref: the Localized App Adjustments section in this announcement)? This is accomplished by calculating the median-by-app curve on city-sized spatial scales to arrive at the F-factors, and then interpolating those F-factors down to enable the city-block-sized scales at which the final Movement product is offered.
Mapbox covers the entire world, for 3+ years’ worth of historical timelines - this means interpolating millions of rows of data out to billions of rows. This is done in a locally-aware fashion, taking advantage of a dynamically-calculated spatial hierarchy. This allows the median-by-app curve to be defined at whatever maximum spatial granularity the data will support in any specific area of the world because data density varies widely between different locales. The sparsely-sampled and spatially-varying massive dataset can then be interpolated down to the fine-grained and uniform spatial scale required.
If you’d like to get your hands on some of these data to explore yourself, you can learn more about our public sample data here.


Related articles
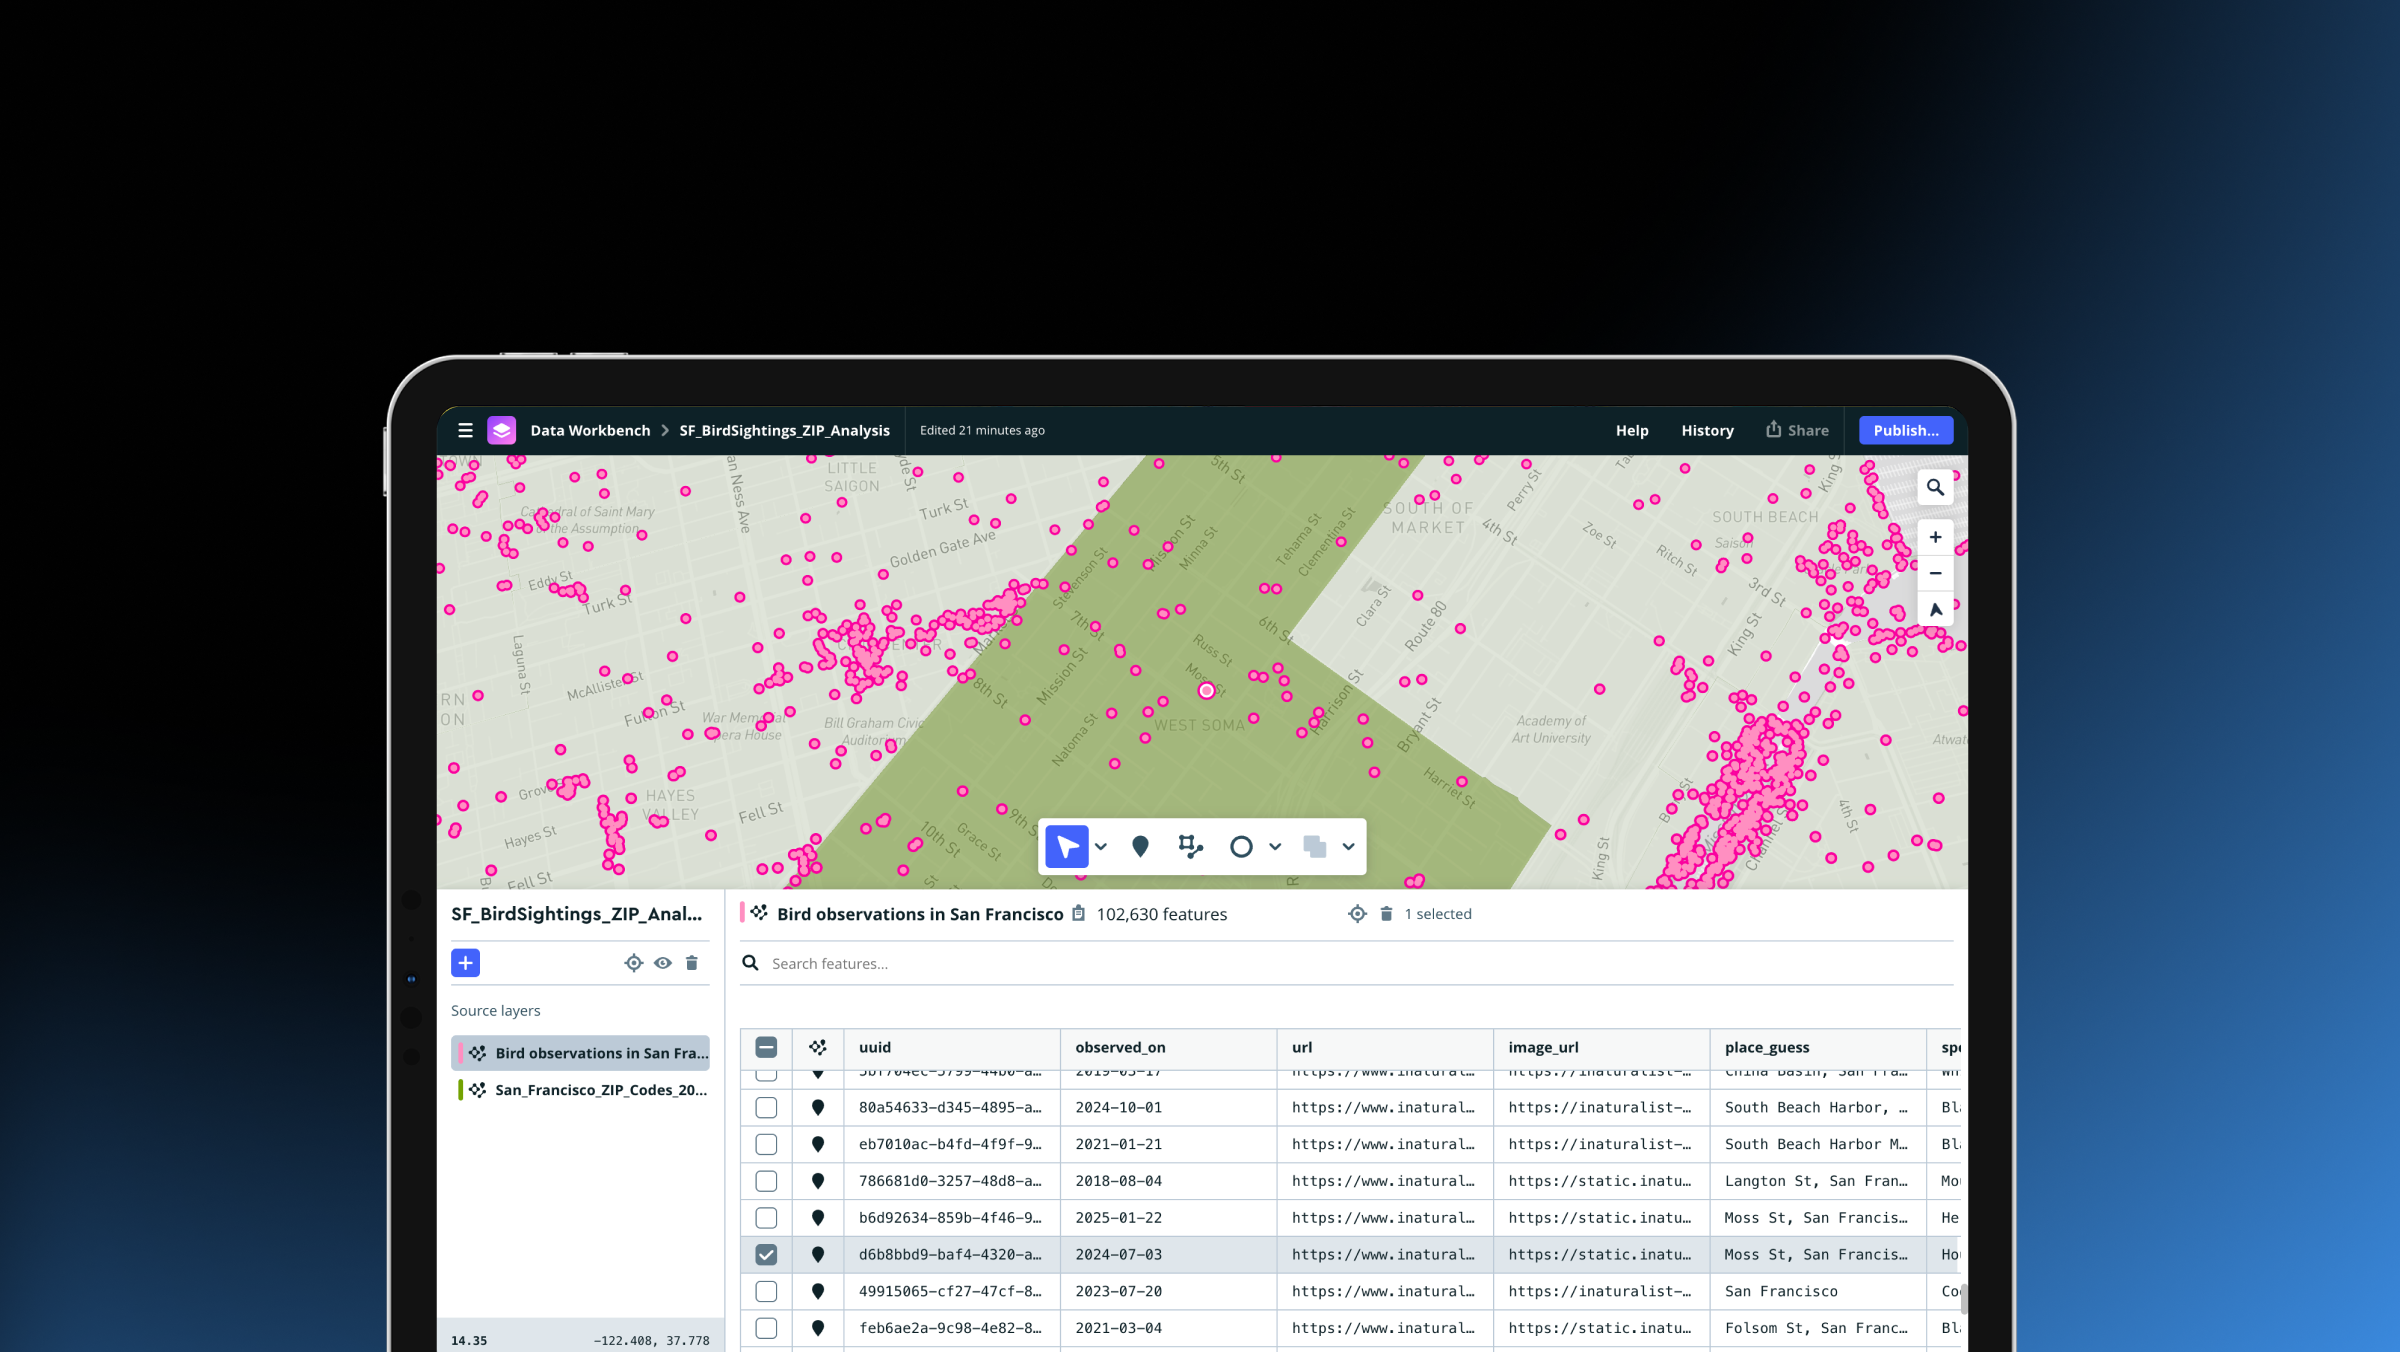
Drag, drop, edit, publish: A simplified workflow for custom data
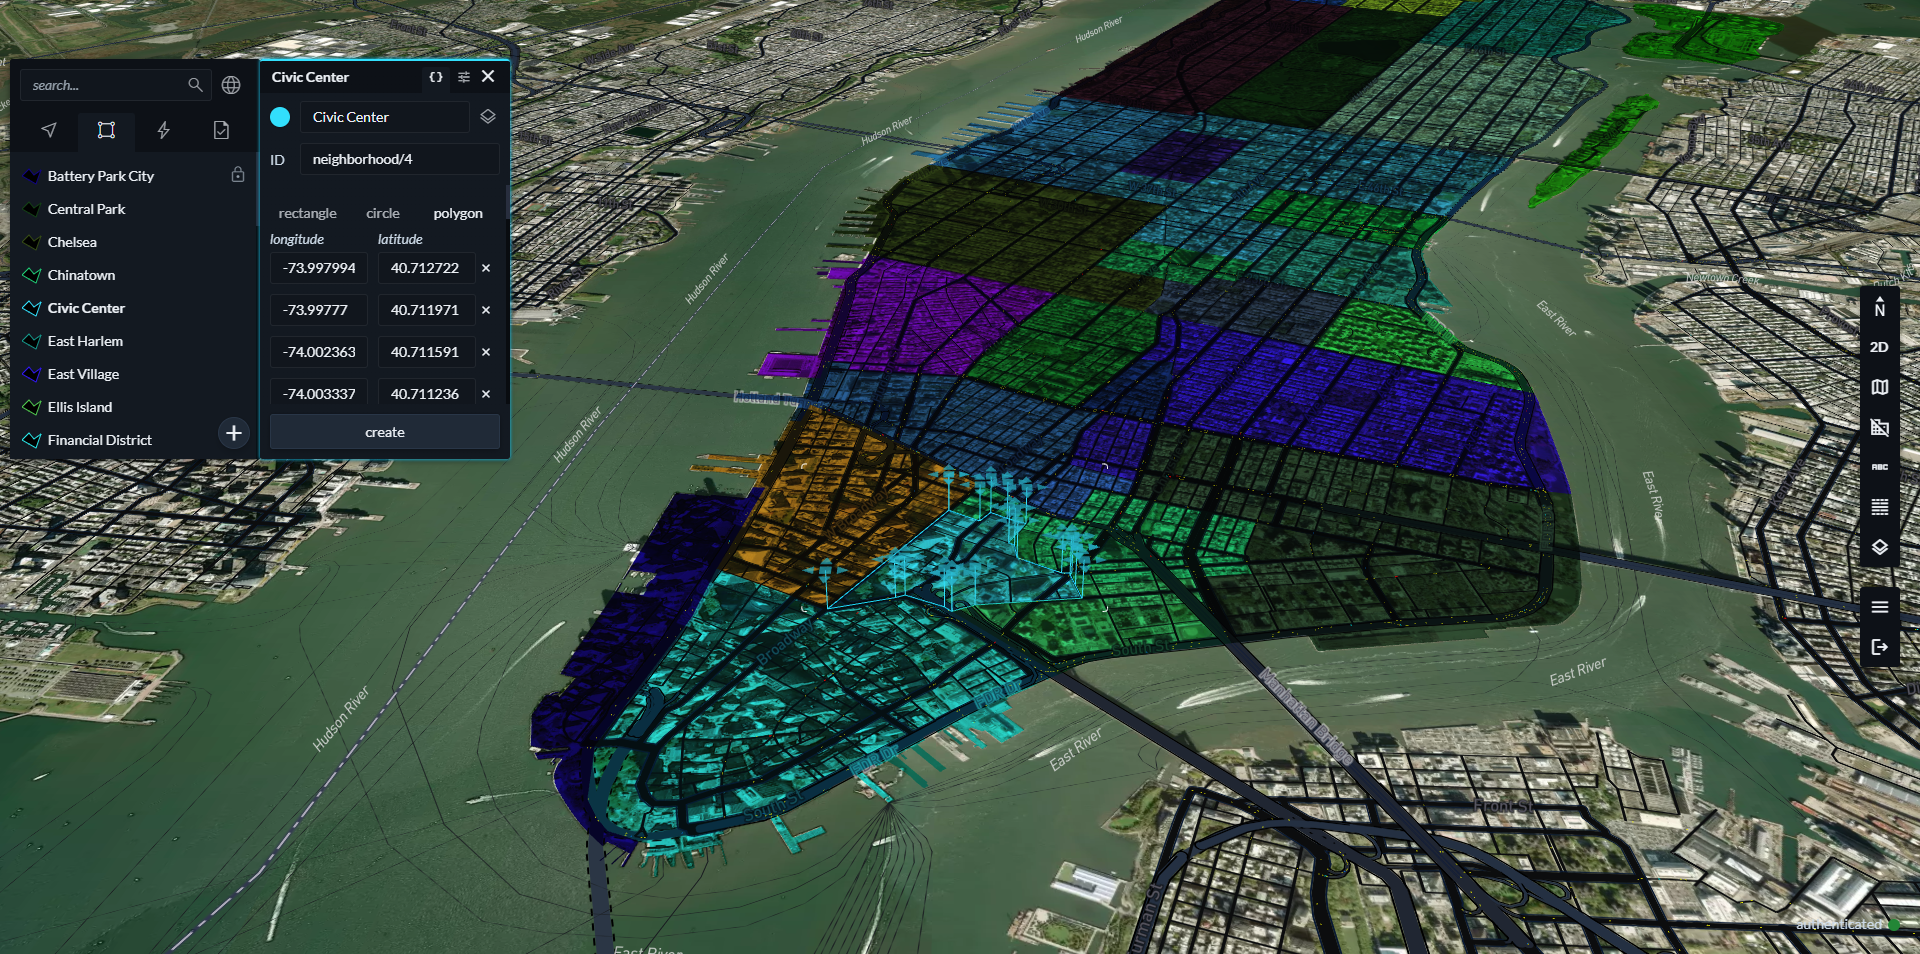
Mission-ready mapping: Securely bring together maps, AI, and response