Back to all cases

Building with Mapbox GL JS and Geocoding API helped FlowmapBlue to increase customer satisfaction and make creation of flow maps significantly faster.

Key benefits of building with Mapbox
- Fast and seamless creation of custom flow maps with Mapbox GL JS
- Mapbox Geocoding API simplifies the development by turning location names or addresses into geographic coordinates
- Flexible and cost-optimized platform that smoothly integrates with deck.gl
products used
About FlowmapBlue
FlowmapBlue is a free tool for representing aggregated numbers of movements between geographic locations as flow maps. It’s used to visualize various real-world phenomena in which pairs of locations are involved: origins and destinations. The tool started as a small project, but the diverse scope of use of such visualizations quickly made the project popular in various industries: urban mobility, travel or commuting behavior, bicycle sharing, human or bird migration, refugee flows, marine traffic, freight transportation, trade between countries, supply chains, scientific collaborations, or historical data.
By turning intricate data on geographic movements into intuitive visual representations, the tool aims to transform how such data is consumed and understood.
Scaling up data visualization animations
The core idea of FlowmapBlue is to enable users with the ability to smoothly create origin-destination data visualization projects, but the key tool component – transforming complex, aggregated movements between geographic locations into visual representations used to be a manual and time-consuming process that required knowledge of programming, or specialized software. Ilya Boyandin, creator of FlowmapBlue, realized during his data visualization studies that there was a need for a simple and intuitive tool that allowed people without special knowledge to make flow maps. In addition, Ilya was looking for a flexible solution which could power an efficient WebGL visualization framework deck.gl, which offered a foundation for building the FlowmapBlue.
A scalable location foundation
When Ilya started developing FlowmapBlue, he searched for a good solution for rendering base maps, with the goal of making the process of creating flow maps as simple as possible for the users. Mapbox was more flexible, cost-optimized, and could integrate smoothly with the cross-framework for visualizationions – deck.gl.
There was a need for a simple and intuitive tool that allowed people without special knowledge to make flow maps. Mapbox GL-JS and Deck.gl offered a great foundation to build this upon
Ilya Boyandin, Creator, Flowmap.blue
Using the extensive Mapbox GL JS documentation, adding a base map layer to FlowmapBlue went smoothly and soon Ilya was expanding the application with new features.
Seamless map visualizations, built in minutes
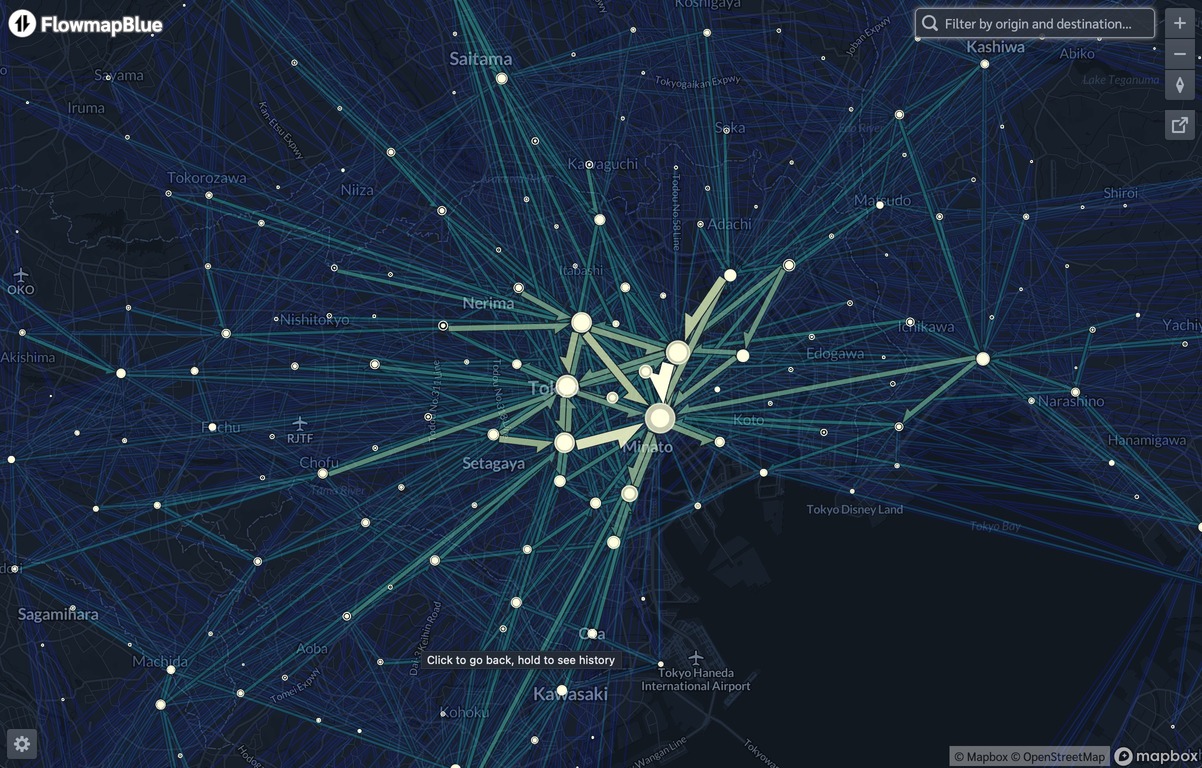
Using Mapbox GL JS, FlowmapBlue developed an algorithm that enabled users to create data visualizations with a unique capability – to automatically cluster locations and aggregate flows ensuring maps remain readable irrespective of the zoom level and the number of flows. The clustering dynamically adapts to the zoom level to ensure clear map-based visualizations: when zooming in, the clusters will gradually expand, so the level of summarization will automatically adapt to the map zoom level.
Mapbox not only provided geographic context for analysis and visualization, but turned the time-consuming manual process into seamless automated experience.
It used to take hours or even days to prepare base maps for flow maps. With Mapbox GL JS it is instant.
Ilya Boyandin, Creator, FlowmapBlue
The ability of Mapbox GL JS to easily handle large amounts of precise, custom data and seamlessly render it into custom interactive maps enabled users with a polished visualization experience they expected.
With the use of Mapbox Geocoding API, FlowmapBlue helps users prepare their data for visualization on a map by turning location names or addresses into geographic coordinates.
From indie project to commercial application
Once FlowmapBlue made it possible to publish interactive flow maps from data spreadsheets, allowing anyone to create and share flow maps in no time, positive feedback did not take long to appear.
Fascinated, how easily you can just dump data on origin-destination for 100,000 routes into a google spreadsheet and http://flowmap.blue gives you this fancy interactive map right away - without any performance issues 🙌
Alexandra Kapp, Researcher @HTW_Berlin on data science and mobility
Creator Ilya Boyandin realized that with Mapbox he had the platform for scaling up the tool and an opportunity to build a more full-featured, commercial version for mobility data analysis – Flowmap City.
Mapbox opens up new possibilities for developers by simplifying the deployment of rich and insightful interactive map visualizations on the web. The time saved from not having to develop and maintain homemade mapping services is substantial. In my case, this was instrumental in paving the way for the creation of 'Flowmap City.'
Ilya Boyandin, Creator, Flowmap City
By integrating Mapbox GL JS and Mapbox Geocoding API, FlowmapBlue and Flowmap City have not only gained essential geographic context crucial for analysis and visualization, but also transformed understanding and visualizing origin-destination movement data into an easy process without limiting the usability of tools to a specialized audience.