Retail Recovery Using Movement Data

Retail businesses across the globe are using Mapbox Movement data to take a data-driven approach to the re-opening and recovery process for brick and mortar commerce.
PepsiCo is monitoring COVID-19 impact through mobility data to see “what's happening" around their stores. PepsiCo’s analytics team is working with Mapbox Movement data to better understand sales trends and store performance.
Traditional approaches to solving this problem involve purchases of market analysis reports which are updated annually (or quarterly at best) and contain pre-packaged “insights” on a particular industry and geography. Mobility patterns are changing in new and unpredictable ways so insights from their reports are already outdated by the time they are published.
A better approach is using Movement data, which is updated daily and made available as a data feed with a simple to use schema so that customers can derive their own insights in near real-time.
The first step is to establish a baseline -- what was the “normal” activity pre-COVID? Once the baseline for a specific store is understood, the next step is to monitor daily activity levels and watch for sustained activity above a threshold which may indicate the “new normal” for a given area. Lastly, compare this activity level at the individual point of interest with activity levels in the surrounding areas for additional context and insights.
Case Study: Green Hills Mall
The Mall at Green Hills is a suburban shopping center located just outside of Nashville, Tennessee. The mall features luxury brand name stores like Louis Vuitton and Burberry, as well as popular favorites including Anthropologie, Lululemon, and Whole Foods.
Like many other malls, Green Hills closed their doors to all customers for several months during Spring 2020 for public safety. Over 100 retail stores at this mall were impacted. As phased re-openings resume, individual owners of stores located in this mall need to decide when it makes sense to re-open their retail operations. Just because the mall doors are open doesn’t mean customers are walking through them. Many retailers have thousands of stores in malls just like this one, and determining which stores to reopen first is a considerable challenge.
Step 1: Identify the relevant grid tiles
.png)
Movement data covers the entirety of the US with people and vehicle activity aggregated into a grid of squares (“tiles”) of approximately 100m in size. To look up the tile for a specific location, you can use this tile explorer. The first step is to identify which of these zoom-level 18 (z18) grid tiles overlap with the location of interest. A variety of tools can be used to do this spatial joining, including the Mapbox-powered kepler.gl open-source visualization tool and the mercantile geospatial library.
Step 2: Establish a baseline activity pattern
Using the list of relevant z18 tiles, we can query the daily Movement data set to determine historical activity levels at the Green Hills mall in January of 2020, as well as the period during which the mall was closed due to COVID safety concerns. Similarly, we can use this data to understand how mobility levels have changed during the re-opening phases.
Most retail activity follows a weekday/weekend periodic pattern (peak activity during the weekend and off-peak dips during the work week). A seven-day moving average can smooth out these natural spikes to present a more clear analysis. Additional recommendations for averaging and comparing daily Movement data are shared in our Movement documentation. From the chart below, after smoothing the day-of-week variation, it's easy to see that the Green Hills mall has roughly half the level of activity during the re-opening phase as compared to the pre-COVID baseline period.

As a retail owner with store space in the Green Hills mall, it may not make financial sense to re-open a store until the re-opening activity is closer to the pre-COVID baseline. On the other hand, re-opening activity may never return to pre-COVID levels due to lasting economic impact, population shift, and changes in consumer habits -- relocating to a new neighborhood may be a valuable alternative. Movement data can help retail owners understand and plan for both realities.
Step 3: Expand analysis to surrounding neighborhoods
Movement data is not limited to store-specific analysis. This data set covers activity levels for every 100m tile in the US (and many more countries), expanding analysis to include the surrounding neighborhood. Movement data can “see” what’s happening outside a retail doorstep and uncover if other businesses in the area are imp similar changes in commercial activity. Explore other neighborhoods to scope out potential new retail spots in areas where activity levels are on the rise.


Step 4: Integrate with Mapbox Boundaries
Movement data is available pre-aggregated to US county polygons and can be joined with any of the 5 million administrative, local, and statistical boundary polygons available in our global Boundaries database. Using this county-based Activity Index, simply join the data with demographics, population, or other external socioeconomic data sets that are also available per county. For example, we can query the daily Movement data set to determine historical activity levels in the broader Nashville metro area of Davidson County, Tennessee.

By understanding the Movement patterns across the Green Hills Mall, the surrounding neighborhood, and the greater Davidson county region, we can observe macro trends and derive predictive insights. In this case, we observe a bump in activity levels in the surrounding neighborhood and county preceding the re-opening of the mall, a potential early indicator that can be used to forecast future commercial demand.

Step 5: Analyze trade areas
The “trade area” for a retail location indicates the geographic region from which customers may travel to visit a business. Understanding Movement levels in trade areas is equally as important as understanding Movement levels around the immediate business because it reflects the activity of the potential customer base.
Mapbox Isochrone API can generate detailed polygons representing trade areas for the Green Hills mall -- geographic areas within 5min, 10min, and 20min driving distance in this example. These polygons can be joined with Movement data to measure activity patterns of the potential customer base. Build trade area polygons based on driving, walking, or cycling modes of transportation to understand all types of potential customers.

More stores, more insights
In this blog post we’ve explored a single mall location and shared a methodology for retail owners to measure and respond to a rapidly changing world using dynamic Movement data. This same data set can be used to analyze countless other retail locations.
All Mapbox users can download 8 months of daily Movement data from January to August 2020 at no cost. Download Movement data today and check out the Movement FAQ and documentation to get started.


Related articles
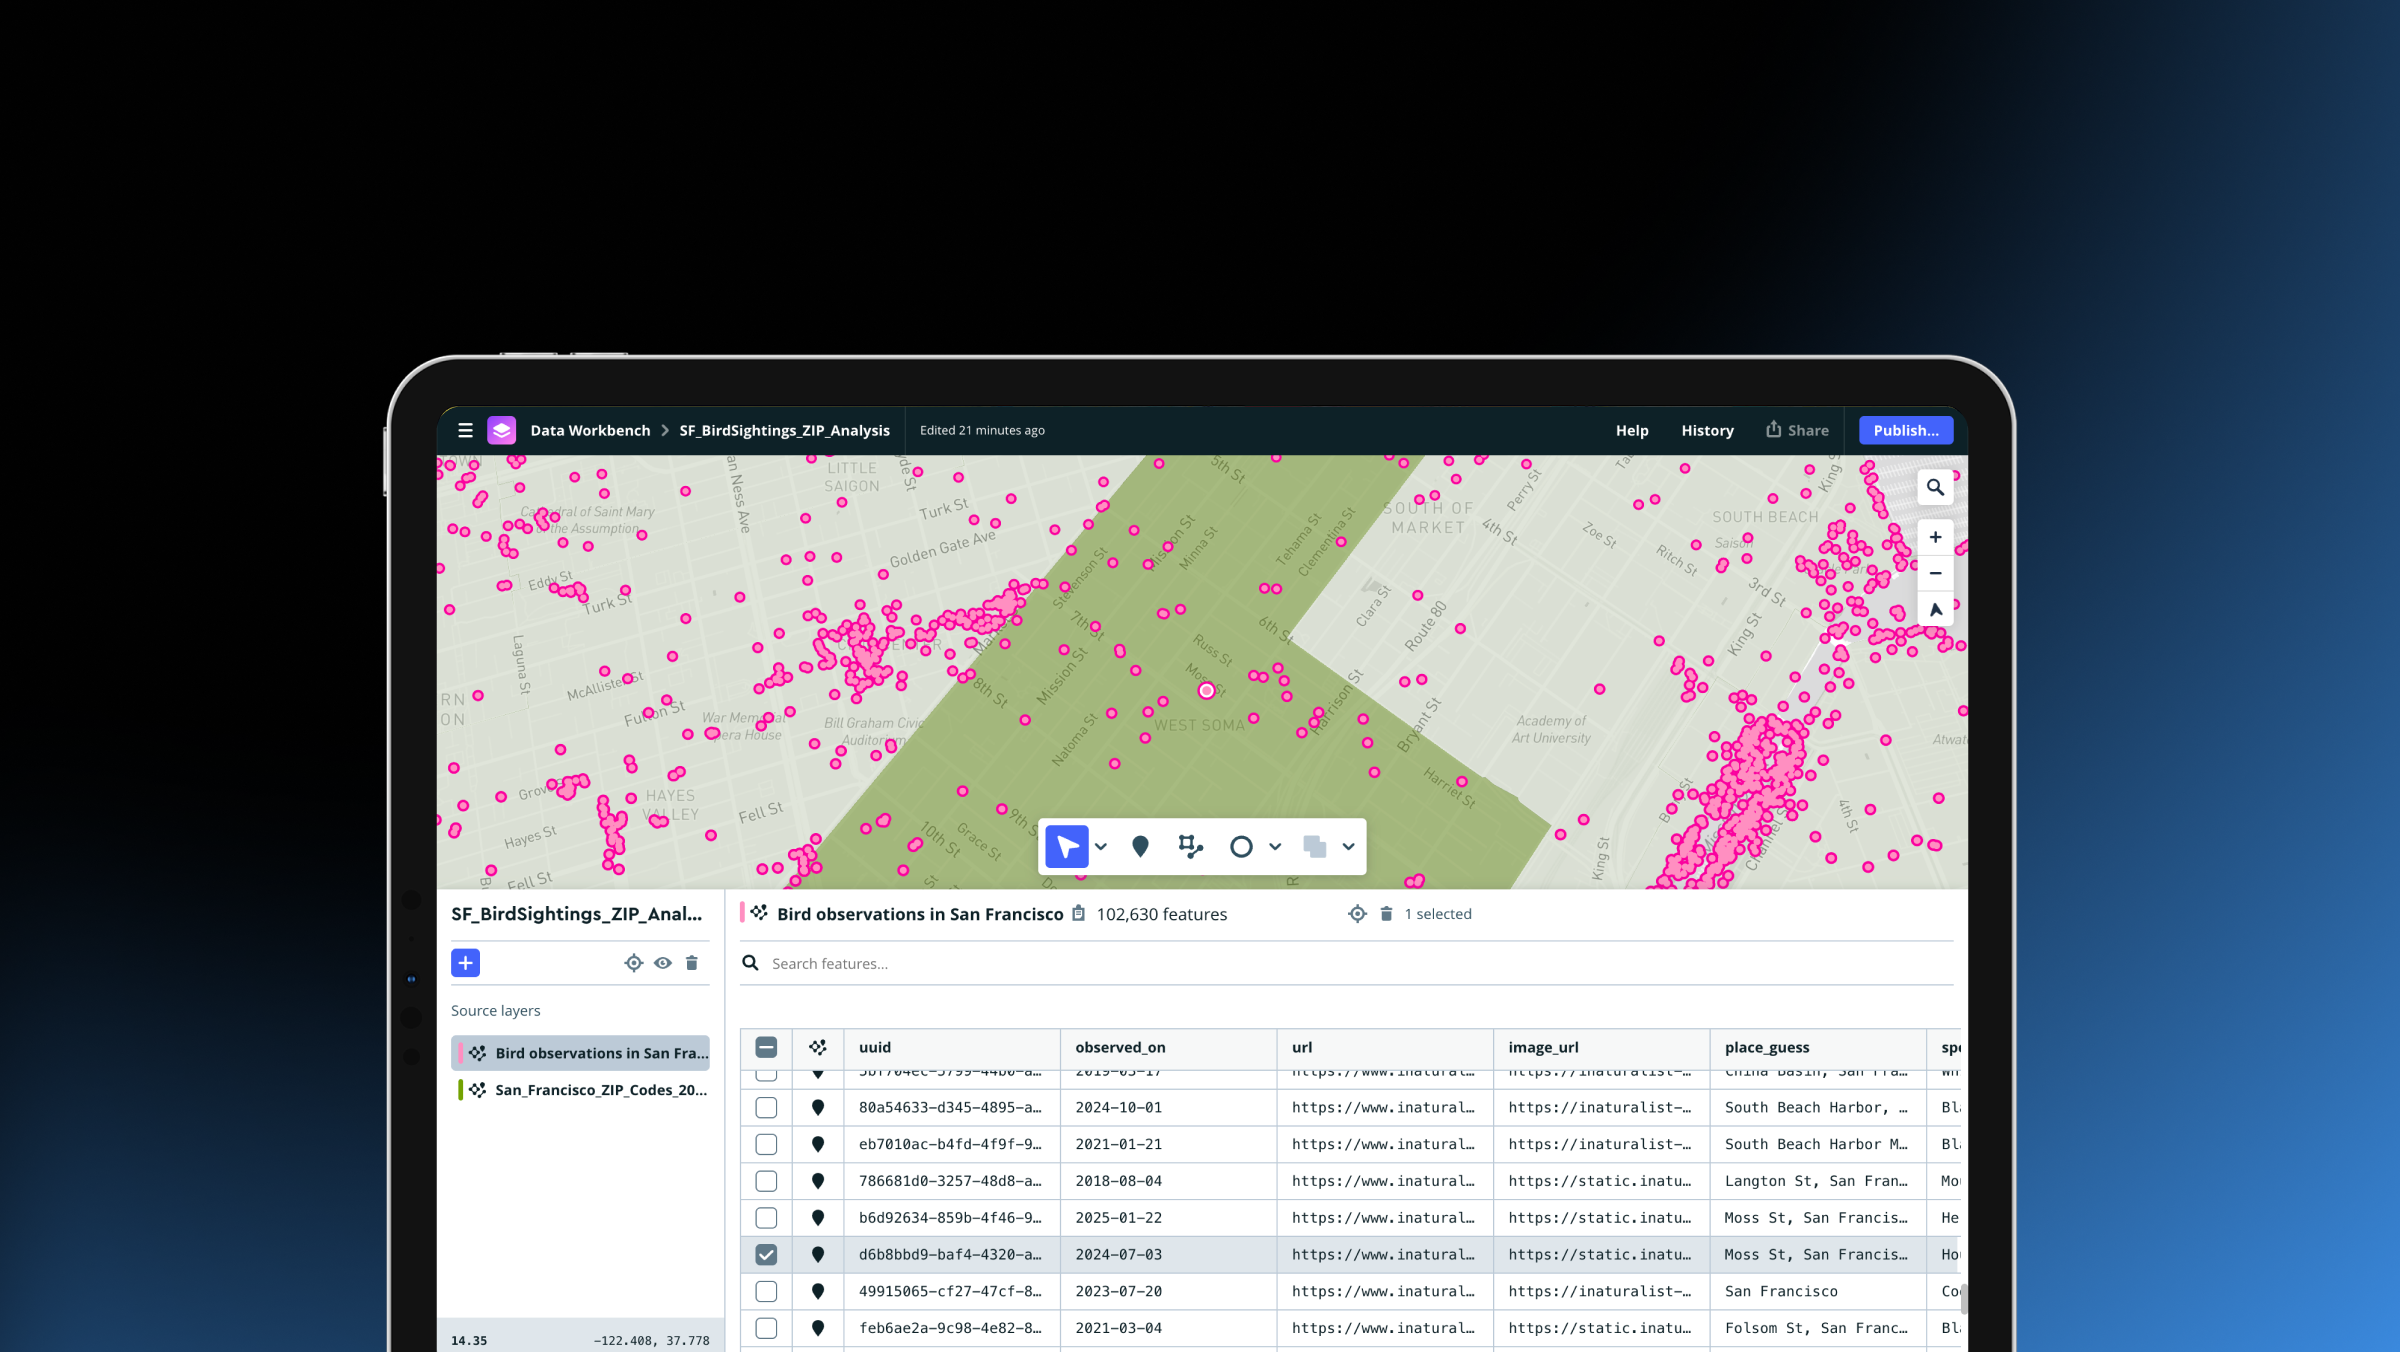
Drag, drop, edit, publish: A simplified workflow for custom data
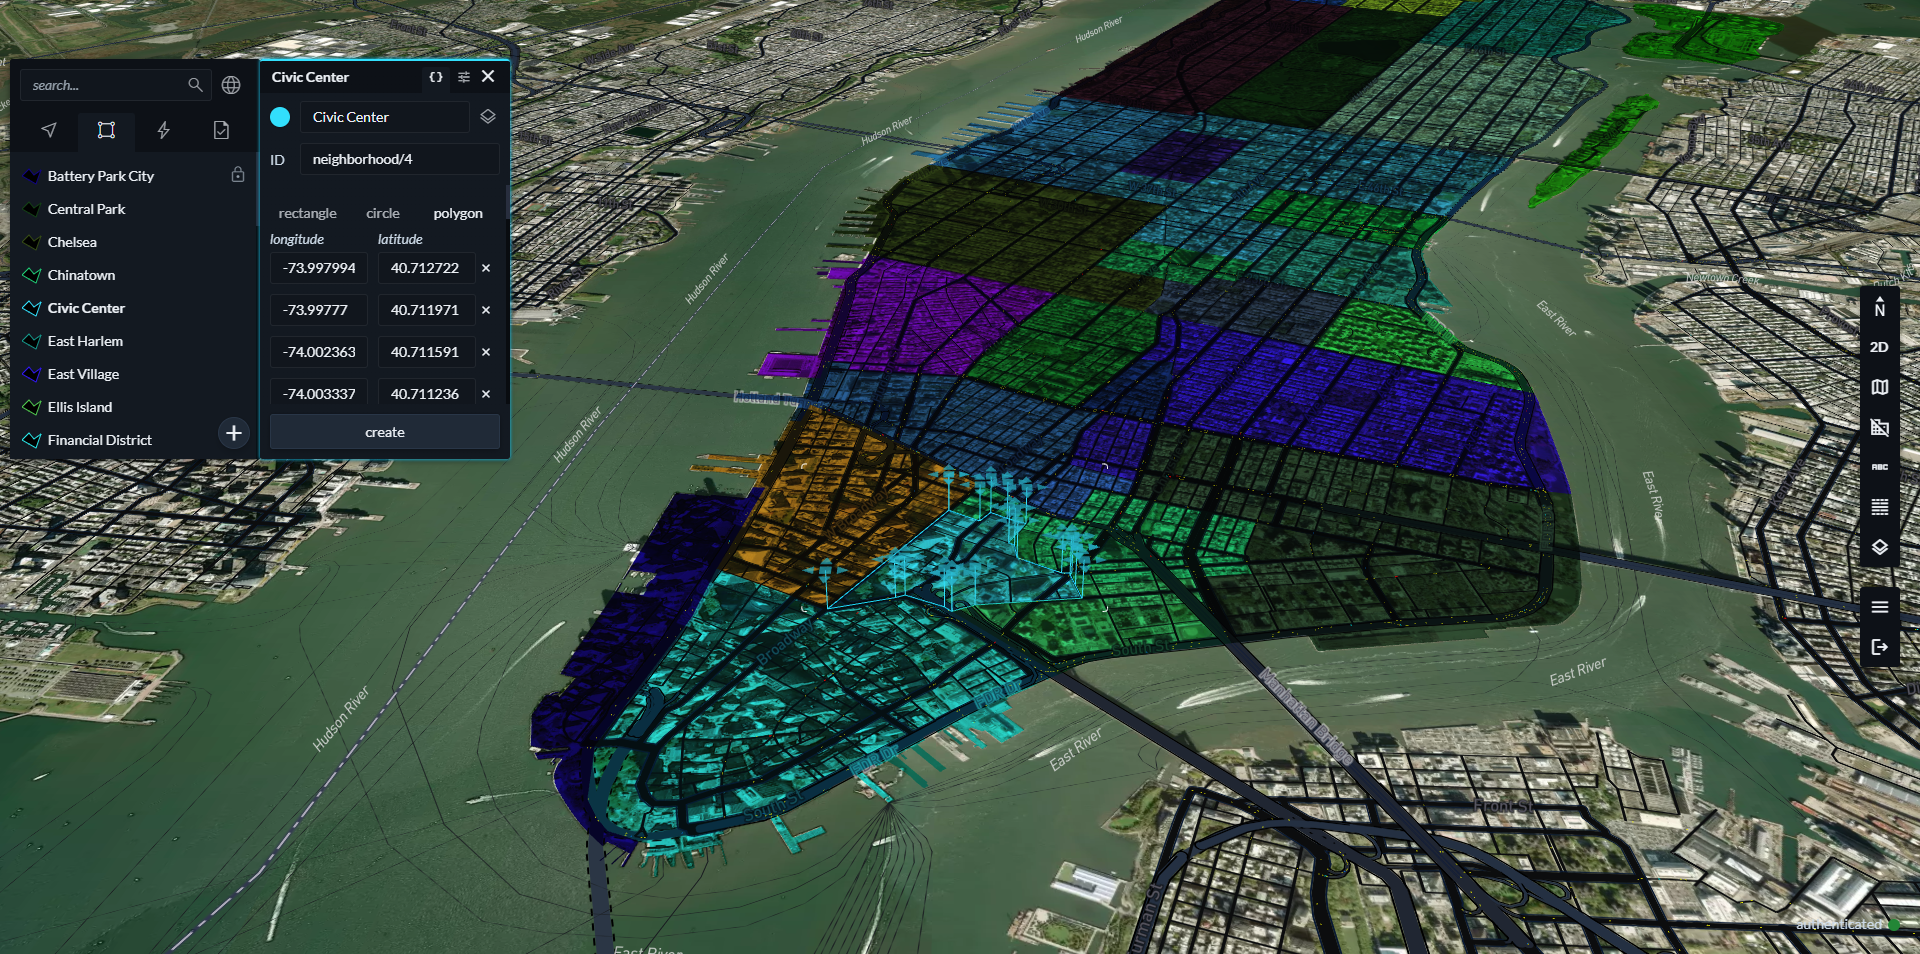
Mission-ready mapping: Securely bring together maps, AI, and response