
The Mapbox team including Greg Banecker (Maps Product Marketing Manager), Mira Ala-Kantti (Senior Maps Product Manager), and Aleksandr Shoronov (Software Developer) recently hosted an engaging webinar that explored a simple yet powerful concept: pin-powered maps. The session walked attendees through how interactive map pins can move beyond just points, becoming the heart of visual storytelling and business insight. View the webinar recording here.
In this recap, learn about the four main themes from the session:
- Defining pin-powered maps
- How great pin-powered maps drive business impact
- What you can build with Mapbox to bring maps to life
- A walkthrough of the live pin-powered map developer demo
By the end, you’ll see how map pins can connect design, data, and user experience to make maps that not only look good but work hard for your business.
What are pin-powered maps?
At their core, pin-powered maps use icons, often referred to as “pins”, to represent real-world data on a map. These are more than the familiar dots one might see on a typical location map. Pin-powered maps make each pin interactive, meaningful, and connected to the story or data behind it.
For example, instead of showing 500 static dots representing store locations, a developer could design each pin to reflect live inventory, delivery status, or product category. The pins become data points users can interact with, filter, or click to learn more. This became evident when the team highlighted how Mapbox enabled Tripadvisor to build the best map for travelers, increasing user engagement by 70% and bookings by 3.5%.

The power of great pin-powered maps
When done right, pin-powered maps can change how people understand data and make decisions. The team emphasized that the quality of the pins and their interaction design directly influences the map’s usefulness and impact.
They turn maps into storytelling tools
Great pins make the invisible visible. Whether it’s delivery coverage areas, electric vehicle charging stations, or tourism attractions, interactive pins help users connect the dots — literally — between data and experience. They turn complex datasets into clear visuals that tell a story anyone can follow.
They drive measurable business outcomes
One of the strongest messages from the webinar was that great map design translates into business value.
- For retailers, pin-powered maps make it easy for customers to find stores, check stock availability, and plan visits.
- For logistics companies, they help track vehicles, optimize routes, and visualize delivery performance in real time.
- For developers, they offer a way to bring interactive, visually rich data experiences to life with speed and flexibility.
Well-designed map pins can help users stay engaged longer, reduce bounce rates on location pages, and increase conversions, whether that means completing a delivery, booking a service, or visiting a store.
They make data feel human
The team highlighted that the best pin-powered maps go beyond utility. They’re visually appealing, brand-aligned, and emotionally engaging. A customized icon can reflect brand identity, add personality, and make users feel connected to the experience.
Instead of overwhelming people with dense data, pin-powered maps create a sense of discovery. Each pin becomes an invitation to explore, not just a static marker.
Building pin-powered maps with Mapbox
Mapbox provides developers and designers with a flexible platform to build highly customized maps and pins. The webinar showcased several tools and features that make this possible.
Custom icons and styling
With Mapbox Studio, you can design custom map styles and upload your own icons or shapes to represent pins. These can match your brand colors, reflect categories (like restaurants vs. retail), or show status updates dynamically.
Developers can control size, color, and interactivity programmatically using the Mapbox GL JS library or Mobile SDKs for iOS and Android. For example:
- Pins can animate when clicked
- Colors can change based on data values
- Tooltips can reveal live information like store hours or customer ratings

This level of flexibility means you’re not limited to the traditional map aesthetic — your map can look and feel uniquely yours.
Interactive layers and data integration
Pin-powered maps shine when they’re connected to live data. Mapbox makes it simple to integrate APIs, data feeds, and analytics layers so pins reflect what’s happening in real time.
Think of a ride-hailing app: pins can represent pickup and dropoff locations.Or a real estate site: pins can show homes for sale, and filters let users instantly update what they see based on price or neighborhood.
With Mapbox Tiling Service (MTS) and Mapbox GL JS, developers can manage thousands of data points efficiently, keeping maps fast and responsive even with large datasets.
Cross-platform consistency
Mapbox supports web, iOS, Android, and even in-car systems. That means builders can create one consistent pin-powered experience across devices, from mobile phones to dashboard navigation systems.
For teams building products across multiple platforms, this consistency ensures users always get the same intuitive, high-quality experience, no matter where they access the map.
The developer demo
The live demo was a highlight of the webinar, showing how quick and intuitive it is to build interactive, data-driven maps with Mapbox.
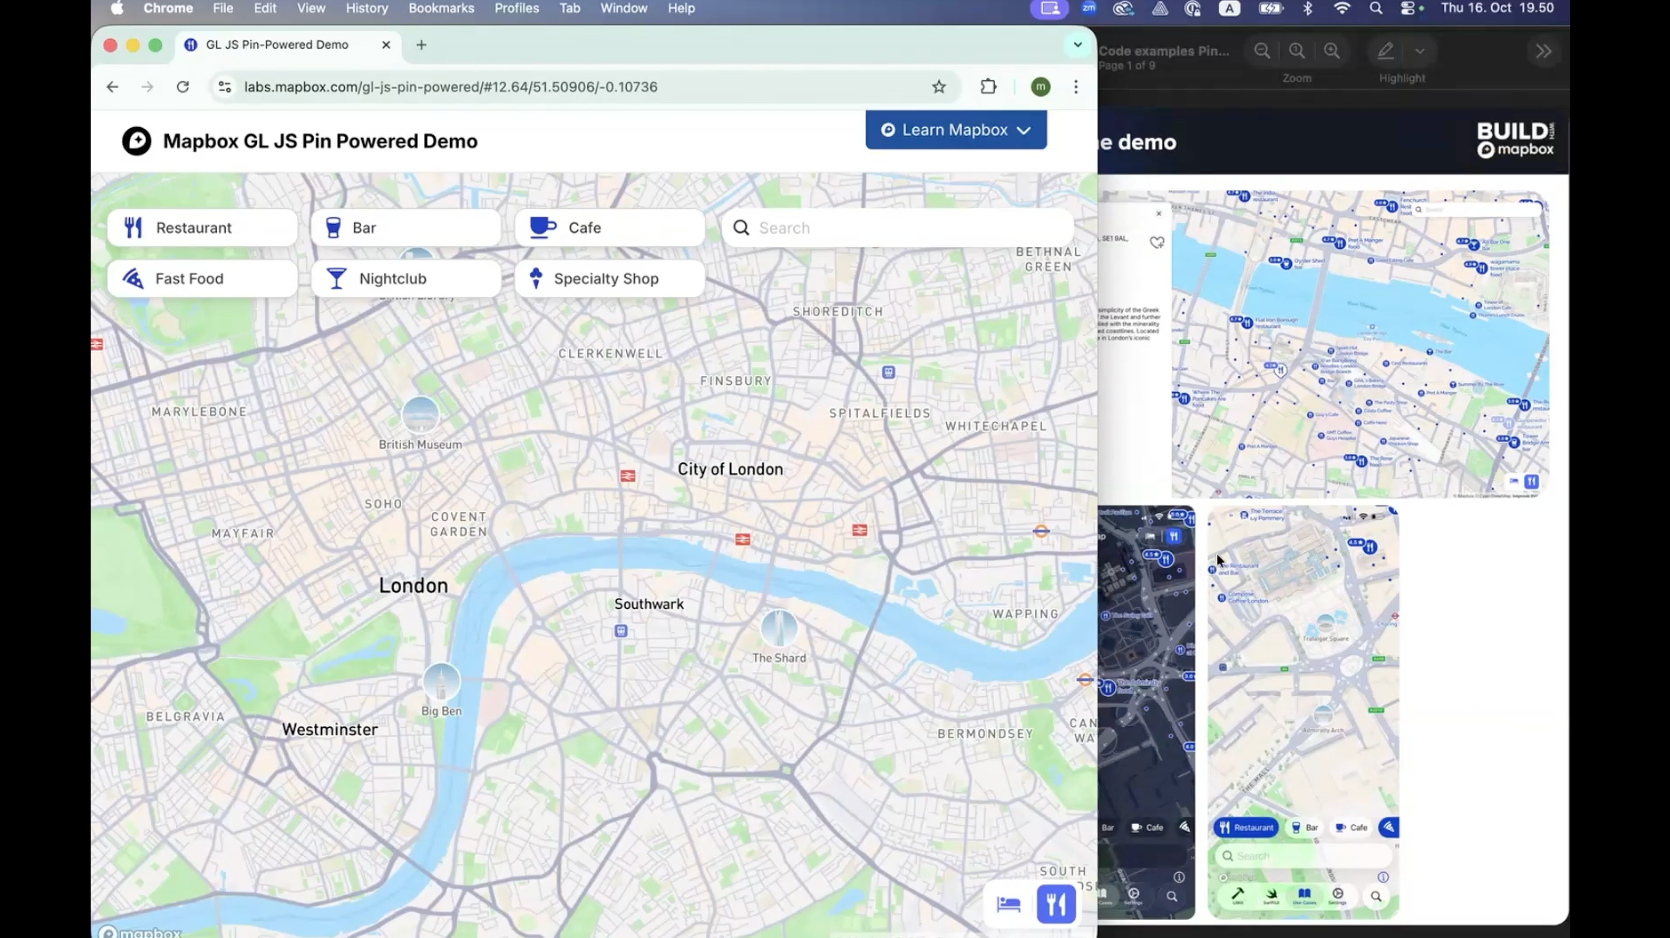
In just a few lines of JavaScript, Mira created a custom-styled map, added pins using GeoJSON data, and linked each pin to an information pop-up. She demonstrated how developers can control everything, from hover effects to animations, directly in code.
What made the demo stand out was its practicality. Rather than showcasing something overly complex, it focused on building a map that any developer could recreate and customize in minutes.
The key takeaway: Mapbox products allow you to go from static maps to fully interactive experiences fast. Developers can build, test, and scale your map designs without heavy overhead or deep GIS expertise.
How to get started
The presenters wrapped up by emphasizing how easy it is to start building with Mapbox.
Developers can explore the Mapbox documentation and tutorials, experiment with pre-built map styles, and use the Mapbox Studio interface to customize pins visually before integrating them into production.
For teams already using Mapbox APIs, expanding into pin-powered maps often means just adding new layers or data connections, not starting from scratch.
Pin-powered maps are changing how businesses think about mapping. Instead of static backgrounds, maps can now tell stories, show live data, and connect users to meaningful actions. With Mapbox, teams can combine design flexibility, developer tools, and data integration to create experiences that are both beautiful and practical. Whether you’re helping customers find a store, tracking assets in real time, or visualizing analytics, pin-powered maps turn icons into business impact.
Frequently asked questions
1. What makes a map “pin-powered”?
A map is pin-powered when it uses data-driven, interactive icons (pins) to show information directly on the map. Each pin can represent live or static data, respond to user interactions, and provide additional details when clicked.
2. Do I need to be a developer to build a pin-powered map?
Not necessarily. Designers can use Mapbox Studio to style maps and upload icons, while developers can add interactivity using Mapbox GL JS or SDKs. Many teams collaborate across both roles to create polished, interactive results.
3. Can I use my own brand icons instead of default pins?
Yes. Mapbox lets you upload custom icons and adjust color, size, and behavior to match your brand and use case.
4. How do pin-powered maps help businesses?
They make complex information easier to understand, help customers find what they need faster, and turn maps into interactive engagement tools that support conversions, sales, and decision-making.
5. Is performance affected by having many pins on one map?
Mapbox is optimized for large datasets. Using vector tiles and efficient rendering, you can show thousands of pins without slowing down performance, even on mobile devices.


Related articles
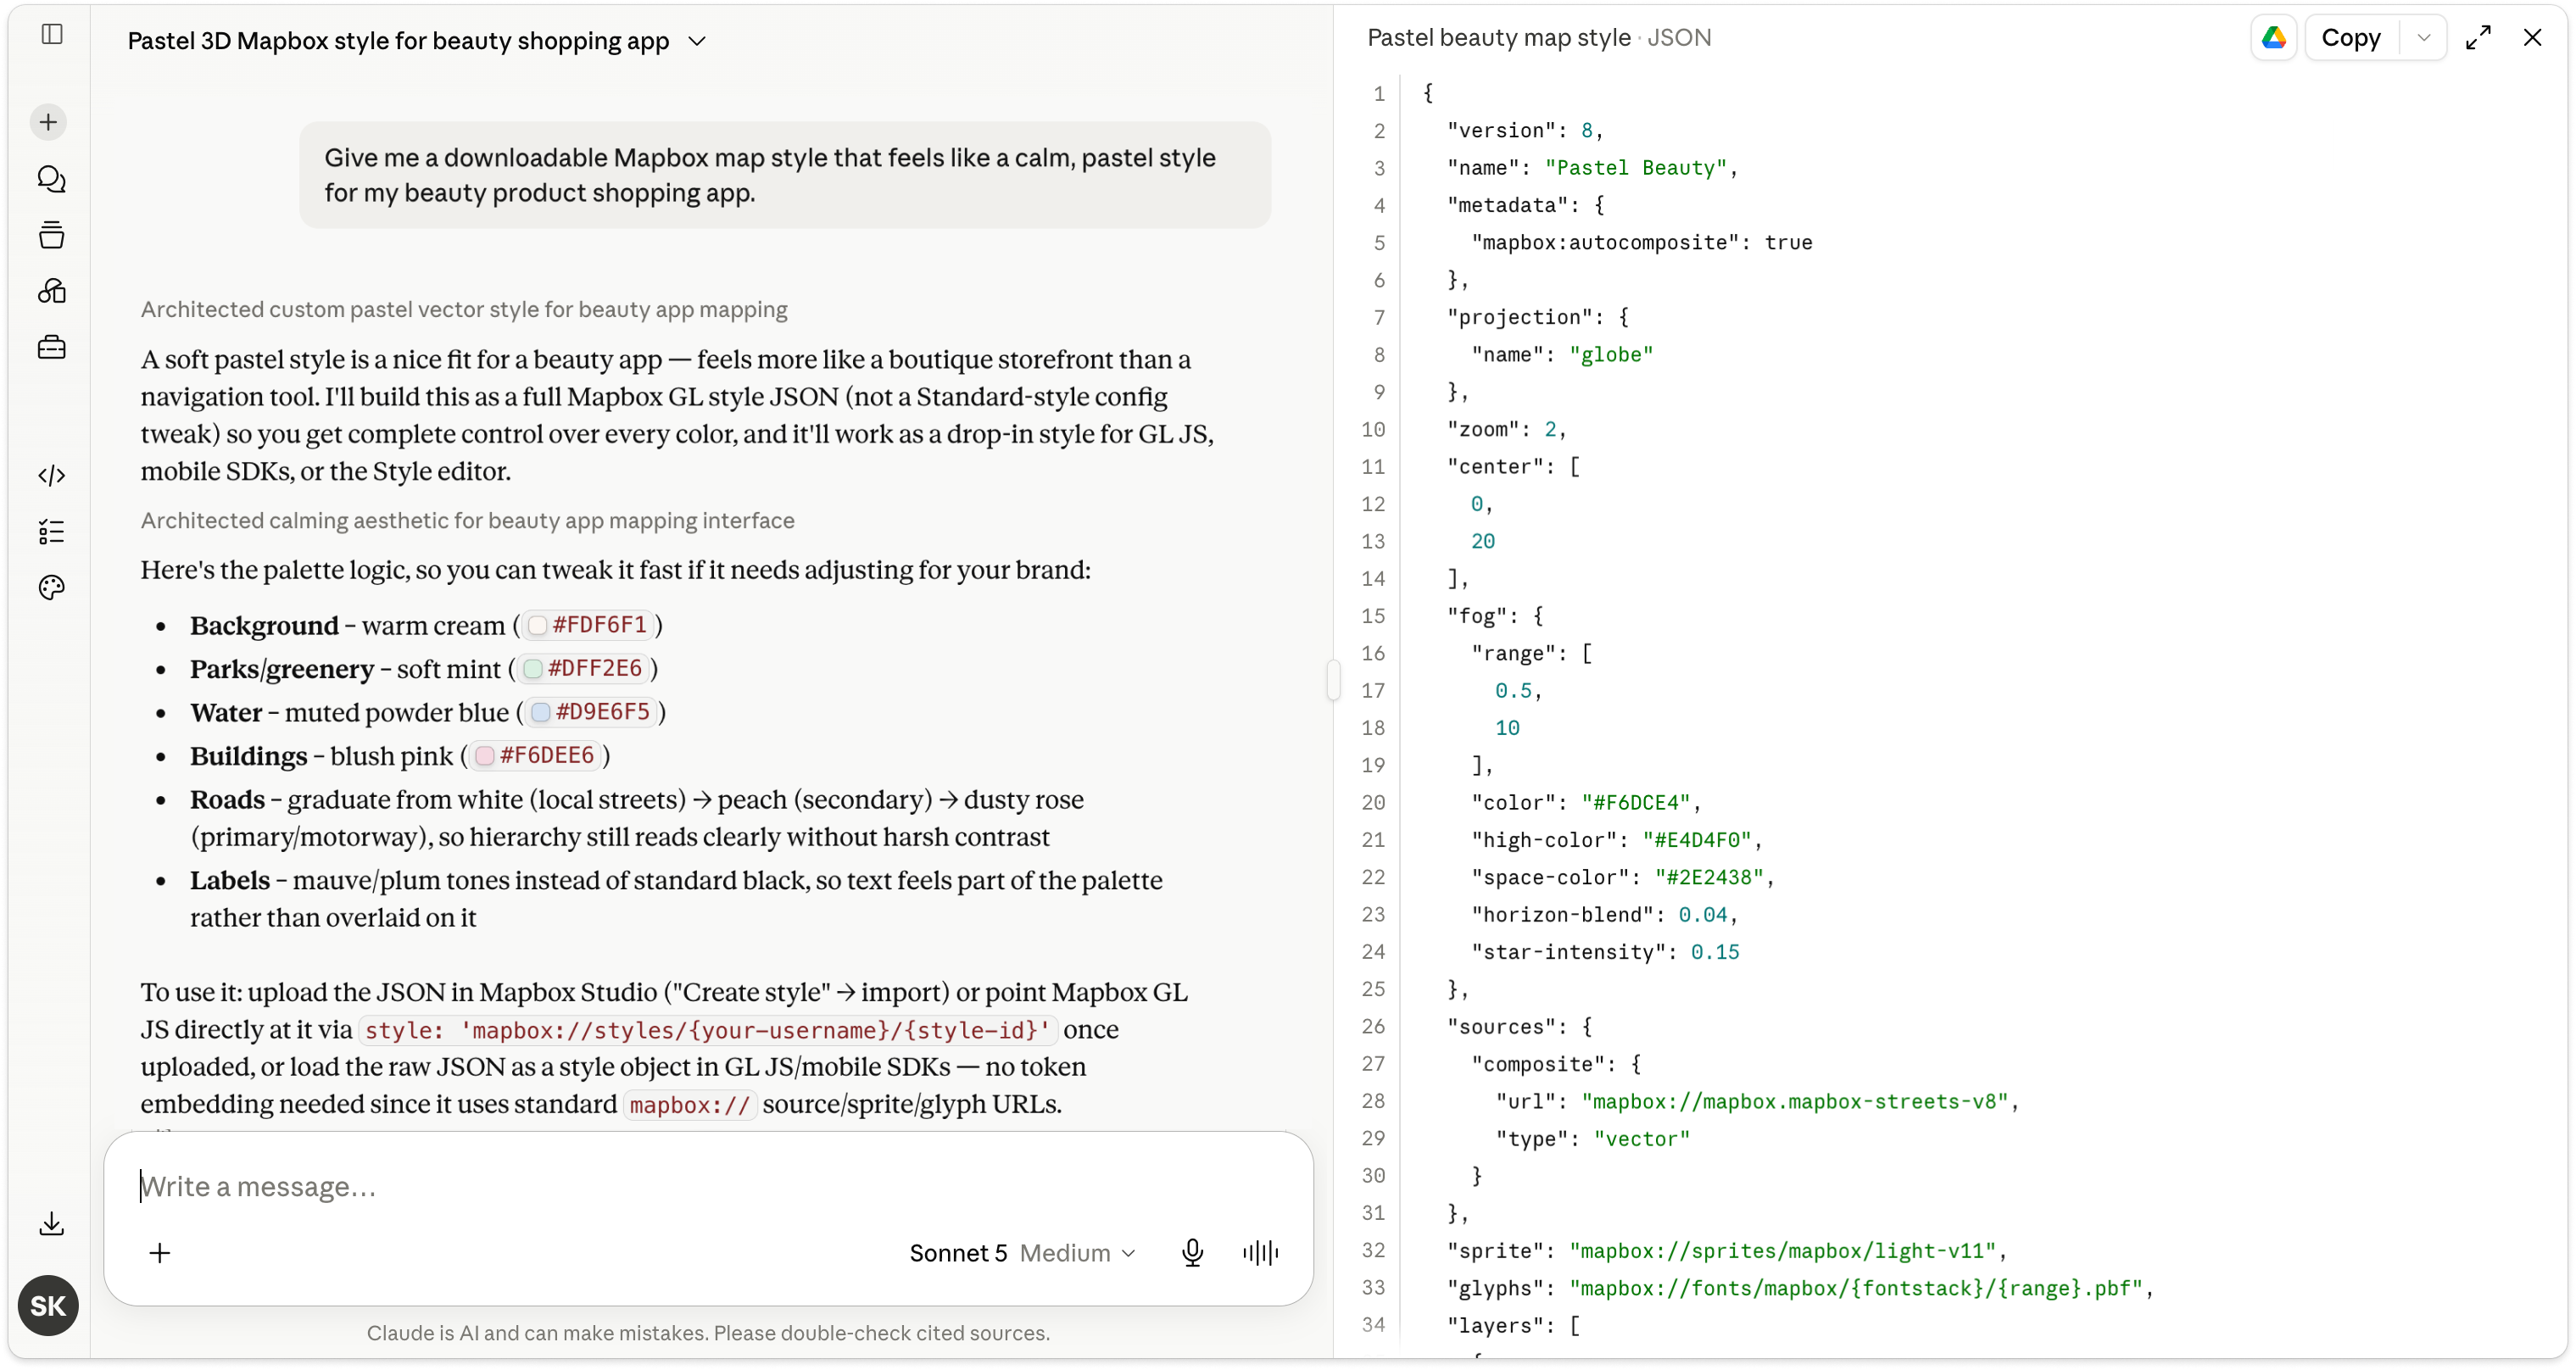
Turn AI-generated map styles into production-ready maps in minutes with Mapbox Studio
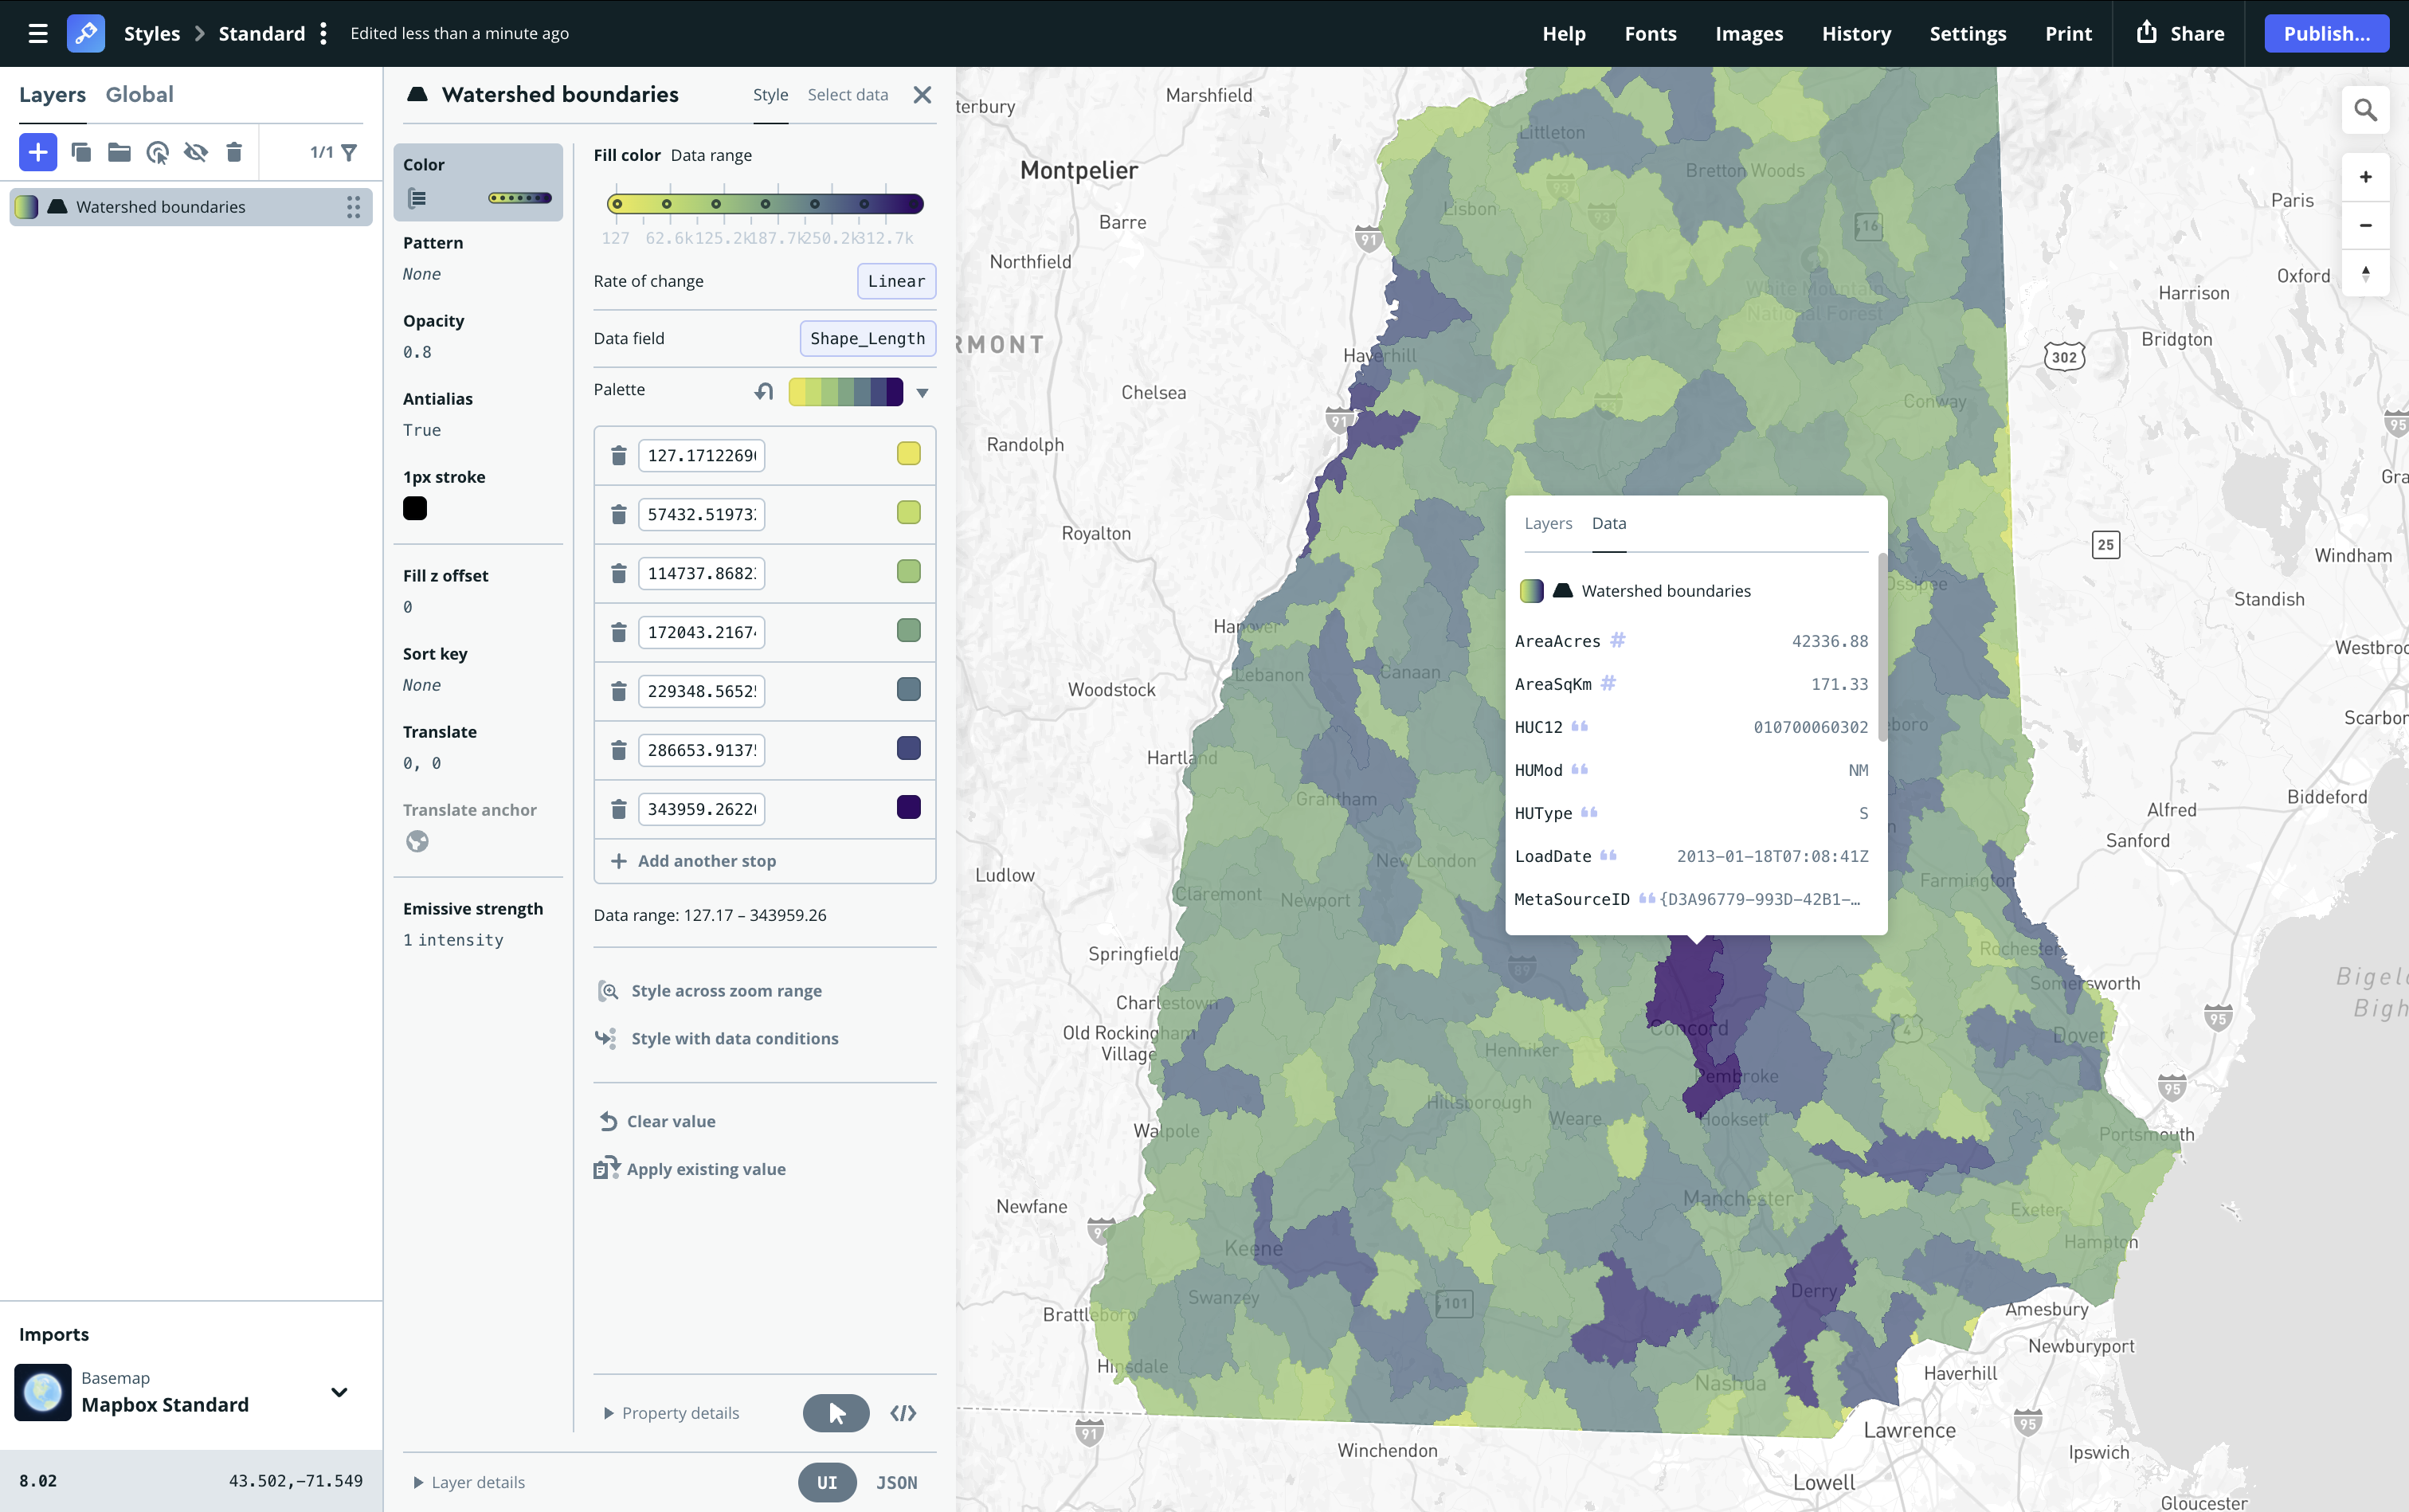
From upload to styled data layers in seconds: Smarter styling defaults in Mapbox Studio
