Tiling data from the Census using MTS: How we built it
The US Census provides enumeration units, along with thousands of attributes of data describing current and historical demographics, used in maps from business analytics dashboards to stories about elections like the ones built by the Center for American Progress to show voter suppression in Harris County Texas.
Census datasets are extremely large as just raw geojson, but can be super performant when tiled using MTS (Mapbox Tiling Service). Below are notes on how to prepare census data for tiling using the MTS data sync command line tool, including how to choose appropriate minimum and maximum tiling levels and how to aggregate data at different zoom levels.
.png)
MTS
The MTS (Mapbox Tiling Service) `data sync beta tool` creates scalable vector tilesets with straightforward commands and optional configuration parameters in a `recipe file.` Recipes are as simple as defining a maximum `zoom level` or as complex as defining a union between data at different zoom levels. Explore example recipes for illustrations of various use cases.
Set up
The first step in tiling census data is to prepare the data file and set up a command environment.
- Download the Texas census tracts data: https://www2.census.gov/geo/tiger/TIGER2019/TRACT/tl_2019_48_tract.zip
- Convert the census tract shapefile to geojson using QGIS or ogr2ogr. If there are alignment issues later, be sure to use a conversion method that converts projected coordinates to latitude and longitude such as gdal or QGIS
- If gdal is installed, run this command in terminal from the data directory: `ogr2ogr tx-tracts.geojson tl_2019_48_tract.shp`
- Install MTS Data Sync and add a Mapbox token
- From the data directory run the command `mtsds --configure tx-tracts.geojson`, this will generate a config file, a recipe template, and convert the data into line-delimited geojson
- Open the mts-recipe.json in a text editor such as VS Code to begin editing the recipe (see below).
- Run `mtsds sync` to tile the data
Minimum and maximum zoom:
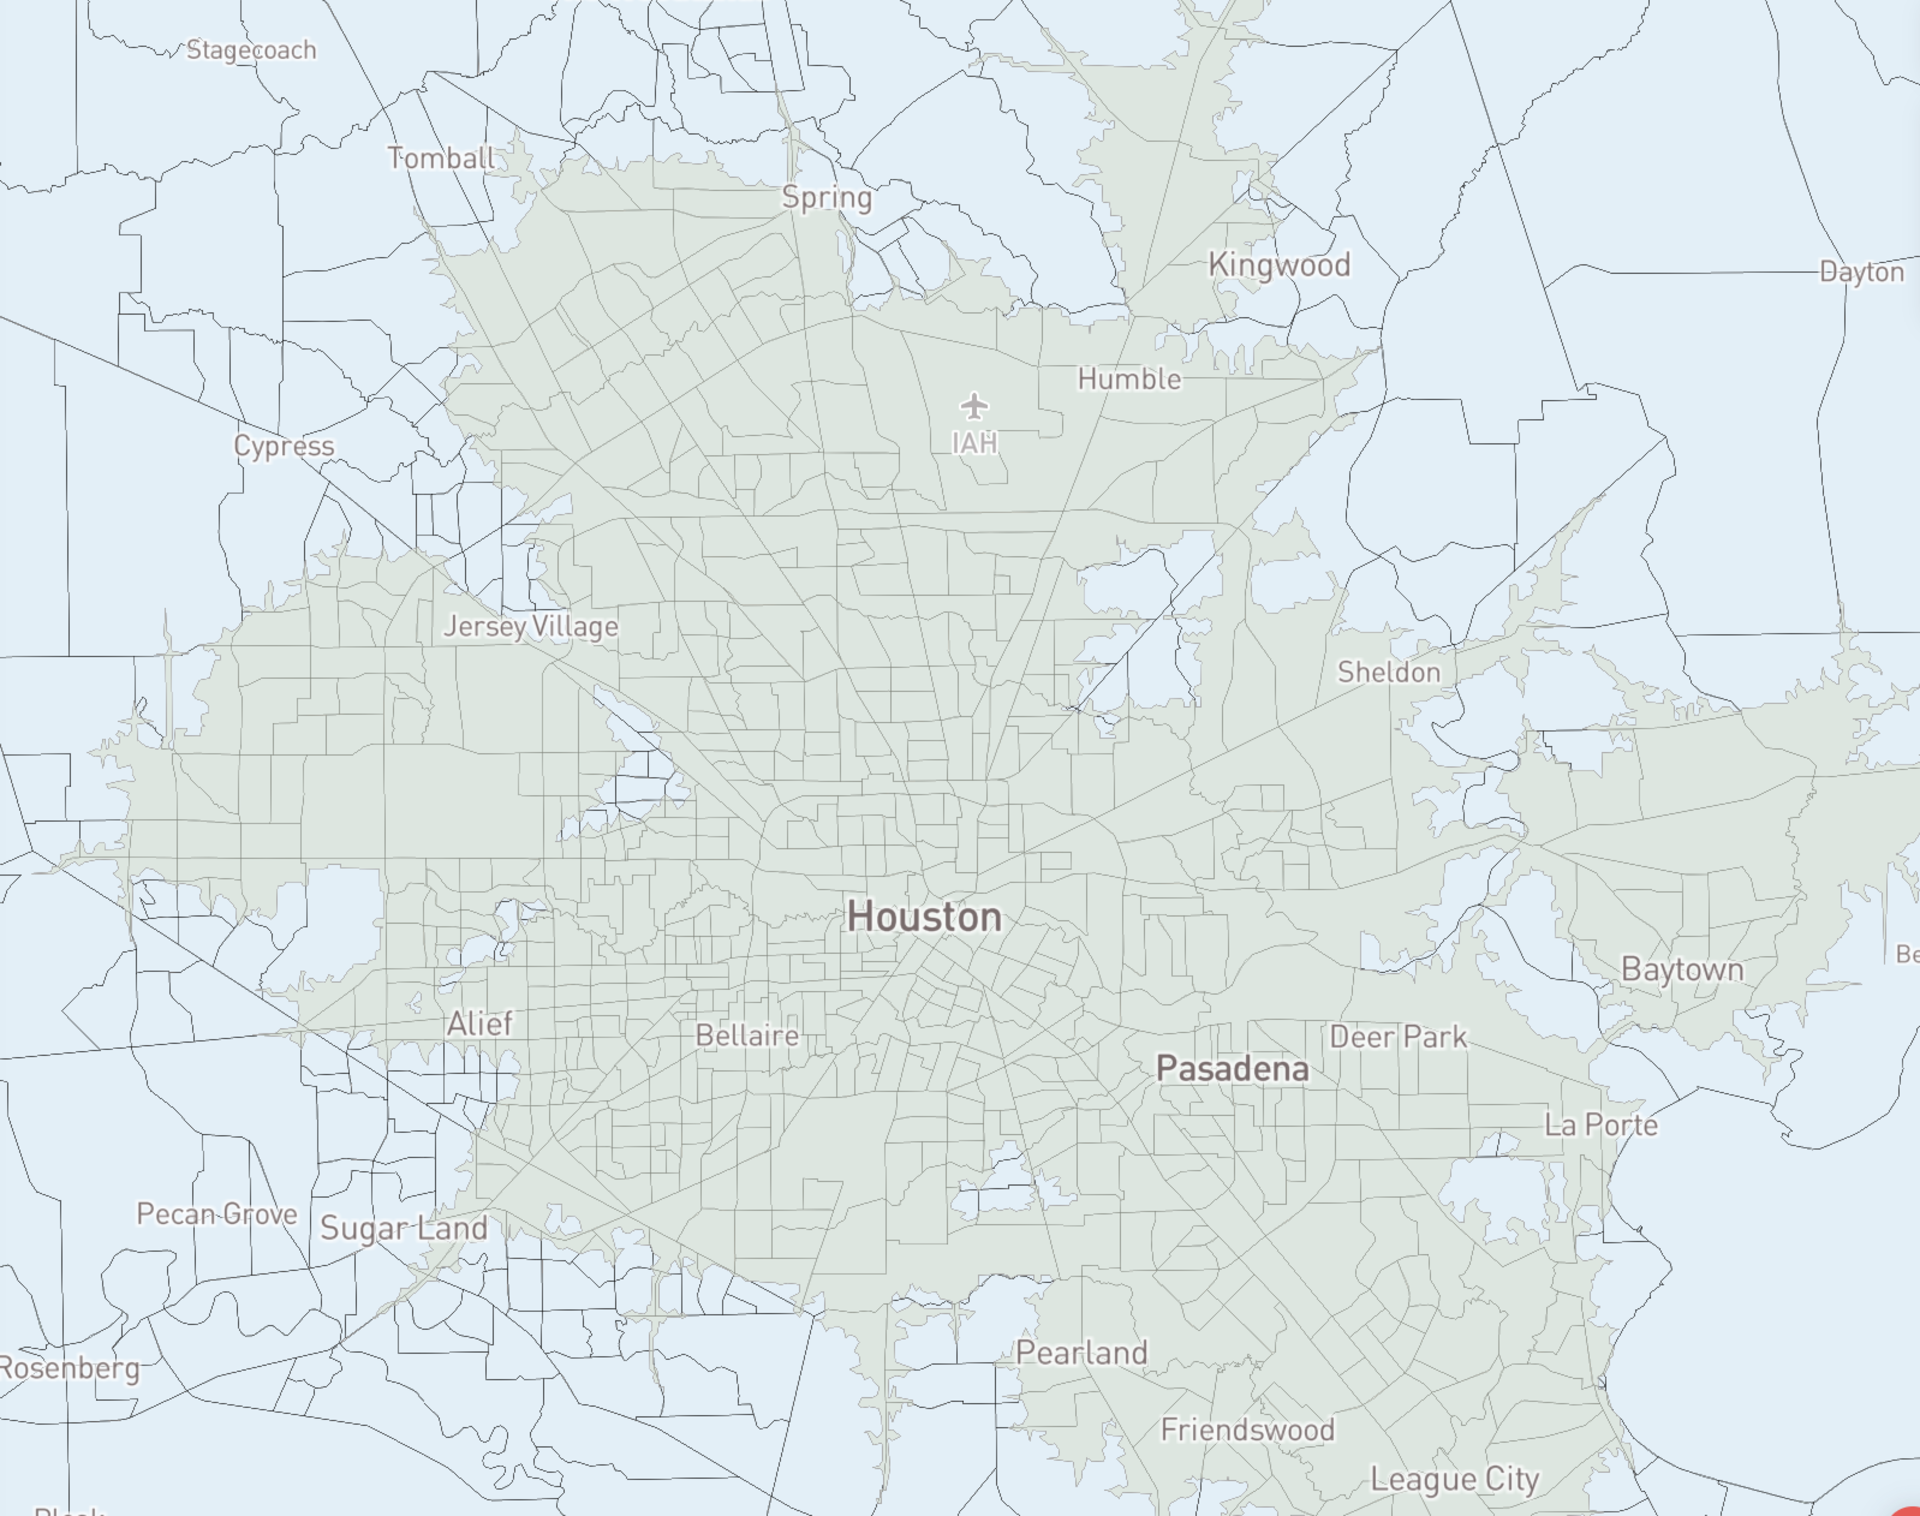
When displaying highly detailed geometries on a map it is important to plan for zoom levels. By default, mtsds will create a recipe with a max zoom of 5 (~122 sq km per tile), with the geometries simplified to make them look good at that zoom, but no further. In the case of census tracts, the default simplification means as the map zooms in beyond the max zoom 5, geometries will be oversimplified and appear disjointed.
For a map where users will be zooming in to the level of a neighborhood or street, for example to find a ballot dropbox location, a max zoom of 11 will be more appropriate. See the MTS documentation for an overview of which scale or zoom levels are best for common use cases.
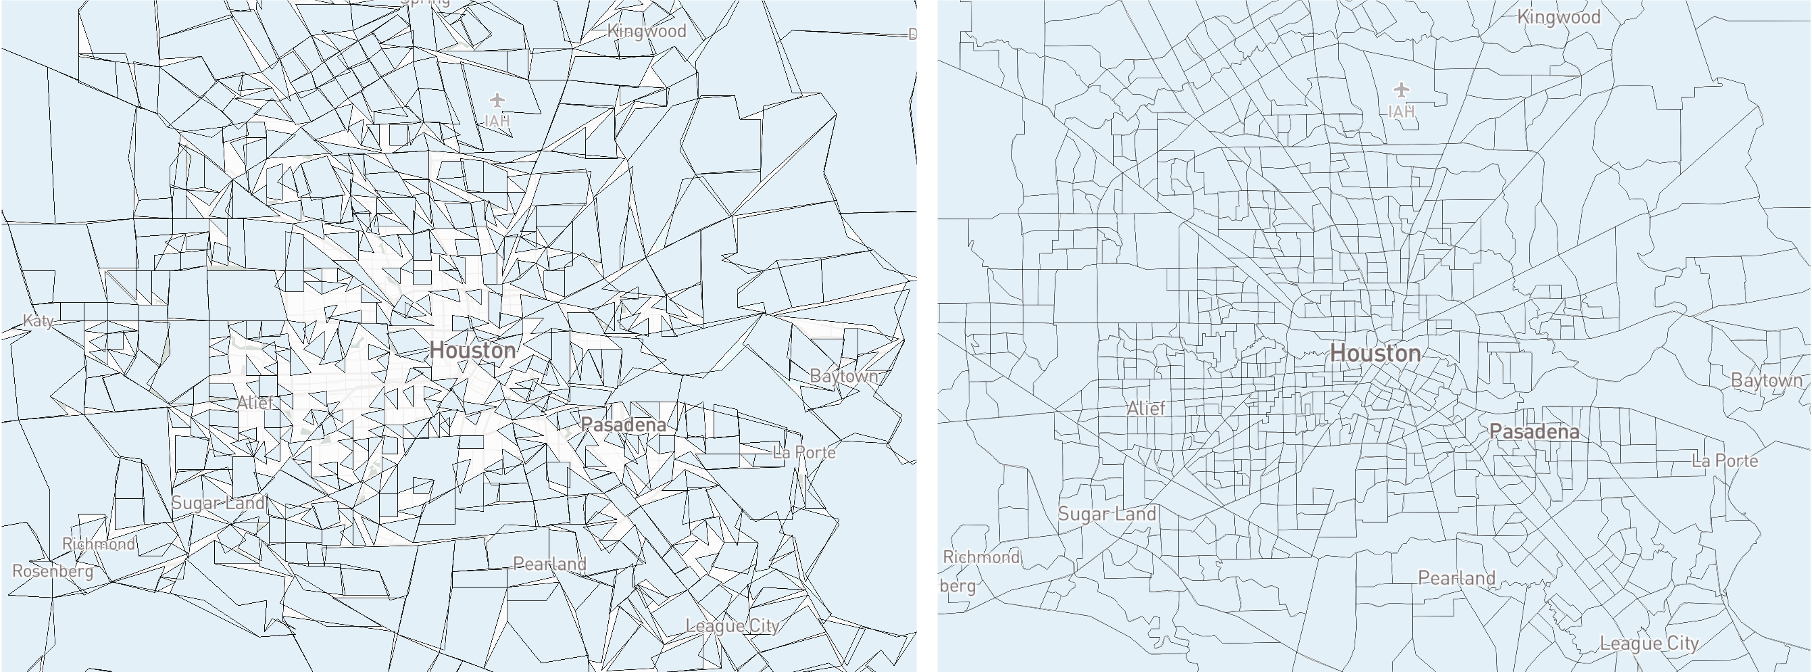
When the map first loads it is zoomed out and the geometries are too detailed and look crowded. Tile size limits may also result in features being dropped at lower zoom levels.
To work around this limit there are a few options: remove attributes, limit the minimum zoom, or automatically union the geometry at lower zoom levels. The simplest is to limit the minimum zoom, here is an example recipe that will only show the tracts once the map zooms higher than z8:
{
    "version": 1,
    "layers": {
        "tx-tracts-z5": {
            "source": "mapbox://tileset-source/username/tx-tracts-src",
            "minzoom": 8,
            "maxzoom": 11
        }
    }
}
Aggregate data across zoom levels:
To allow the map to also zoom out further to show summary statistics, it is possible to generalize the data by county by adding in another layer with aggregated data. Or, within the same tileset recipe MTS can automagically union the census tracts using the County FIPS codes that are already in the data attributes.
The final recipe
{
    "version": 1,
    "layers": {
        "tx-tracts": {
            "source": "mapbox://tileset-source/username/tx-tracts-src",
            "minzoom": 0,
            "maxzoom": 5,
            "features": {
                "simplification": {
                    "outward_only": true,
                    "distance": 1
                },
                "attributes": {
                    "set": {
                        "key": [
                            "concat",
                            ["case", [">=", ["zoom"], 0], ["get", "STATEFP"], ""],
                            ["case", [">=", ["zoom"], 5], ["get", "COUNTYFP"], ""],
                            ["case", [">=", ["zoom"], 8], ["get", "TRACTCE"], ""]
                        ]
                    }
                }
            },
            "tiles": {
                "union": [
                    {
                        "group_by": ["key"],
                        "aggregate": {
                            "ALAND10": "sum"
                        },
                        "simplification": {
                            "distance": 4,
                            "outward_only": false
                        }
                    }
                ]
            }
        }
    }
}
Explore an interactive version of the map made using this recipe.
To learn more about advanced techniques like `group_by` and `union`, and how to use them to display block level data read the complete guide to tiling Census data with MTS.
Working with Census data for a public good app or research project? The Mapbox Community team can support - get in touch.
.png)

