Real-world insights from BUILD with Mapbox 2025
Highlights from guest speakers reveal lessons for performance, storytelling, design, and engagement.
.png)
Each year, BUILD with Mapbox brings together people who care deeply about improving how people move, explore, and understand the world. At BUILD with Mapbox 2025, guest builders shared stories that were honest, practical, and full of lessons from real work. Their sessions were not only technical talks, they were reflections about problem-solving, teamwork, and serving users who depend on their apps or public tools every single day.
This blog shares some highlights of thoughtful moments and quotes from four guest speakers. Across delivery logistics, travel planning, global diplomacy, and public elections, these talks showed how people shape products with care, purpose, and a sense of responsibility.
Delivery Hero: Taking ownership of performance
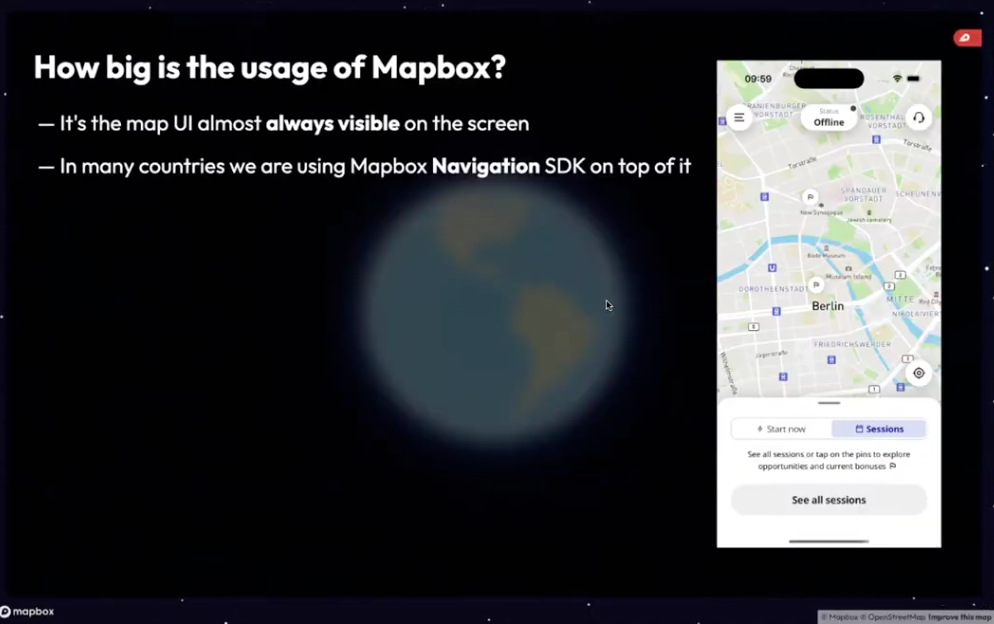
Michael Gerasymenko, Staff iOS Engineer at Delivery Hero, began his session ‘Escaping the performance Bermuda Triangle: Optimizing integrations with the Mapbox Navigation SDK’ with a simple truth: performance problems in mobile navigation apps rarely come from one place. They come from a mix of SDK behavior, app code, and the quirks of older devices or rough conditions in the field. For riders working in busy cities, those issues can slow down a shift or interrupt a delivery. Every second counts.
The challenge of the “Bermuda Triangle”
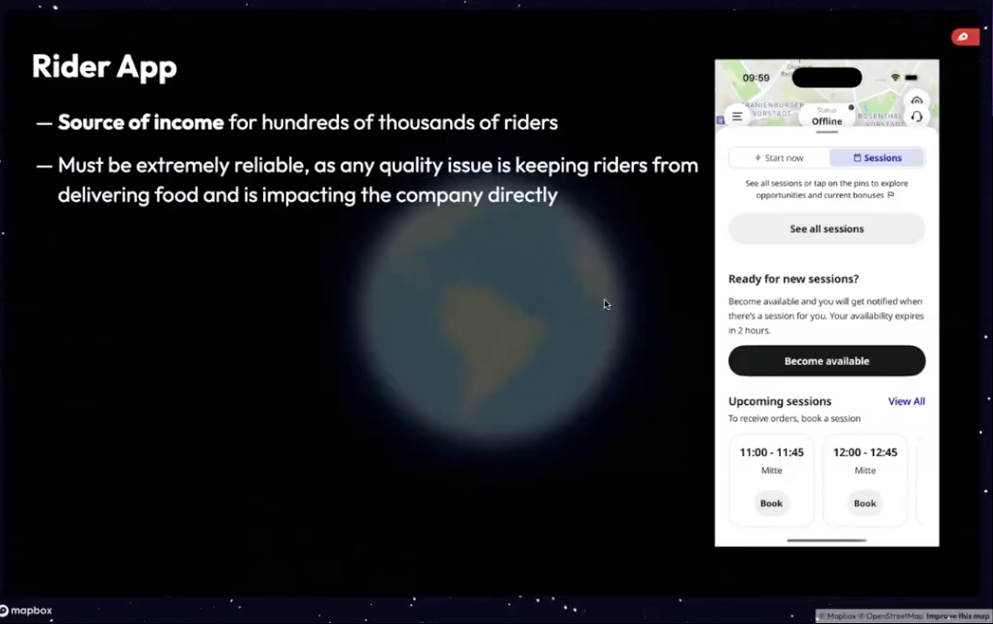
Delivery Hero supports millions of orders across many regions. Many riders use older phones, sometimes in hot weather, dense traffic, or areas with spotty connectivity. Michael explained that delivering a smooth experience in these conditions requires careful attention to every part of the navigation experience. Nothing can be taken for granted.
This is where Michael introduced his idea of the “bermuda triangle of performance.” When something goes wrong, teams often point fingers at one corner of the triangle: the SDK, the app, or the platform. But the truth, he said, is far more shared and far more human.
Owning the integration
Michael stressed the importance of taking responsibility for how an SDK is integrated, tested, profiled, and monitored. His quotes reflect a mindset that every engineering team can learn from:
SDKs are not magic bullets, and integration matters the most. Ownership matters, it’s still your app. Take responsibility of it. Truth is in collaboration, learning, and incremental and careful integration.
He reminded the audience that adding features through an SDK always adds weight to an app:
I'm yet to see an SDK that would improve the performance of an application… if you add some functionality, you're also going to lose something, and this something sometimes is a performance.
One story that stood out was how Michael discovered a spike in app “hangs” after introducing the Mapbox Navigation SDK. The cause was not obvious. After digging deeper through telemetry and profiling tools, he uncovered that issues were tied to UI appearance changes and an accumulation of map stylesheets. What looked like an SDK failure turned out to be an integration detail that required attention and patience to solve.
Working with partners, not against them
Michael encouraged teams to shift their mindset when troubleshooting performance concerns:
We should change our mindset from saying ‘it's a Mapbox problem’ to ‘how can we manage, mitigate, and improve the SDK that we're integrating in our app?’
His session reminds the audience that no SDK removes the need for careful engineering. Instead, strong partnerships, open communication, and shared ownership produce the best outcomes for users.
Viata: Designing travel that feels personal
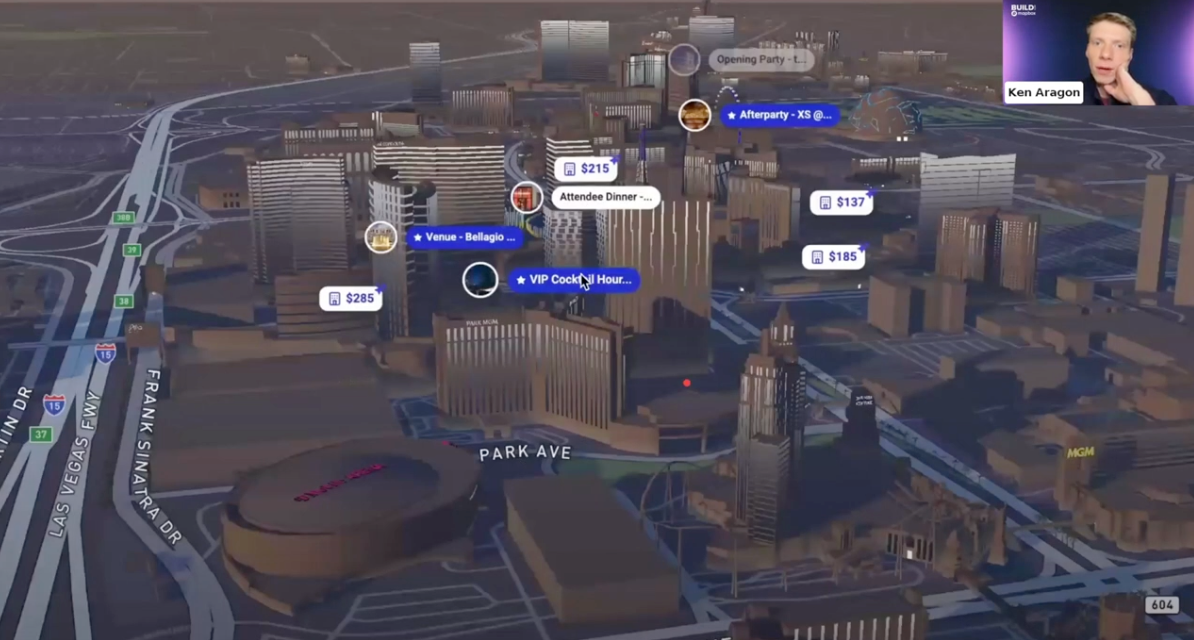
Ken Aragon, Co-Founder and CEO of Viata, opened his talk ‘Visualizing the journey: Using data and design to transform event travel with Viata’ with a personal story. Years ago, he traveled to a conference in Costa Rica, only to realize that the hotel he booked was far from the venue, even though the booking site made it seem close. The avoidable mix-up made the trip stressful and confusing. That experience planted the early seed for Viata.
Ken realized that traditional booking tools often fail to show travel times in a way that makes sense to real people. Most maps show miles. Most travelers think in minutes.
This gap inspired Viata’s approach: maps designed for clarity, storytelling, and emotional connection, especially for event travel, where every step of the journey matters.
Building maps that people look forward to using
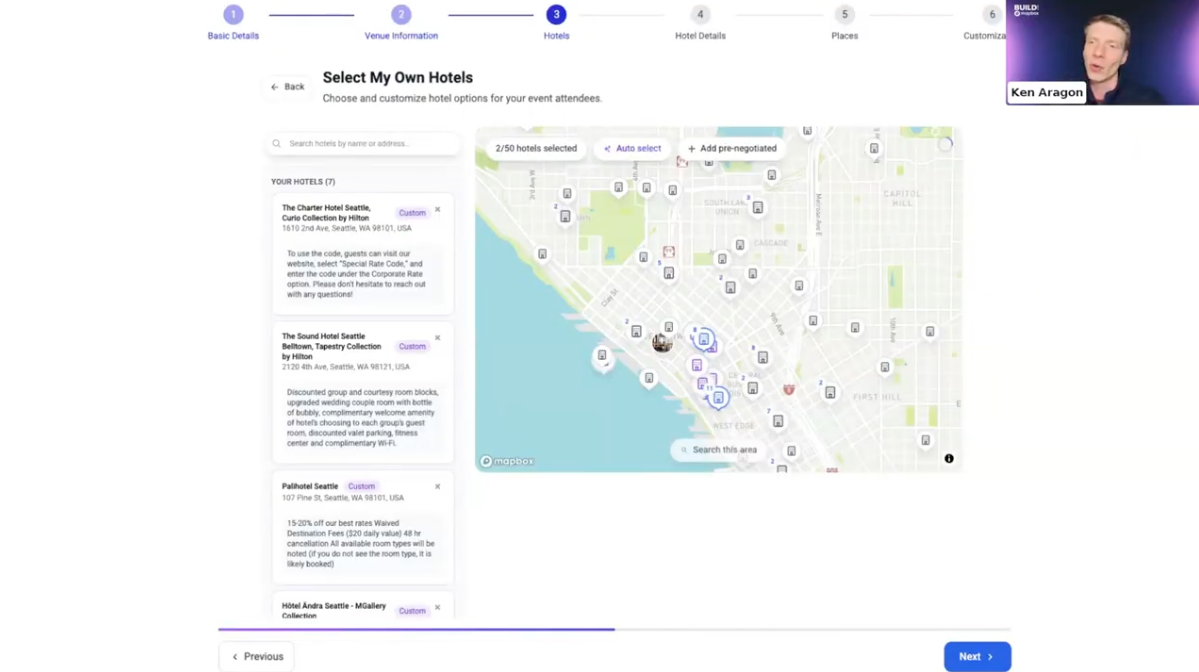
Ken explained how Viata rebuilt their mapping library and moved from Leaflet to Mapbox to support a more modern, flexible experience:
We really wanted to build a product that would stand out and get people excited and really inspired about the trip that they're planning... And that's why we switched to Mapbox.
He joked—only partly—that 3D buildings were a major factor in the decision:
I'm not going to publicly admit that I decided to change our entire mapping library because of the 3D buildings, but they definitely played a big role.
But the switch was about more than visuals. It was about freedom to design maps that match the experience Viata wants users to feel:
Mapbox brings all of those incredible modern features together in a flexible environment that actually lets you build the product that you need for your customers.
Ken also spoke directly about architectural differences when comparing Mapbox to other map providers:
We looked at other options like Google Maps... what they don't have is a flexible policy that actually lets you show what information you want to... Google Maps wants to own your entire ecosystem… whereas Mapbox takes a much more developer-first approach.
Travel as a guided story
Viata’s ‘Travel Time View’, built based on research from the University of Washington, shifts how people understand distance. A hotel or venue becomes easier to choose when you can see how long it will take to get there, not just how far away it is. Their editor tool lets organizers mark points of interest, set themes, and design a guided story for their attendees.
Ken’s session showed how maps can feel warm, helpful, and personal, not just technical.
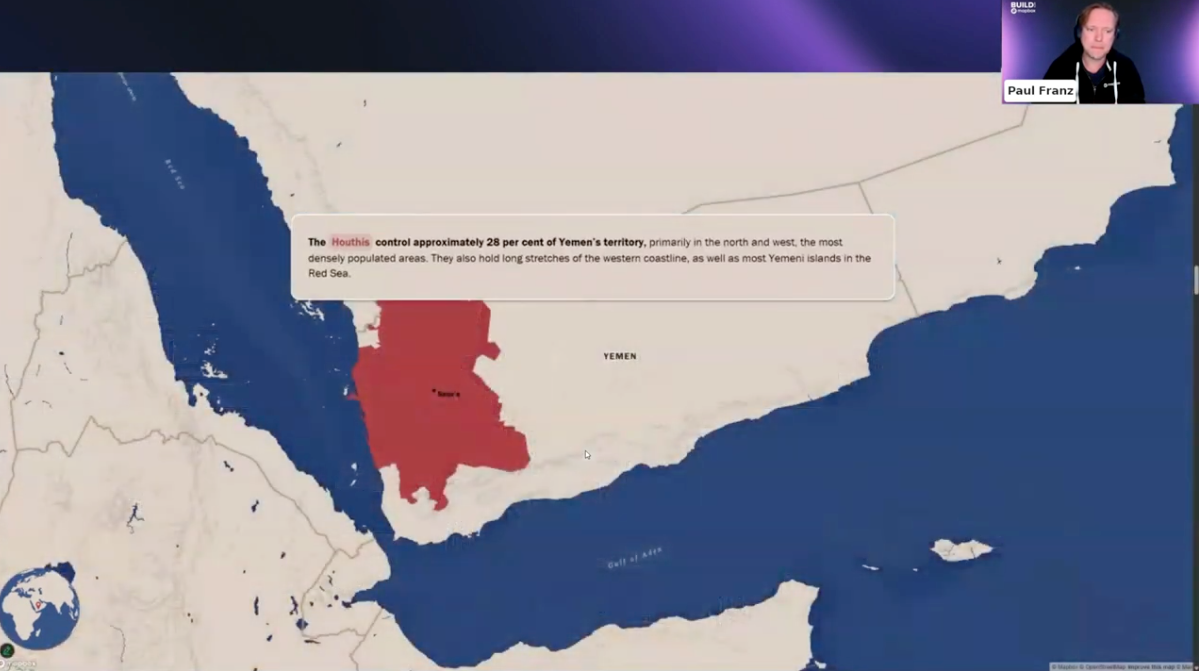
Paul Franz, International Crisis Group: Telling global stories with clarity
Paul Franz has spent six years at the International Crisis Group shaping how global diplomacy stories are told. His session ‘Mapping diplomacy: Visual storytelling for global impact’ traced how his work has changed over the years: from static PDFs full of charts to interactive, emotional map-based storytelling powered by Mapbox GL JS.
The shift from static maps to interactive stories
He discussed how maps help audiences understand conflicts, humanitarian issues, and political tensions in ways that plain text often cannot.
One of his reflections captured this shift:
Mapbox has been one of the most powerful tools that I’ve been able to deploy.
The rise of “scrollytelling” and 3D experiences
Paul showed an interactive story on the transatlantic drug trade that used ‘scrollytelling’ and 3D motion to guide readers through events and data. These formats bring policy topics to life for audiences who might not have a technical background.
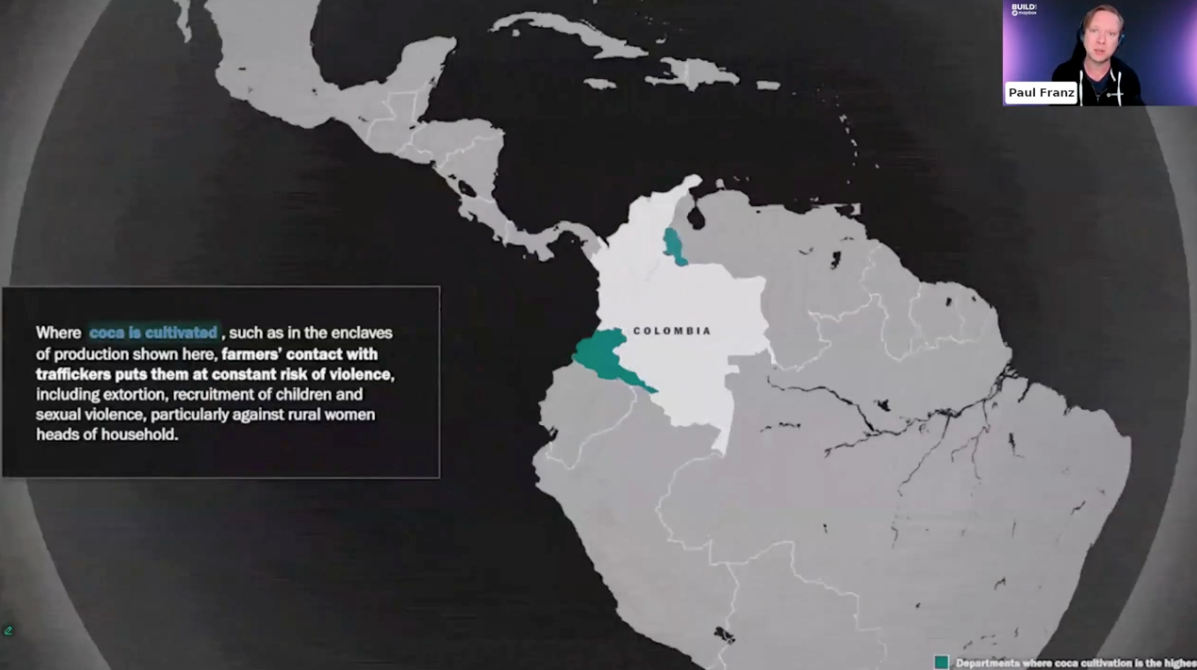
He explained that 3D features and immersive interactions feel like the future of storytelling, especially as attention spans shorten.
Collaboration, tools, and accessibility
Paul also talked about practical topics:
- The value of an agile workflow between writers, researchers, and engineers
- The role of LLMs as a “cheat code” for NGOs with limited resources
- The importance of sharing open-source templates so others can create similar tools
- Designing for regions where users might have older devices or limited broadband
He added a thoughtful comment about what teams need to build high-quality map videos or animations:
You need a designer or video editor with at least basic knowledge of Mapbox Studio and how a geodatabase like OSM works.
Paul’s honesty about constraints and teamwork resonated across the BUILD audience.
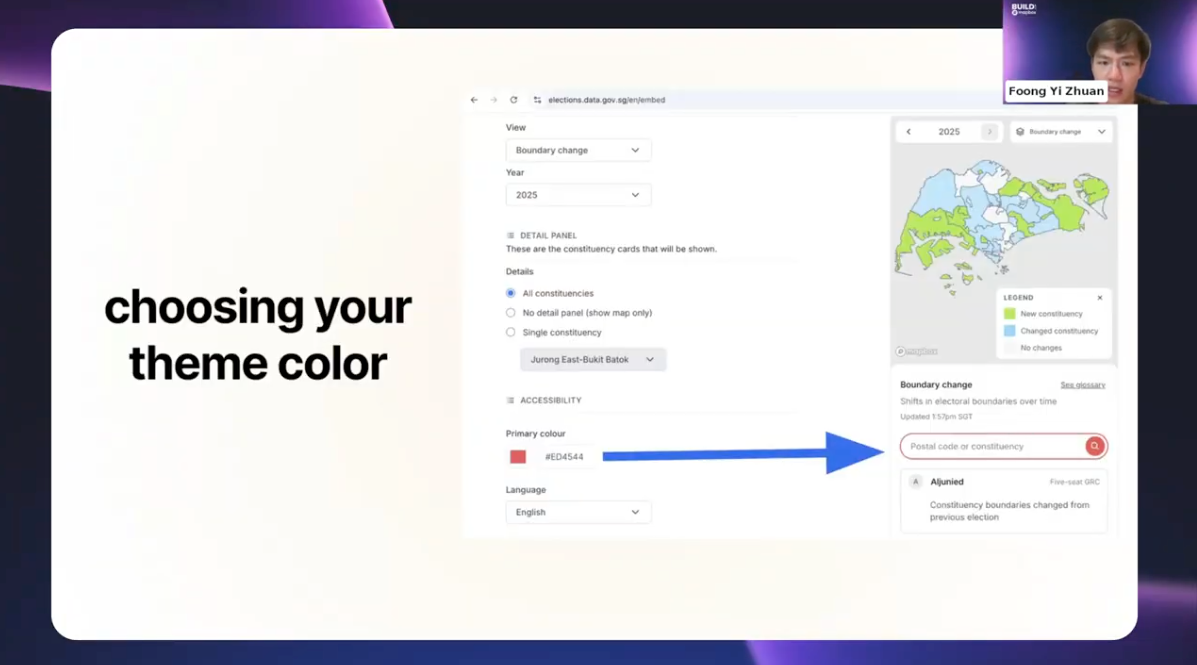
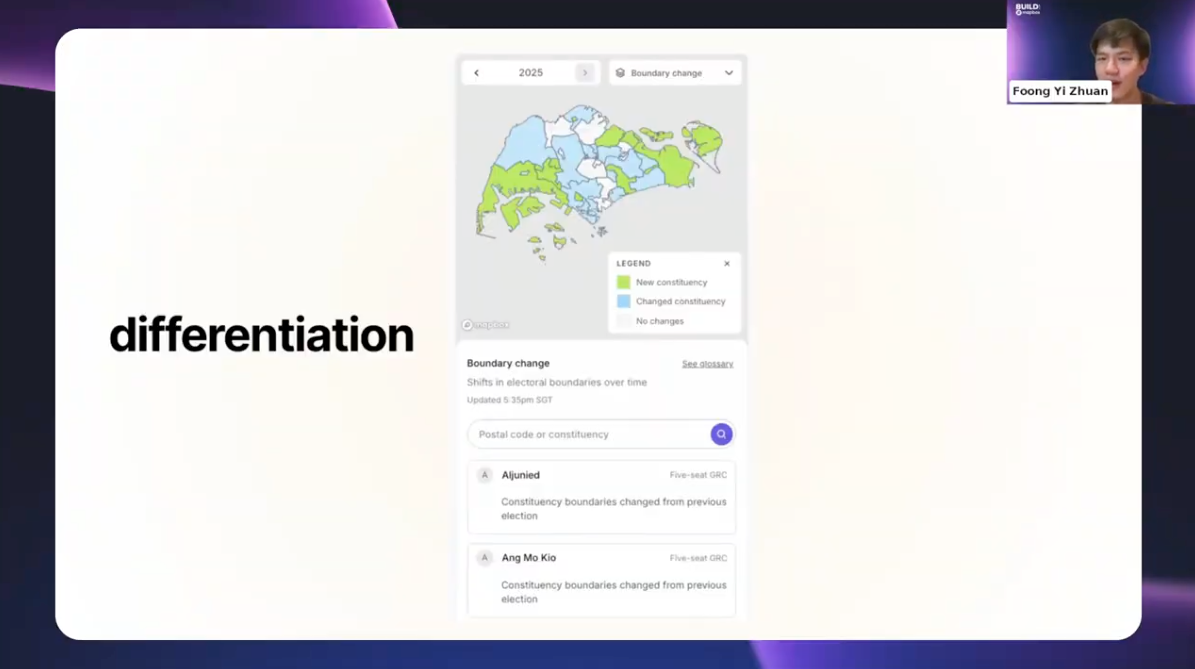
Singapore elections: Building trust through clear, public data
In a session from Open Government Products (OGP) Singapore titled ‘Mapping the vote: Building a scalable public map for Singapore's general elections 2025’, Product Manager Foong Yi Zhuan described how he and his team built the map used during the 2025 General Elections. The map was embedded across more than 20 media outlets and viewed by nearly 5 million users, an extraordinary number in a country of 6 million people.
But the story was not about traffic. It was about trust.
Prototyping to align stakeholders
Rather than long documents, Foong shared that a quick visual prototype did the most to get diverse stakeholders aligned on the project:
People started to realize, instead of looking at a document… they were able to touch and feel a map and interact with the data in a very visual manner.
With elections, small details matter: colors, labels, consistency, and clarity.
Designing with users, not guessing for them
User studies with voters and journalists shaped the entire map building process. Through many interviews, tests, and over 700 deployments, Foong’s team refined the map step by step:
Every time we fix a small bug or made a small change… we continue to improve the elections map and improve the product.
Foong also explained that journalists care deeply about branding, so OGP made the map flexible enough for each media agency to use its own colors and design style.
Handling sensitive data with care
Creating maps of election data often comes with a lot of pressure. When issues came up (like mismatched postal codes) the team communicated openly and explained the fix. This helped maintain trust with the public.
Foong summed up his session with a message that connected with the BUILD audience:
A lot of this aligns with what Mapbox is doing in terms of making geospatial data really accessible to users.
Reflections to take into the future
The voices at BUILD with Mapbox 2025 showed that progress comes from honest reflection and shared responsibility. Delivery Hero taught us about the care required when striving to optimize app performance. Viata reminded us that travel design should feel personal. The International Crisis Group showed the impact of visual storytelling in global diplomacy. OGP Singapore demonstrated how thoughtful public map making strengthens trust.
Across all sessions, one theme stood out: people build better experiences when they understand their users, test with purpose, and work closely with partners. These insights reflect not just technical decisions, but values: clarity, responsibility, and empathy for the people who rely on these tools every day.


Related articles

Mapbox Global Volunteer Month 2026: Giving back across communities worldwide
.jpg)
Women leaders at Mapbox: Shaping teams and growth