New bathymetry tileset and style for marine maps

Update: You can now add bathymetry easily in Mapbox Studio with a single toggle. We've built a lightweight default tileset for all users: Mapbox Bathymetry v2 | Tilesets
Underwater depth data, or bathymetry, transforms water layers into detailed landscapes, providing context for marine navigation, ocean sciences, and more. We just released a new bathymetry map (tileset and style) for developers to make custom marine maps.

Specializing in making expedition tracking apps, Zero Six Zero builds maps for sailing or rowing journeys and uses bathymetry to give maps a sense of scale and variation.
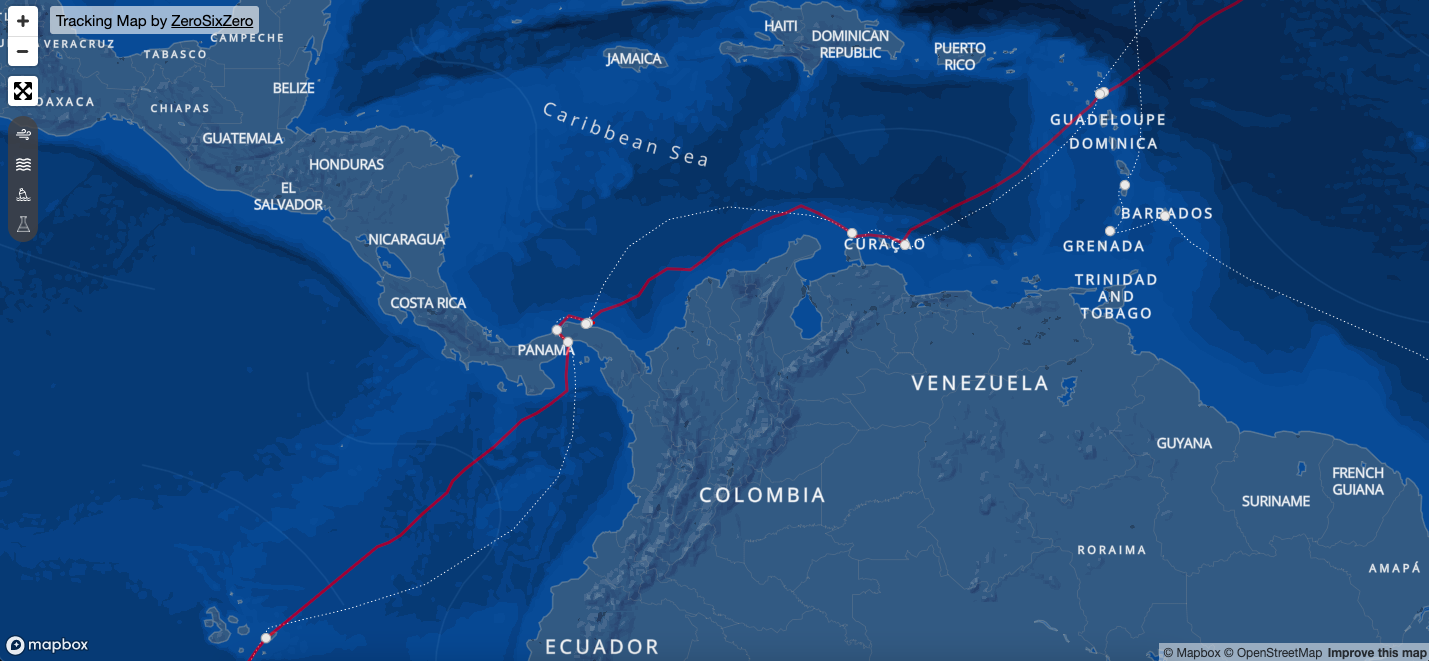
“Adding bathymetry data for ocean expeditions adds a visually interesting and informative layer to provide depth and context to the story.”
Anthony Goddard, Zero Six Zero
For the current Great Reef Census, Citizens of the Great Barrier Reef launched a planning map that uses detailed bathymetry data to guide surveys of remote parts of the reef too deep to be fully visible in satellite or aerial imagery alone.

“By combining bathymetry data with reef modelling and boundaries, we were able to pinpoint reefs and create itineraries that best suited each vessel, the participants onboard, and our surveying requirements.”
Som Meaden, Citizens of the Great Barrier Reef
Build with bathymetry
We’ve created a public tileset, mapbox-public.bathymetry, using Natural Earth data that allows all Mapbox developers and designers to add bathymetric data in their map without needing to prepare and process raw data. For more on how we made the tileset and how to make custom bathymetry tilesets, read our how-to post.
Get started with this tileset by copying this example map style, created by Jonni Walker, into Mapbox Studio. Once copied, developers can customize the style as needed. Alternatively, add the tileset as a source to an existing style in Studio. Developers can also use Mapbox GL following the updated documentation for styling bathymetric data.
To style this tileset, Jonni used a linear grayscale ramp with transparency to style each depth value. A mask layer above the bathymetry layer tints the entire ocean blue.

There is bottomless potential for creative styling with this data! Try a nautical chart inspired style like Jan Žák’s:

Or experiment with how to create an underwater 3D effect like Citizens of the Great Barrier Reef:

The ocean awaits! Explore the new tileset and style to get started building a map today. Share what you build on Twitter with #builtwithmapbox.
Read Part 2 on how to create custom bathymetry tilesets with MTS.
.png)


