New Advanced Tools for Map Rendering Performance Evaluation

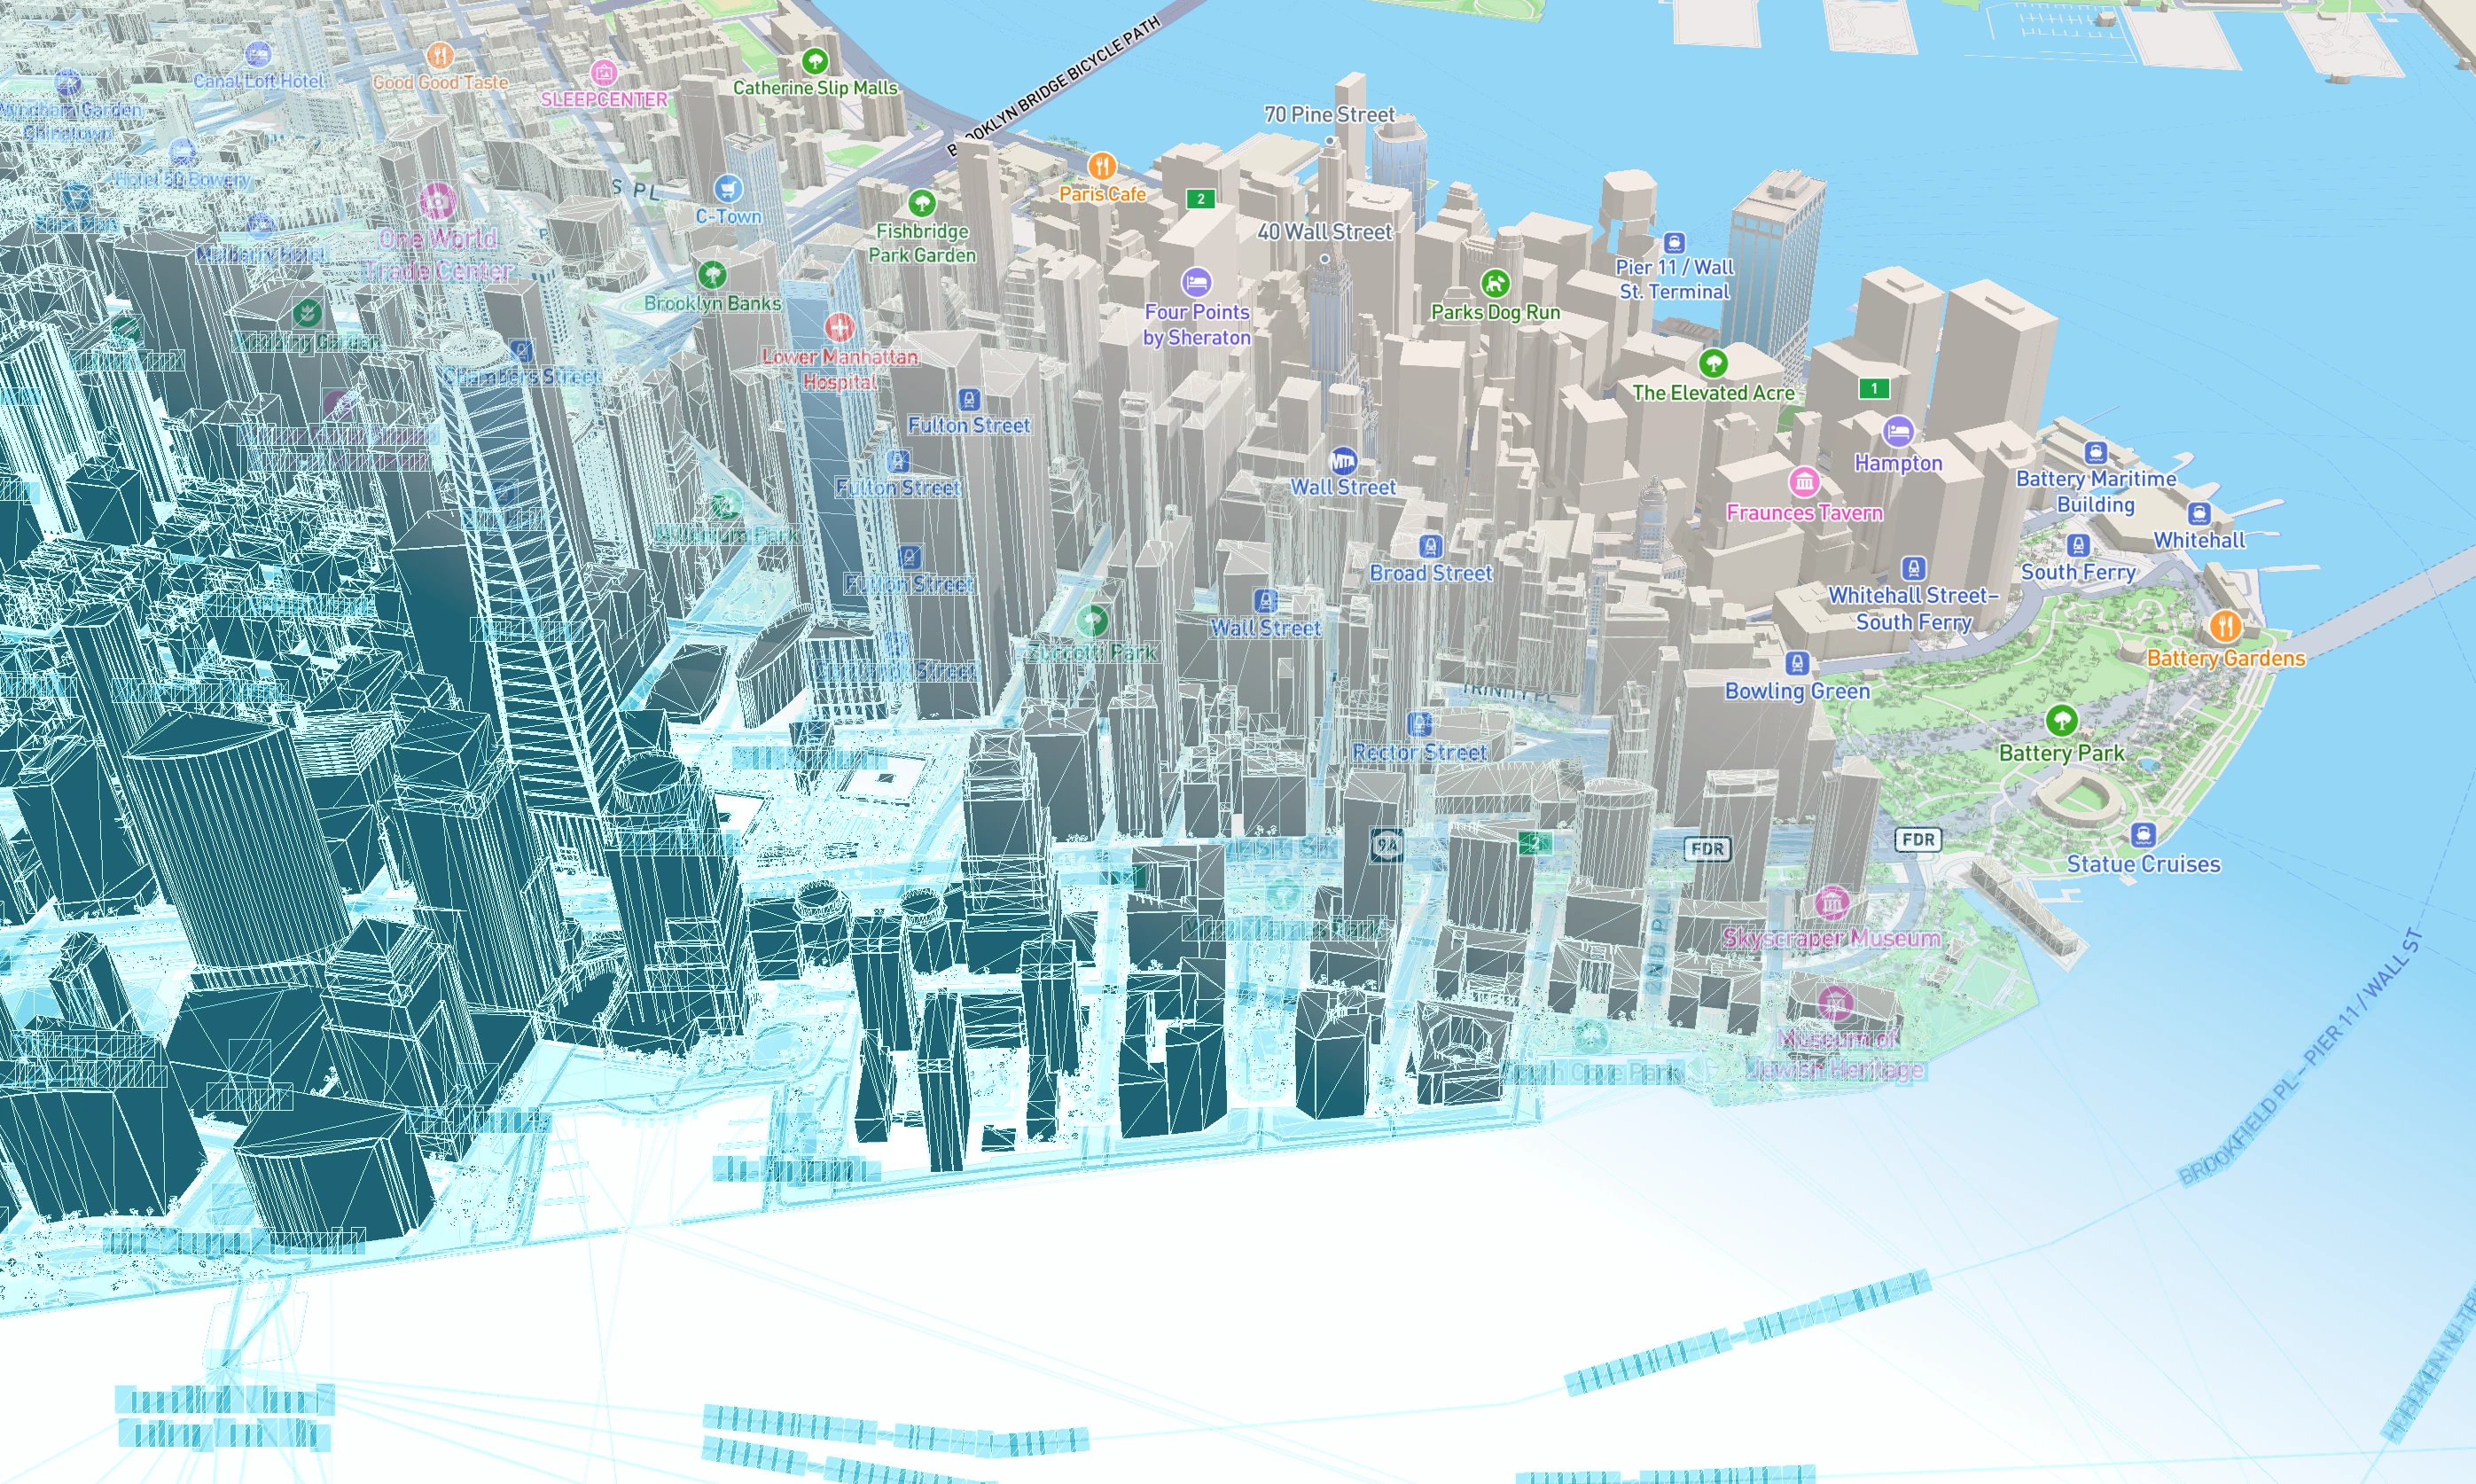
The arrival of the Mapbox Standard 3D basemap elevates the map rendering experience to new dimensions. Mapbox now offers more 2D and 3D basemap options than ever before while still maintaining consistent and industry-leading rendering performance. To achieve this, Mapbox strengthened and extended its development tools to better analyze typical map rendering scenarios and their resource usage. Those internal developers tools that support the design and maintenance of map styles are now available externally to Mapbox customers in the Mobile Maps SDKs v11. There are many considerations that went into how these tools help measure and optimize performance.
While it’s essential to observe the performance effects of all features individually, it’s also important to consider their combined usage based on real-world scenarios. For example with Mapbox Standard, one must consider the cost of simultaneously rendering 3D models, dynamic lights, shadows, terrain, atmosphere, and various layer types. The amount of content displayed also varies dynamically, influenced by factors like location, zoom, pitch, and the map's display size. The rendering performance will ultimately depend on the capabilities of the hardware versus the resource usage of the map at a given time. Increasing the range of the visual experience inevitably brings an increase in the combinatorial complexity of the rendering engine.

Difference in Static and Dynamic Performance
In practice, the most significant impact on performance stems from the dynamic nature of sessions. Dynamicity refers to changes in the map's configuration at timed intervals. Predicting precise resource usage at a specific time is nearly impossible due to the multitude of variables. However, it’s possible to observe upper and lower bounds and establish a target range for maintaining consistent performance.
Dynamic camera movements cause frame rate fluctuations due to factors like content loading, symbol alignment, property evaluations, and on-screen rendering. These processes can delay response times, impacted by network and disk access latency, as well as CPU and GPU load. In contrast, a static scene can be rendered with almost fixed resource usage. Fixed configuration scenes serve as crucial benchmarks in map assessments, although they may not fully encompass practical use-cases.

Creating Repeatable Dynamic Test Scenarios
The MapRecorder API was intuitively developed to offer reproducible instances of dynamic map rendering scenarios. (See examples: Android / iOS) The primary focus is maps that involve continuous camera movements in urban environments, similar to navigation sessions. MapRecorder can capture input from the Navigation SDK and replay it, enabling an in-depth analysis of the performance usage in that specific instance. These scenarios primarily assist in maintaining resource usage within the specified limits of the given platform and hardware.
We used to have a similar testing procedure using a custom animator that operated based on a list of coordinates and a fixed zoom level. However, it's more effective to test the system with actual API calls recorded during navigation on the road. This approach ensures that there is no disparity in the playback when compared to a real-world navigation scenario. Additionally, it serves as an integration test by executing various API calls within the same session, providing added benefits.
In scenarios like rapid zooming to display route overviews in navigation apps, the performance impact is tested using MapRecorder playbacks. The shift in zoom levels triggers: first, the loading of new content from the network or disk, then preparation for rendering, then loading data into the GPU, and finally, a display on the screen. This can occur in less than a second, while displaying different streets, buildings, and countries. Maintaining a steady frame rate is vital for a positive user experience. With API playbacks, the scenario can be repeatedly tested to ensure that frame rates are not compromised as new functionalities are introduced to the maps.
Contextual Performance Evaluation
Performance analysis tools have also been expanded. Typically, when evaluating the graphical performance of maps, key metrics like per-frame rendering duration, GPU and CPU utilization, and various memory usage values are the focus. Detecting regressions is relatively straightforward if any of these values spike after a change in the SDK or style content. However, when aiming to enhance the existing setup, adding more context to these values becomes crucial.
The Performance Statistics and Tracing APIs now provide users with better tools to analyze map resource utilization based on higher-level logical units. (See documentation: Android / iOS) In a Mapbox style, the most critical unit is a layer. Therefore, the Statistics API can return a list of the heaviest layers, sorted by individual render durations.
The resulting statistics offer valuable insights into tracking the performance impact of layer property changes. Mapbox intentionally refrains from disclosing the performance costs of the style specification elements because it typically depends on the context and SDK version.
For instance, symbol layers with numerous features may take time to render, and applying the text-halo-color property noticeably increases the render duration of the layer. In the v10 series of our SDK this property introduces an additional layer to prevent overlap between text and halo colors. Mapbox analyzed the performance effect of this property within the Mapbox Standard style and the statistics revealed an increased draw call count when the halo property was applied. To address this, Mapbox implemented a targeted optimization in the v11, enabling the rendering of text and halo in a single draw call. This noticeably improved render durations. It's advisable to measure performance before and after style changes and consider whether a specific layer requires additional filtering or conditional use of certain properties.
Mapbox also expanded the contexts for platform-specific tracers. Tracing proves to be one of the best approaches to identify performance bottlenecks, especially during user interaction-related performance issues. The new Tracing API enriches recordings with contextual markers that help pinpoint the source of resource usage spikes during map rendering, across multiple threads. The rendering of layers can be individually tracked, along with tile fetching, and parsing intervals. Generally, a slow tile-loading section may suggest issues with network connectivity or excessively large content size. Delays on the render thread may occur due to frequent style modifications (particularly during render tree creation), or the complexity of a layer if it takes noticeably longer to render than others.

Both the Performance Statistics and Tracing APIs share a common purpose—they are designed to track resource usage. Tracing excels at pinpointing increases in resource use over time, while the Statistics API can categorically identify these increases. Additionally, the statistics collection can be configured independently from the platform's tooling, making it applicable in broader scenarios. It’s advisable to observe the statistics during style editing, making this a useful tool for both map designers and programmers. In contrast, it’s advisable to use tracers to analyze the impact of more substantial modifications or to investigate contextual performance regressions.
It's also valuable to consider the typical user scenarios for the map, such as the frequency of camera movements and the main locations displayed. These scenarios can be captured using the MapRecorder API and analyzed using the Performance Statistics or Tracing APIs before and after software modifications. Adopting a workflow like this can help maintain performance within a target range, even in complex dynamic scenarios.
Get testing
These tools are now integrated into the v11.2 release of the Mobile Maps SDKs and are available for immediate download. For detailed guidance on how to make the most of MapRecorder, Performance Statistics, and Tracing, refer to the user guides for Android and iOS platforms. To migrate to v11, see the migration guides for iOS and Android.


