Lorem ipsum dolor sit amet, consectetur adipiscing elit, sed do eiusmod tempor incididunt ut labore et dolore magna aliqua.
International Rescue Committee maps top 20 countries with greatest risk for humanitarian crisis in 2021
Heading
The International Rescue Committee (IRC) launched an interactive version of their 2021 Watchlist, an annual report that identifies the 20 countries at greatest risk of a major new, or significantly worsened, humanitarian crisis over the year ahead. For the 2021 Watchlist, the IRC built upon the interactive storytelling solution to engage audiences in a dynamic new way.
Produced using the IRC’s Crisis Analysis methodology, the annual Watchlist serves as a call to action for global leaders, media outlets, and the international community to focus humanitarian response planning and preparedness efforts. The Watchlist is the IRC’s most highly viewed and shared report each year - Watchlist 2021 garnered more than 40k page views just one month after publication and has been featured by media outlets like NPR, BBC, and the Washington Post.
The IRC’s Crisis Analysis team and the Mapbox Community team collaborated to translate the 2021 findings into a digital tour of crises and countries to watch. The interactive map format allows readers to engage with the IRC’s data while the maps provide context and scale.
“Mapbox technology and functionality undoubtedly elevated our 2021 Watchlist. It enabled us to creatively demonstrate the geographic scope of crisis contexts around the world. We are so grateful to the Mapbox team for their editorial and technical support throughout this process.”
Alexandra Sarazen, Emergency Communications Officer, IRC
Building the Watchlist map
IRC built the Watchlist 2021 map based on the interactive storytelling solution. For tips on how to build a similar country ‘spotlight’ storytelling map, keep reading.
Prepare the content first
The IRC’s Crisis Analysis team abbreviated the findings of the full report to fit the structure of storytelling map ‘chapters’—one chapter per Watchlist country. In total, the team drafted content for twenty-two chapters, each with their own specific map design notes to highlight specific labels, regions, or other custom map features relevant to the narrative.

Once drafted, the narrative text can be copied into chapter sections in the storytelling config.js file. Outlining all the chapters early in the process helps to establish the broader flow of the story and inform map design.
Style a custom basemap
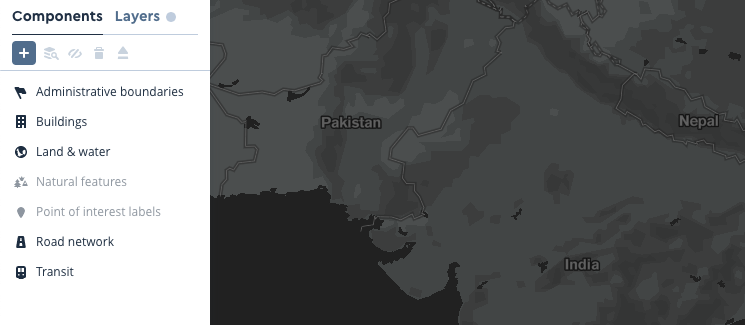
Like many organizations, IRC has branding guidelines that include color palettes and fonts. Mapbox Studio made it easy to create a custom style to match the IRC brand —in this case starting with the Dark Monochrome template, as the base colors resemble the IRC’s gray color palette. A gray basemap also provides contrast for layers in yellow and orange, the IRC’s other two main colors.
Studio ‘Components’ make it easy to customize a template style. In this case, turning off Points of interest and Natural features helped simplify the style, while keeping Land & water in shades of gray for subtle geographic context. The Typography component helped to change all labels to IRC’s custom font.
Use filtered layers for countries and labels
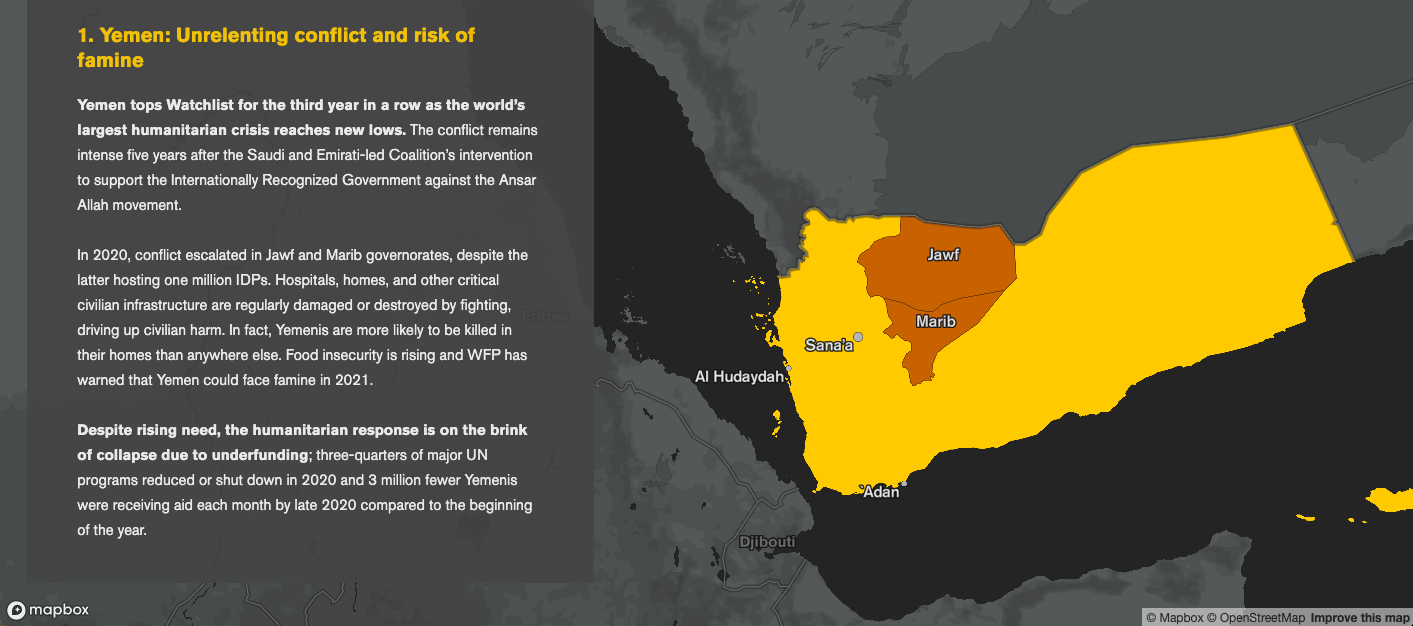
The most visually striking part of the Watchlist 2021 map is how each country is highlighted on the map in yellow. The main ingredient here is the Countries v1 tileset (available to all Mapbox accounts) combined with filters.
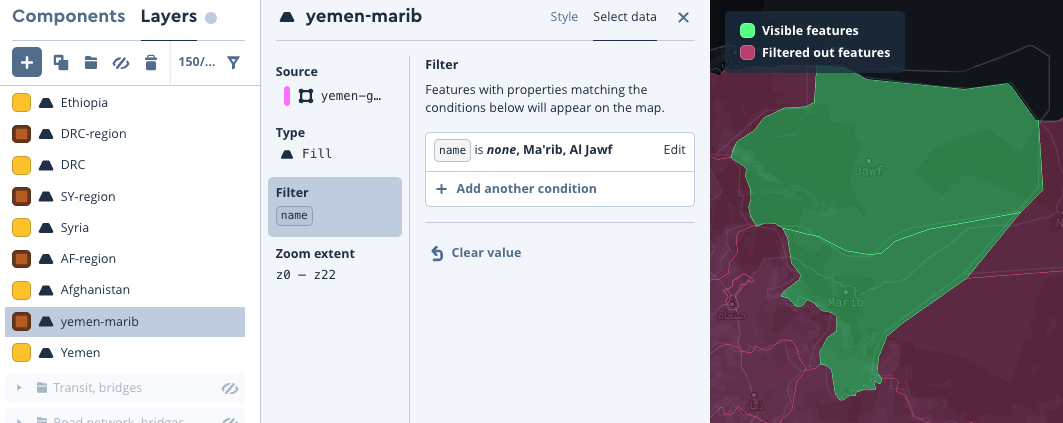
The storytelling template allows each chapter to turn map layers on and off. The single country ‘spotlight’ effect is achieved by creating a new layer to style each individual country. To make a single-country layer, add a new layer (the + button), select the Countries v1 tileset as the source using its tileset id, and then apply a filter in the ‘Select data’ tab using the iso_3166_1 data field and the two letter ISO code for each country. For example, for the Yemen layer the filter is: iso_3166_1 is YE.

To add specific point labels (like ‘Aden’ in Yemen) the Mapbox Streets v8 tileset and place_label layer are available. Every feature in the tileset has a unique id number which can be used to filter the tileset. To find the id value to use for a particular location, use the search bar within Studio to zoom to the location then click on point to view a popup with tileset details.

Create custom sub-national layers
For some chapters, IRC needed to highlight particular regions of a country. This was possible using QGIS and open data (from Natural Earth and government data portals) to create region polygons to upload into Mapbox Studio. (If precise boundaries are not required, it is possible to draw custom polygons in the Datasets editor instead.)
To create labels for custom regions or places, one option is to use the Mapbox Studio Datasets editor to manually create point data, including a data field for the label text.

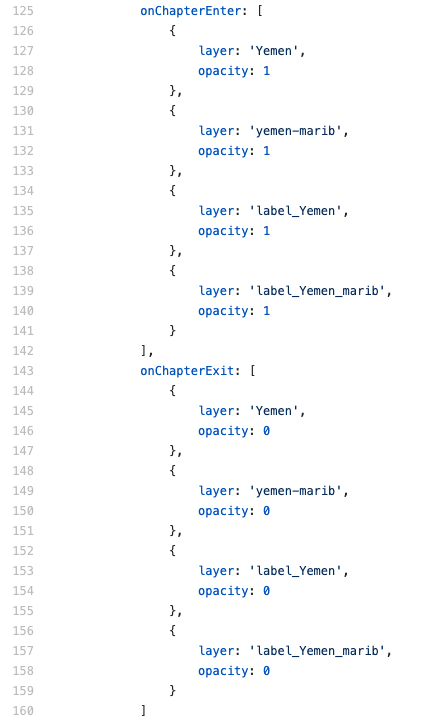
Turn layers on and off for chapters
Once all the chapter layers are ready, set their default opacity to 0 in Studio and ‘Publish’ the style edits. Then add layer on/off controls in the config.js file using onChapterEnter and onChapterExit parameters for each chapter (opacity 1 = visible, opacity 0 = not visible).
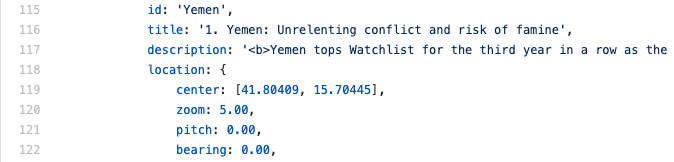
For example, in the IRC’s chapter about Yemen the layers Yemen, yemen-marib, label_Yemen, and label_Yemen_marib turn on when the chapter starts and turn off when the chapter ends.
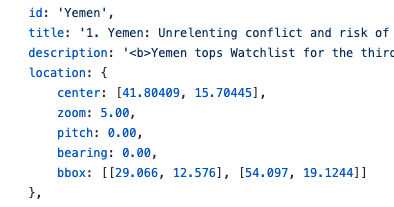
Add a bounding box
The IRC storytelling map needed each chapter to show the entire country regardless of browser window size. Center coordinates and zoom settings are not always enough to ensure that an entire country is visible in smaller windows.
The solution was to create a custom bbox parameter that could be defined for each chapter. To add a similar parameter to the storytelling template code, add a few lines of code to the index.html file, within the .onStepEnter(response => { commands:
if (chapter.location.bbox) {
    map.fitBounds(chapter.location.bbox, {
        padding: { top: 10, bottom: 25, left: 15, right: 5 }
    });
}
The code should look like this:

Then, in the config.js file, define a bbox for any chapter that requires it. An quick way to find bbox coordinates is to use geojson.io.
Visually link interactive and static reports with map images
The IRC’s final step was to create a copy of the storytelling Style to create static map images for the PDF version of the Watchlist 2021 report, using the Studio print panel. By making a copy of the style, it is safe to set any layers back to full opacity without risking a change to the live storytelling map.
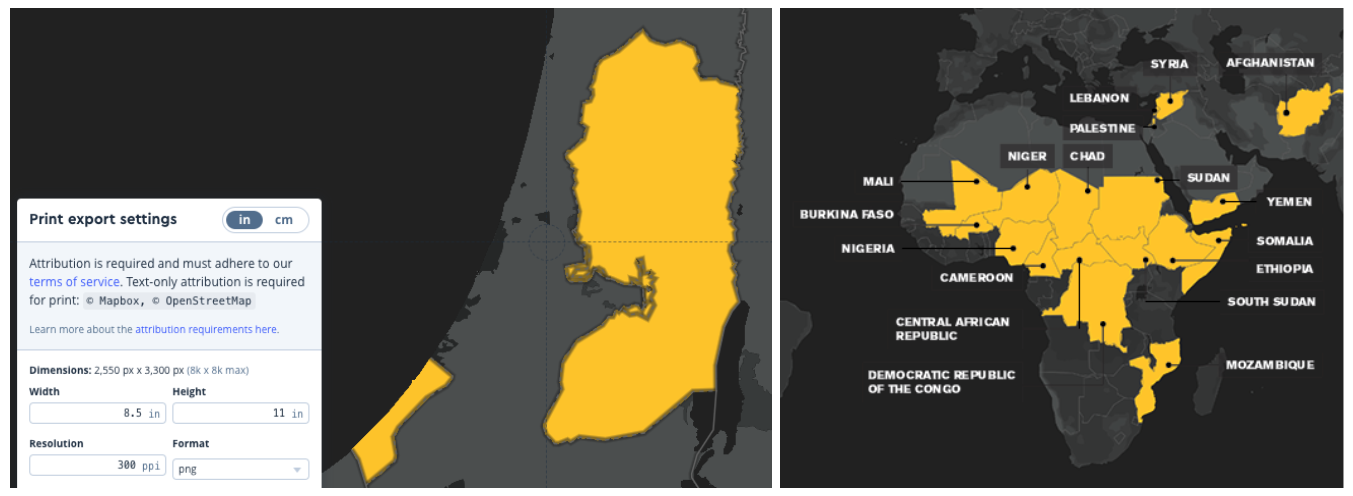
Inspired to build a similar round-the-world map report? Make your own with the Countries v1 tileset, Mapbox Studio, and the storytelling solution.
Need more help? Ask questions on Stack Overflow or contact Mapbox Support. If you are working on a social good project like the IRC, the Mapbox Community Team is here to support you.
Lorem ipsum dolor sit amet, consectetur adipiscing elit, sed do eiusmod tempor incididunt ut labore et dolore magna aliqua.
Lorem ipsum dolor sit amet, consectetur adipiscing elit, sed do eiusmod tempor incididunt ut labore et dolore magna aliqua.
Authors


guest
Marena Smith

guest
Alexandra Sarazen

Mapbox