No items found.

Featured speakers

Madison Draper
Featured host
No items found.

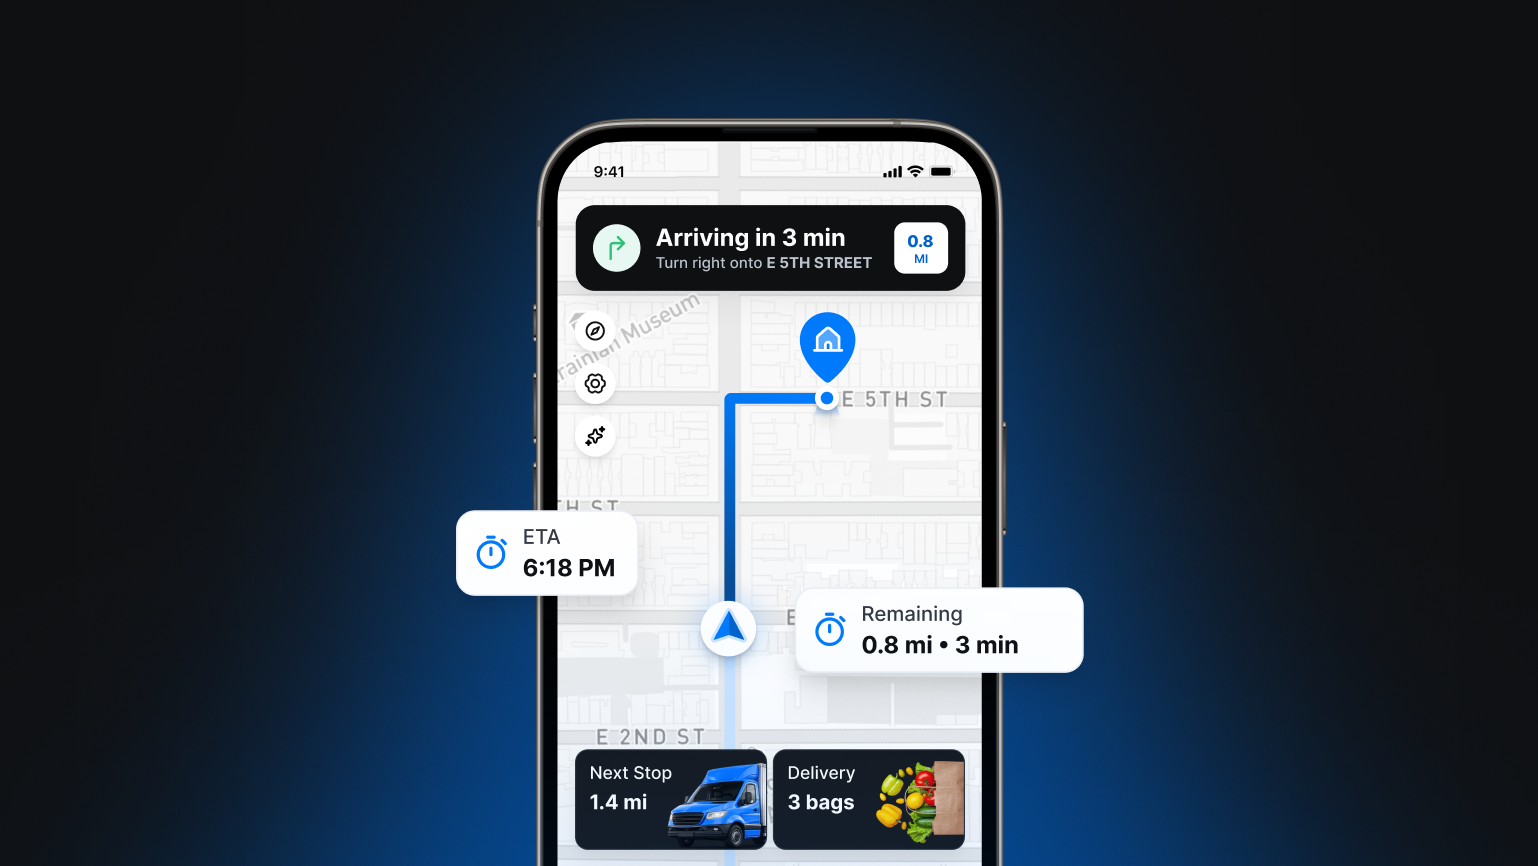
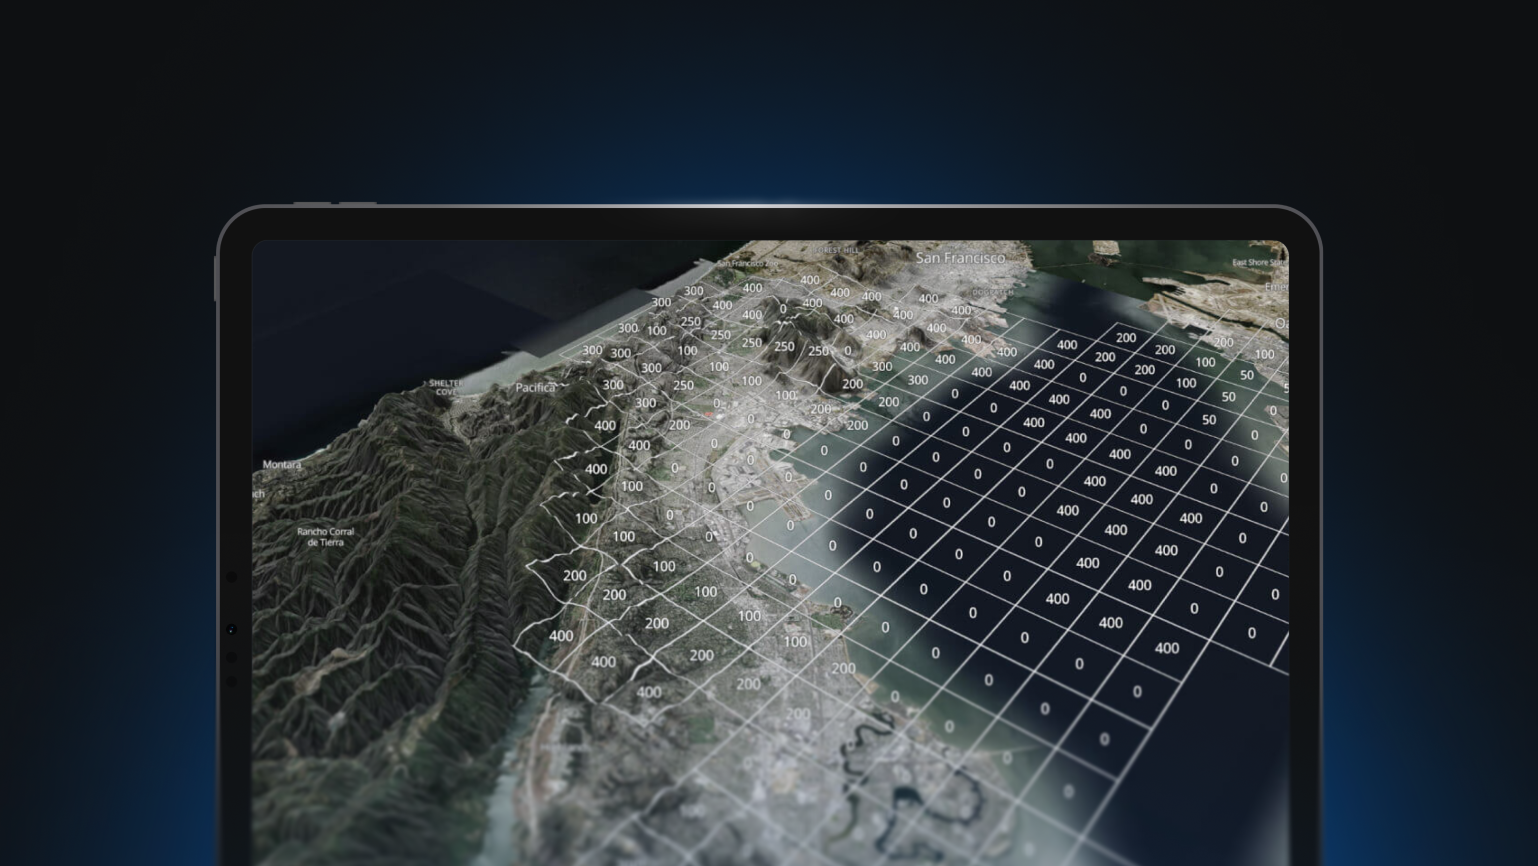
We'll show you the ease of creating a data visualization design and delivering it through a meaningful and interactive prototype–that conveys meaning beyond just boxes. We will focus on using Mapbox Studio to design the map and data, then integrate it into Framer to create an intuitive prototype.