Empowering Real-World Decisions with Mapbox Live Speed Data

Featured speakers


Featured host

.jpeg)
Register for webinar
ぜひ事前登録のうえ、ご参加ください。
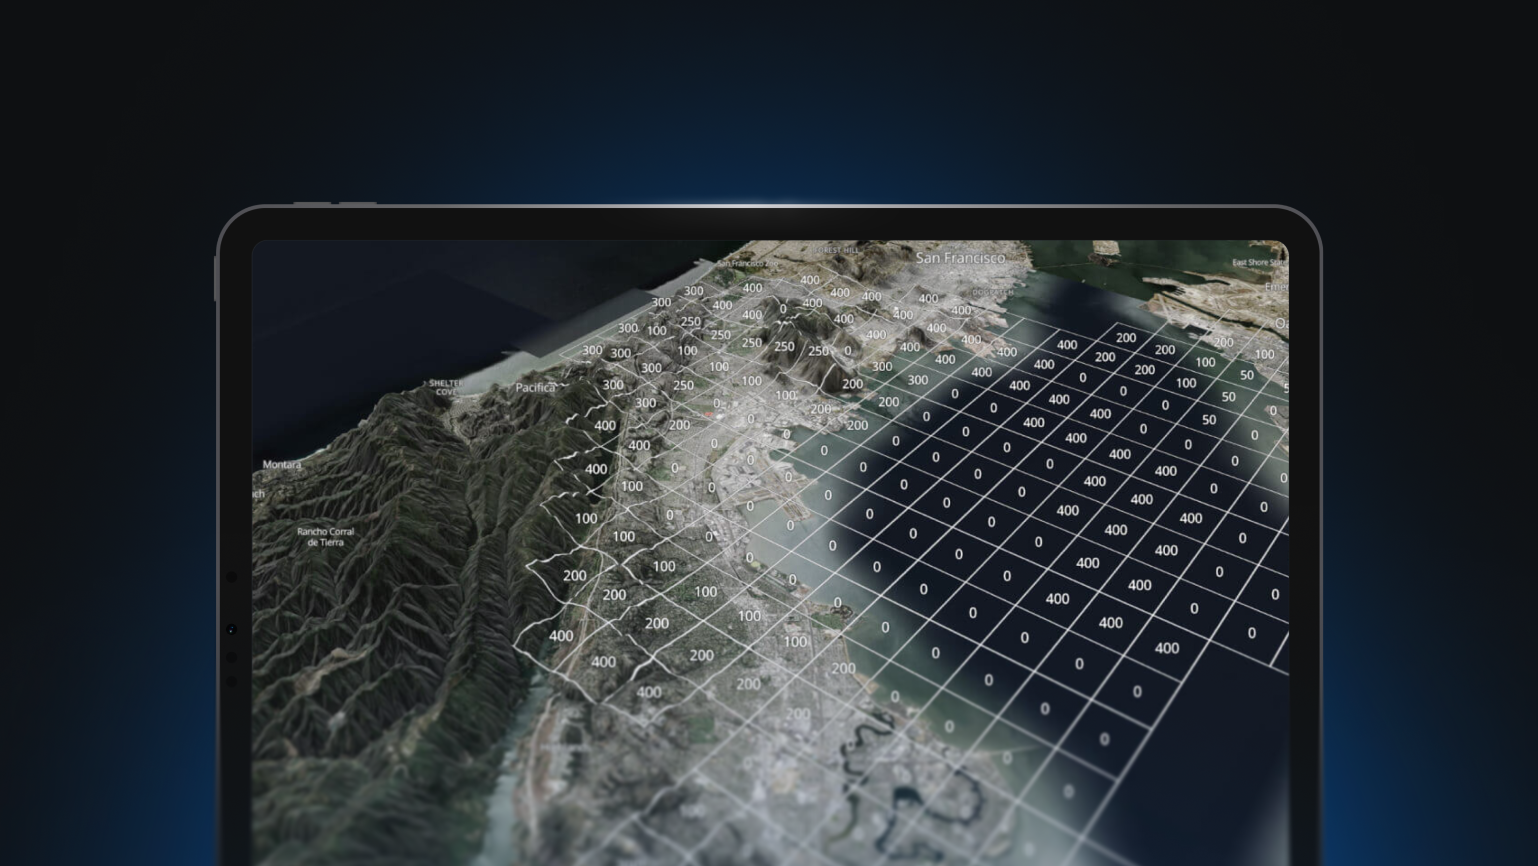
Discover how Mapbox Data and APIs deliver real-world solutions by providing access to live and historical traffic speeds.
Revolutionize the way you analyze and visualize traffic patterns in the final installment of our Mapbox Data roundup series with Mapbox Traffic Data. This webinar will cover the Mapbox Isochrone API, and the speed data pipelines that power it. We will discuss contexts where live conditions have a critical business impact when it comes to traffic.
You'll learn how to:
- Utilize the Isochrones API
- Review data structure of typical vs. live speeds
- Understand how Mapbox processes live and historical speeds
- Identify real-world scenarios where live speed data is critical


Empowering Real-World Decisions with Mapbox Live Speed Data
Revolutionize the way you analyze and visualize traffic patterns in the final installment of our Mapbox Data roundup series with Mapbox Traffic Data. This webinar will cover the Mapbox Isochrone API, and the speed data pipelines that power it. We will discuss contexts where live conditions have a critical business impact when it comes to traffic.
You'll learn how to:
- Utilize the Isochrones API
- Review data structure of typical vs. live speeds
- Understand how Mapbox processes live and historical speeds
- Identify real-world scenarios where live speed data is critical