San Francisco Chronicle Visualizes Earthquakes in Real Time with Mapbox

California residents need up-to-date, relevant information regarding earthquakes in their area so that they can make safe decisions. The San Francisco Chronicle created a system that could show quake strength, distance from epicenter, fault lines and more relevant info while events are still unfolding. With Mapbox GL JS, the Chronicle can quickly update their interactive experience to serve nuanced, fast map visualizations in near real time for a best-in-class experience their subscribers expect and can rely on.
“As a local newsroom, our mission is to get critical information to our readers quickly and accurately. Mapbox allows us to better serve our communities and make people safer.”
Tim O’Rourke, Director of Product and Strategy for the San Francisco Chronicle

The San Francisco Chronicle’s Earthquake Tracker is informed by data feeds from the U.S. Geological Survey’s Earthquake Catalog and visualized using Mapbox GL JS 2.0.
The Chronicle’s DevHub team systematically collects and processes data from 4 USGS (U.S. Geological Survey) feeds every minute, segmented by bounding boxes: Northern California, Southern California, USA, and the World. When new quake data exceeds predetermined thresholds for each region (above 3.0 for Northern California, 4.0 for Southern California, 5.0 for USA, and 7.0 globally) the Quake Tracker automatically publishes an update.

Atop the “Monochrome Light” Map Style, color-coded intensity contours make up each “Shake Map” expressing how much you felt (or would have felt) the earthquake based on distance relevant to the quake’s epicenter. Mapbox’s flyTo function transports users from quake to quake as they select each event from the list view (as seen below).
“Not only does Mapbox satisfy aesthetic appeal and performance that aligns with the quality that our users expect, but functions are common sense, formats are easy to match, and developer documentation is great. It’s easy to get started and there’s lots of options to drive creativity and value for our users.”
Evan Wagstaff, Senior Interactive Developer at The San Francisco Chronicle
The San Francisco Chronicle’s DevHub team has also recently relaunched the California Fire Map and California Air Quality Map leveraging Mapbox. Explore more from the team including the Bay Area Housing Guide, Bay Area Vaccine Tracker, and San Francisco Car Break-In Tracker.
Start building with Mapbox GL JS 2.0 today!


Related articles
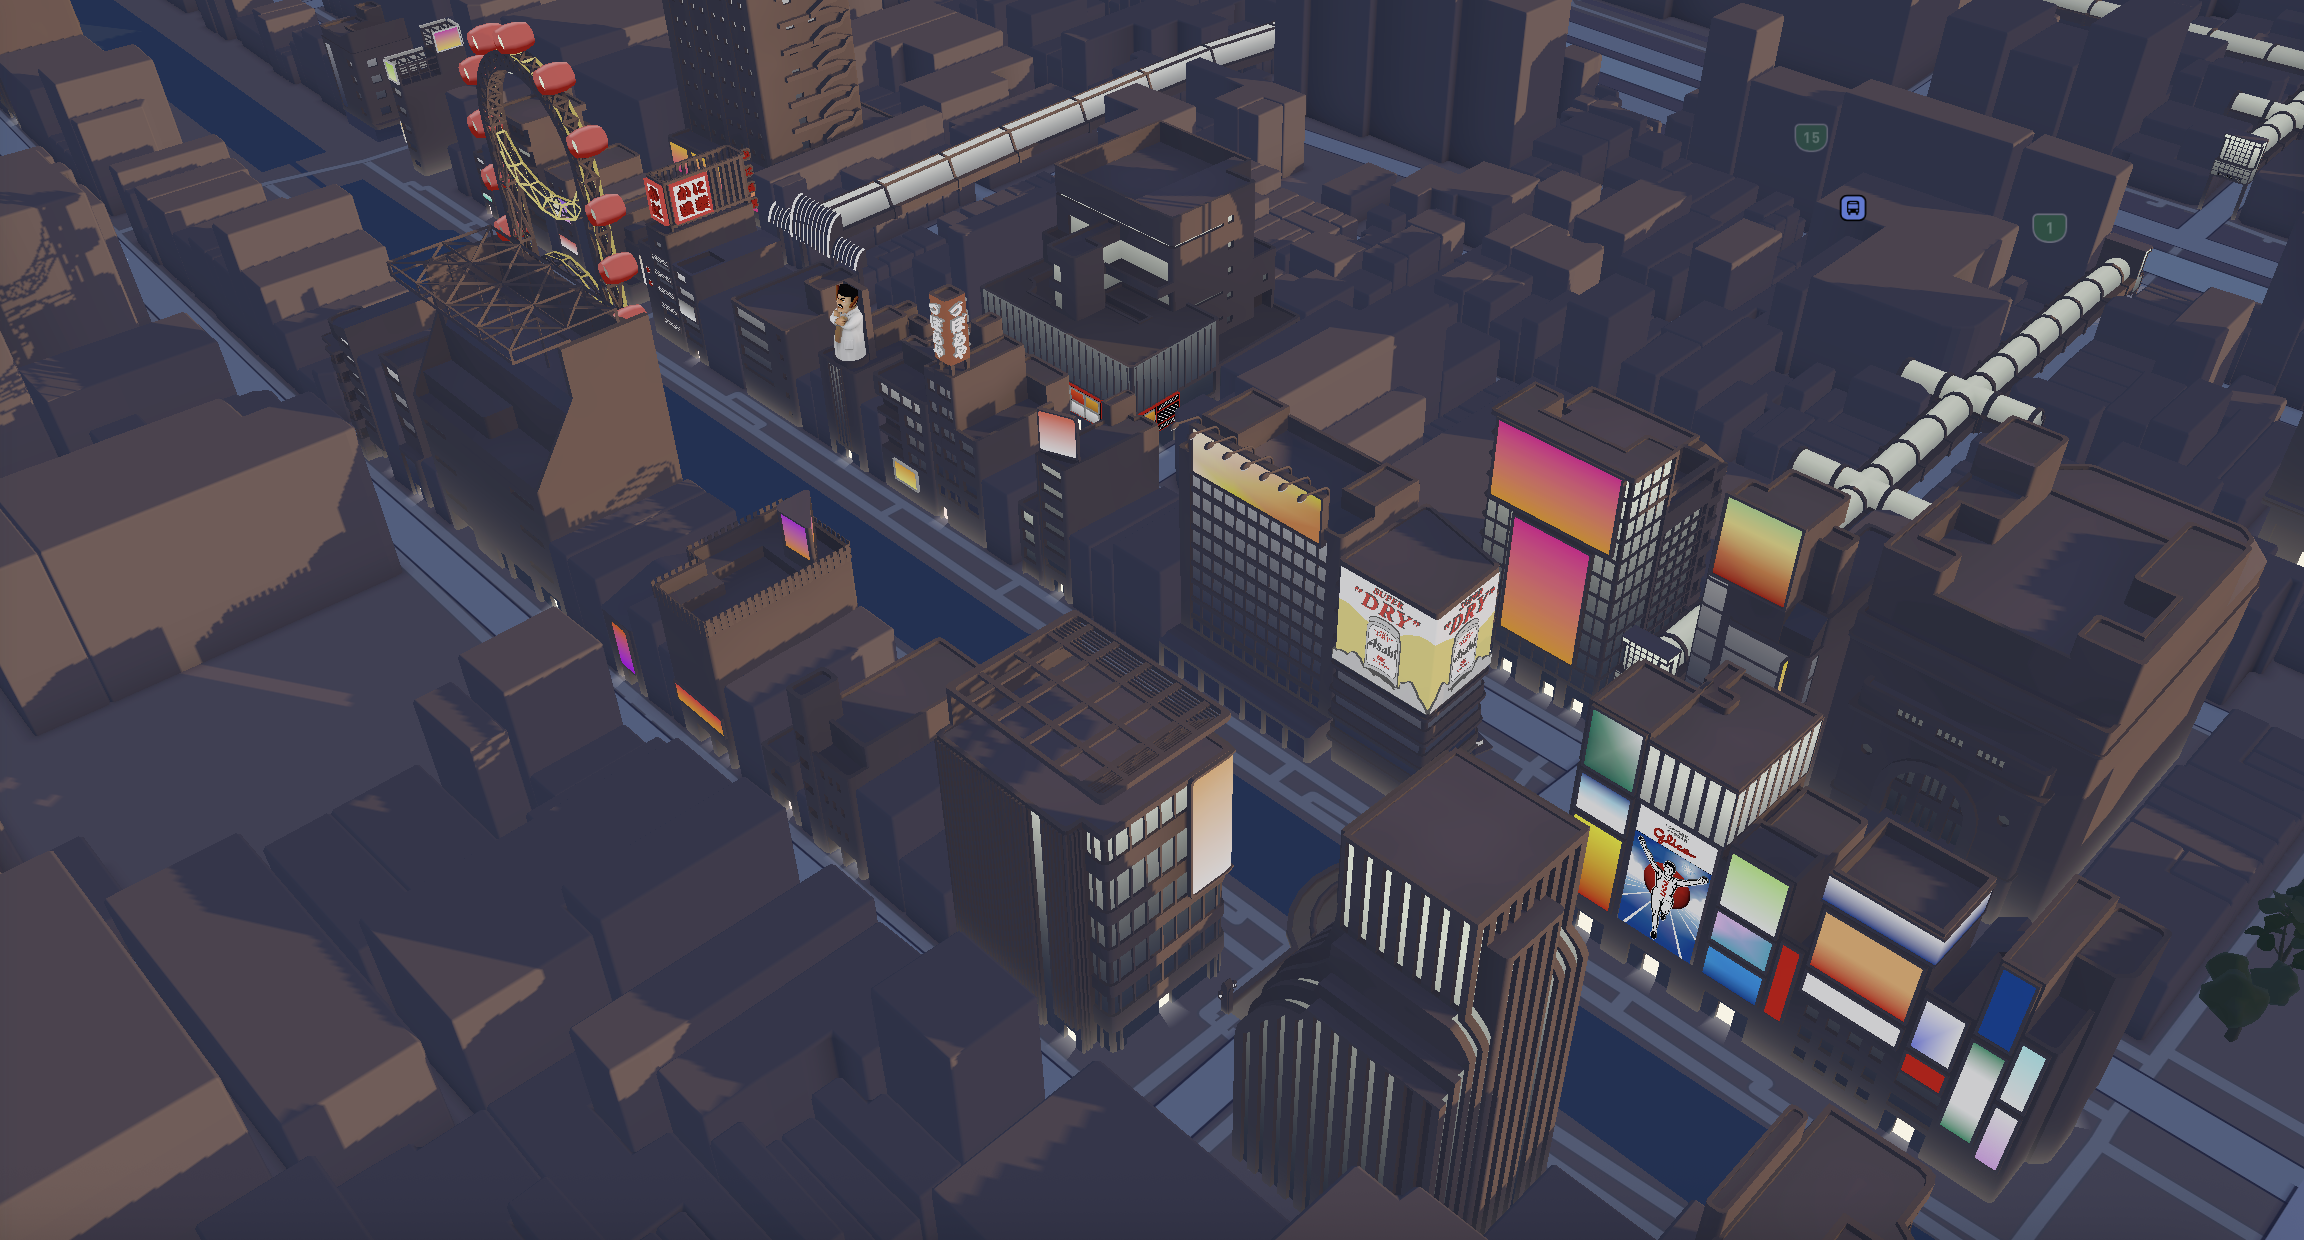
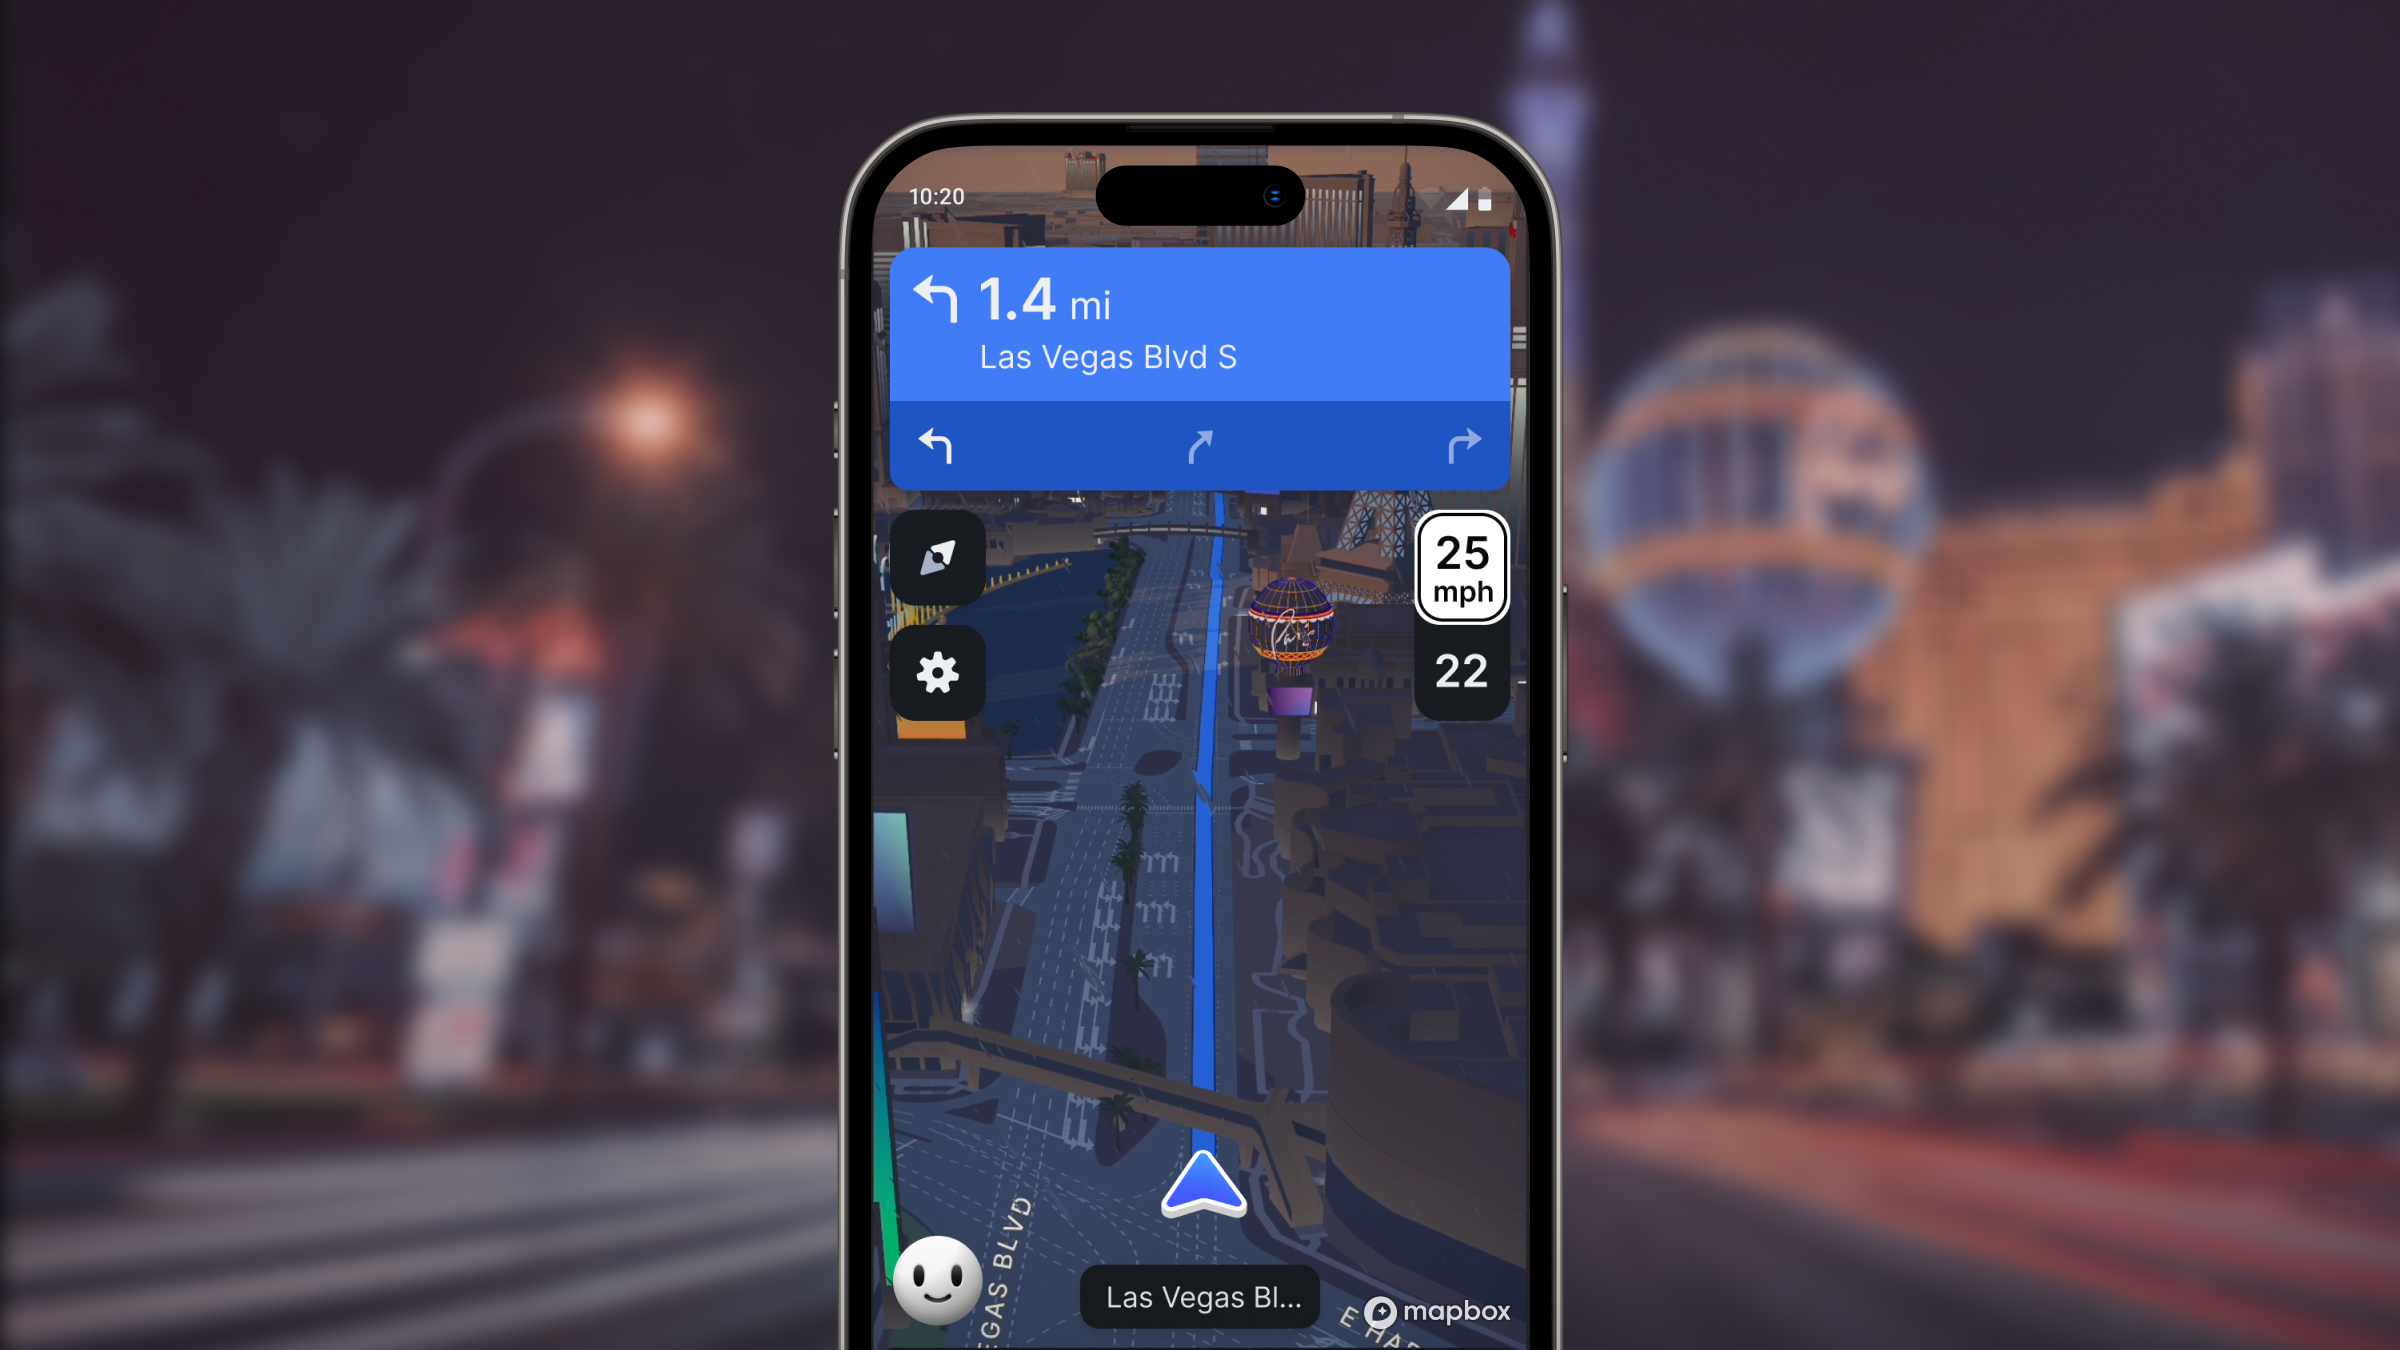
Tour Osaka in 3D with Mapbox Standard

One Attribute to Rule Them All