Mapping the US elections: the 2020 edition guide to feature state
This is part two of a guide series on US electoral maps and data visualization. Make sure to check out part one, on reprojecting your map data into Albers USA.
Previously, we shared how to add and/or build an Albers USA map and upload it to Mapbox. Since it’s election season, let’s take it one step further and learn how to use this projection live and update the styling in real time as data gets updated.
One way to do this is to use the Feature State API and the promote-id method, which was released with Mapbox GL JS v1.7.0. In a previous election post on using feature-state, we explained how feature-state relies on the top-level feature id attribute which must be unique to work. Additionally, the ids also had to be integers or strings cast as integers (e.g. “03989” or 3989). This made preparing the data very tricky.
Now, with promote-id, you can promote ANY property (e.g “california,” “03989”, “US06”) from a feature as a top-level feature id as long as it is unique. Mapbox GL JS will do the heavy lifting by creating a lookup table and matching the property to an integer, taking the burden away from the user.
This change will make mapping live election results significantly easier as it now accepts strings like FIPS code or GEOID which sometimes start with a 0. To better understand feature-state, I strongly recommend reading our previous post where we describe the technical specs and basic usage. If you don’t feel like reading the whole post, here is a tl;dr:
- The Feature State API provides a boost in performance because you can update the “state” of a feature at runtime, allowing control over a single feature without the map rendering engine having to re-parse the underlying geometry and data
- Feature-state is a set of user-defined attributes that can be dynamically assigned to a feature on the map. These attributes can be loaded from external data at runtime
- Feature-state relies on upper-level ids that must be unique
- With this API, you can handle interactivity and joining data in more performant ways
- Feature-state only works on paint properties
- If the ids aren’t unique, then the changes will affect more than one feature
- Feature-state can now be used with strings as ids using the promote-id method
Using promote-id
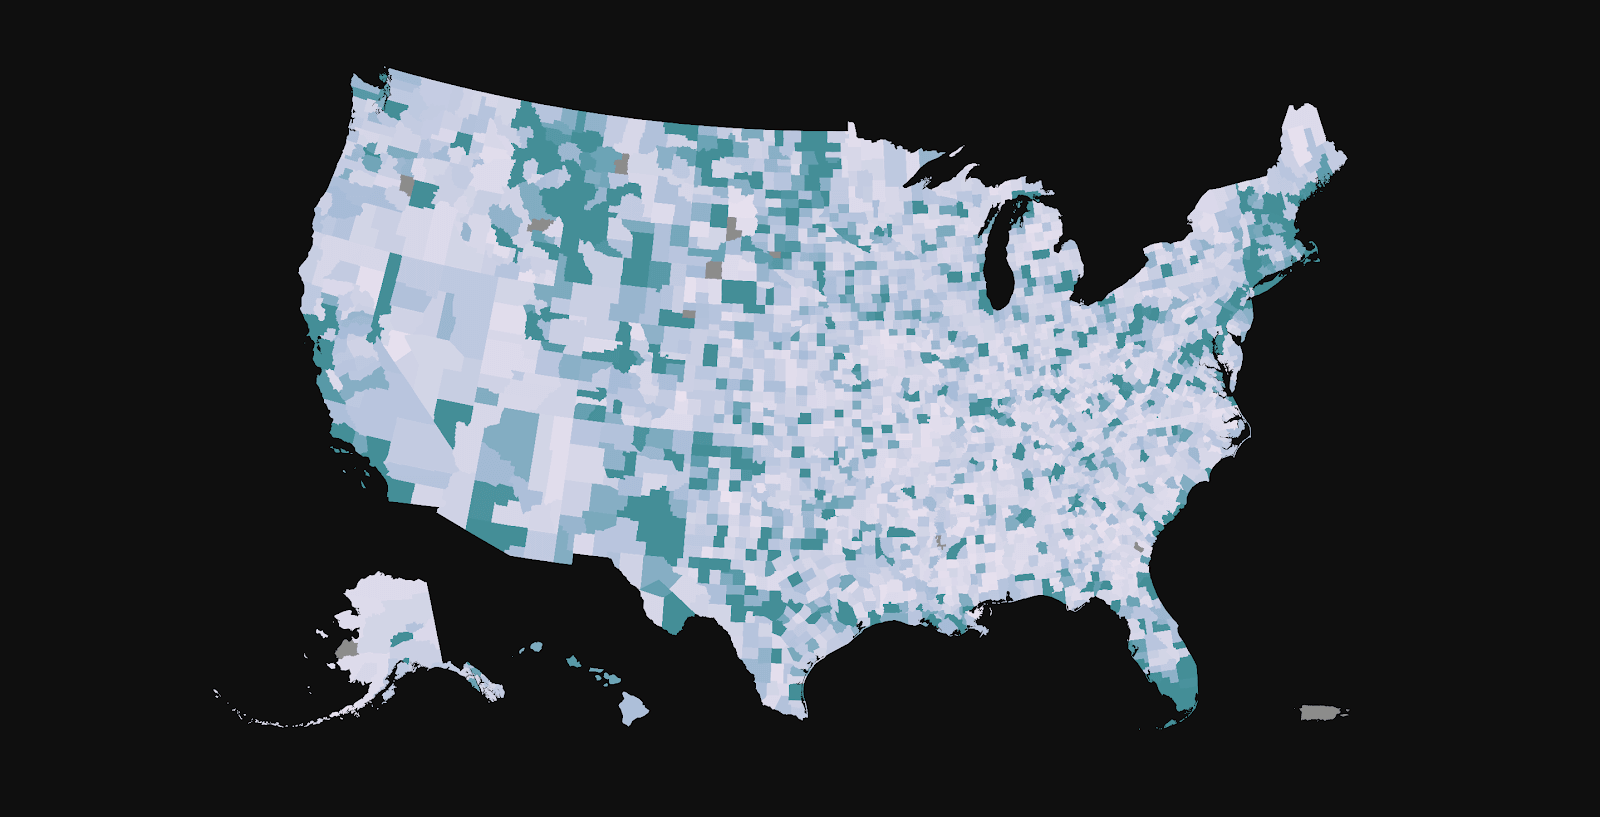
The following example uses 2012 campaign finance data and maps the contribution per capita per county in dollar amount. While the data isn’t technically being updated live, the technique presented here remains the same.
You can download the data here, but keep in mind the data is old and isn’t suited for reporting.
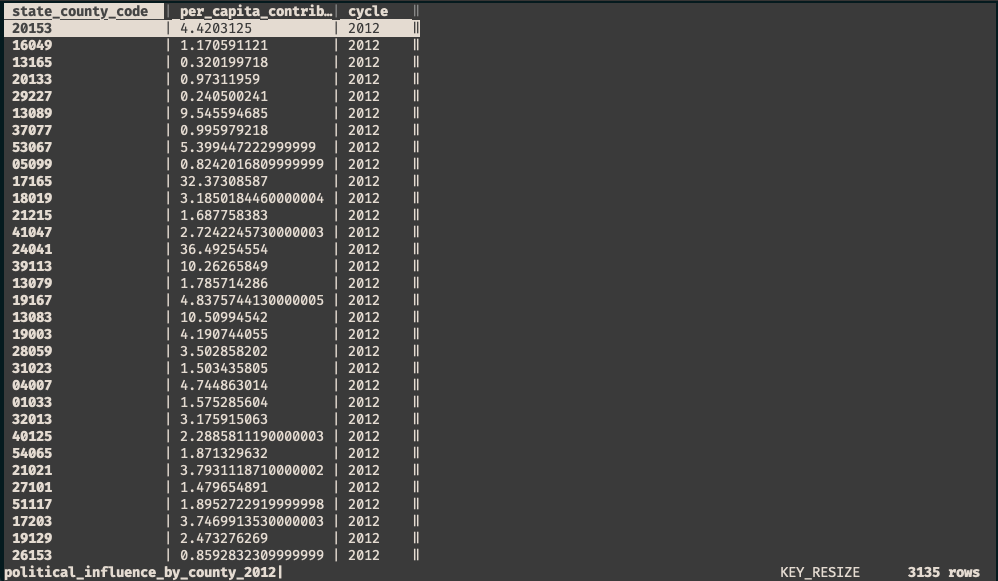
As you can see below, the FIPS codes are strings and some start with a 0. Previously, feature-state wouldn’t have been able to handle data in this format without an extra step to convert these into integers.
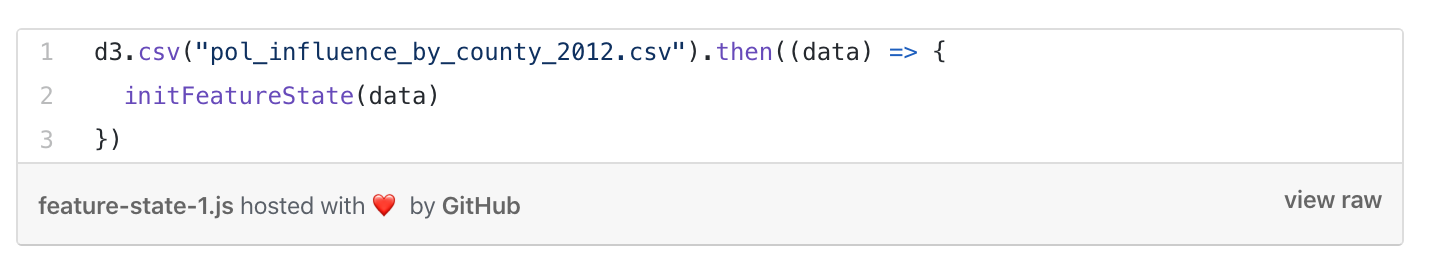
First, load your data at runtime. For this example, I used the d3-dsv library to load my csv like so:
Within the initFeatureState() function, three important steps have to happen for the join to work:
- The vector source for the Albers USA projection must be added and the `promoteId` parameter must be set to the unique identifier of the geometry you wish to join the data to — counties in this case.
- Feature-state should be set using setFeatureState(), with the unique identifier from the csv file matching the one in the geometry and the value used to power the data-driven styling of the fill layer
- The fill layer should use an expression using feature-state to determine the color of the feature
Adding the vector source
Using the addSource() function, add the Albers USA tileset and specify the unique property by which to identify the geometry:
this case, the county_fips property, which contains the FIPS code for a given county, is specified in order to join the 2012 campaign data to the geometry using the equivalent column, which is state_county_code. Remember that county_fips is equivalent to state_county_code. The names of the column/property are just different.
Setting feature-state
In this step, we’re going to set and configure feature-state like so:
Here, I am accomplishing three main tasks:
- source: ‘albersusa’: I am specifying the source (and source-layer) of the geometries (albersusa) on which to set feature-state
- id: I am setting the `id` by which to identify each feature based on the column in my csv file (state_county_code)
- per_capita_contributions: I am defining the actual feature’s state (per_capita_contributions). Note that the name of the state isn’t dependent on anything. You could call it “contributions” or “color_fill”, as long as you use the same variable name when initiating the layer.
- per_capita_contributions: row.per_capita_contributions: I am assigning a value to the `per_capita_contributions` state which is the dollar amount in the per_capita_contributions column of my csv file.
If you log the feature in the console, it should look like this:
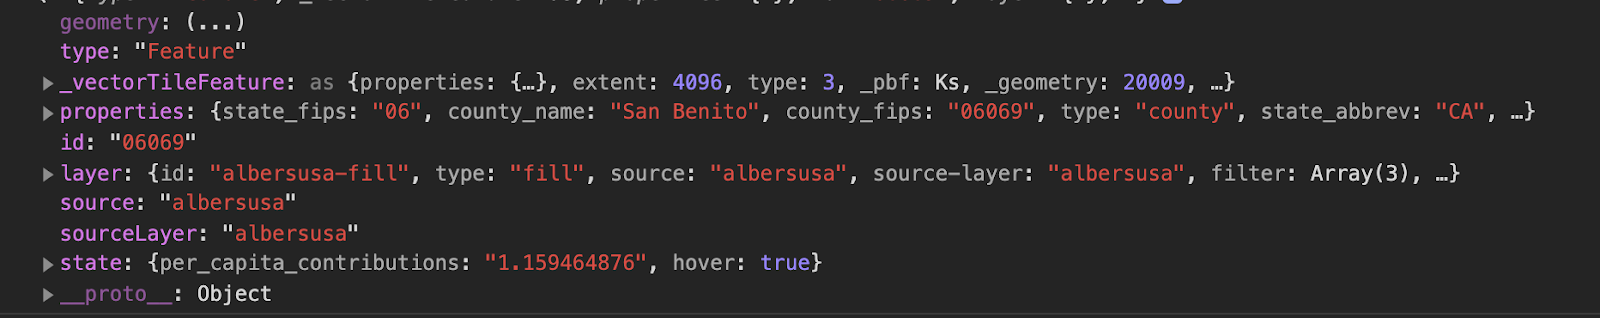
As you can see, the feature id is the same as the county FIPS and the per_capita_contributions state gets the value assigned properly.
Next, we need to set up the expression to style the fill color of our map
Data-driven styling

To style our map, we’re using a case expression. In plain English, this is what we want to accomplish:
“If, for a given county, the feature-state called ‘per_capita_contributions’ doesn’t have a value, then use the color grey, otherwise, use the color ramp defined based on the value of the contribution”
The code is as follow:
Additionally, I am setting ‘filter’: [‘==’, [‘get’, ‘type’], ‘county’] to filter out the states and only show the counties. View the full code and live demo here.
Follow this guide to add your own data to our reprojected Albers USA map style or use it for live reporting. Share what your building with us on Twitter using #builtwithmapbox and if you have any questions reach out to at lo@mapbox.com or on Twitter, Lo Bénichou


Related articles

Tour Osaka in 3D with Mapbox Standard

One Attribute to Rule Them All