Improved data visualizations and flexible map styling for weather organizations
Mapbox now offers full platform support for raster weather data to more efficiently process and render dynamic, engaging weather visualizations

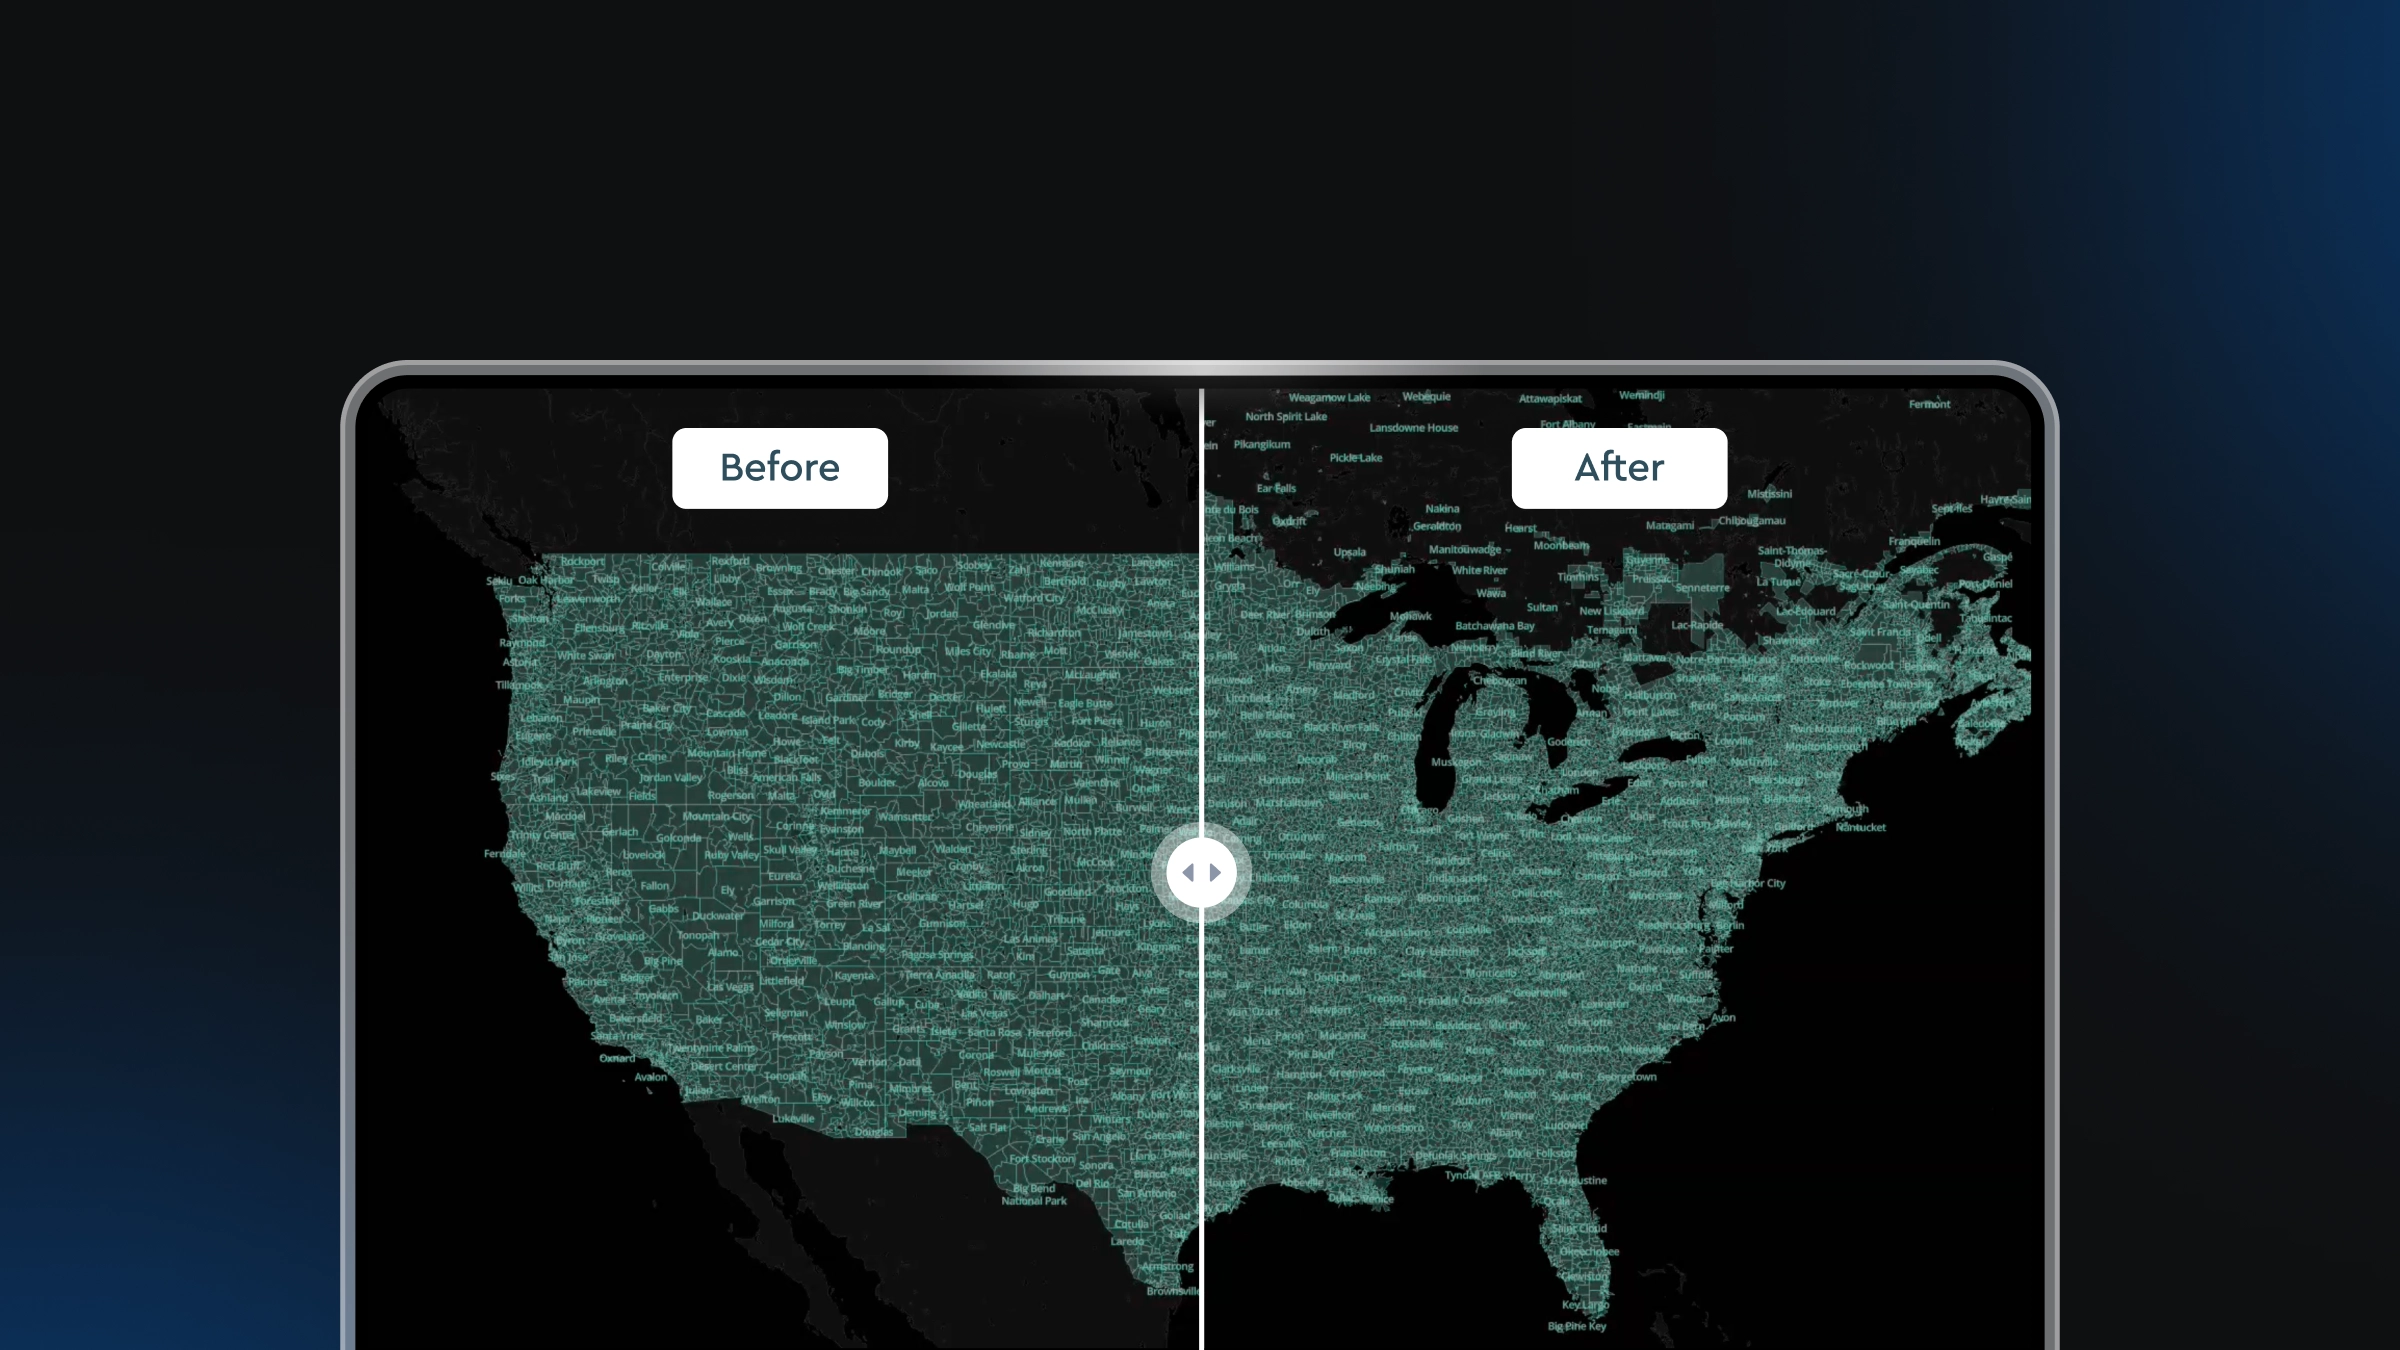
New processing, styling and rendering capabilities for high-precision raster weather data are now available with Mapbox. Weather organizations now have more flexibility and control over their weather data, can offer more visually appealing and engaging weather maps, and can drive savings on time, resources, and costs.
Full platform support for raster weather data
Many Mapbox customers and weather organizations work with data in gridded raster format. The wealth of numerical data contained in these grids is most efficiently visualized and flexibly styled when it is processed and rendered as raster data. So starting today, Mapbox Tiling Service (MTS) now supports the processing and styling of raster weather data.
Added benefits of working with MTS and raster data
The numerical information in the gridded raster data, like temperature degrees or humidity percentage, now persists from processing to render. This data can be queried at run time for dynamic colorization or point querying, creating more visually appealing, interactive and engaging weather maps.

MTS also eliminates the need for Mapbox customers to invest in their own infrastructure for tiling weather data - saving time, cost and resources. With MTS, they can migrate to a single tech stack and pipeline for raster and vector data and let Mapbox handle processing and hosting. This can save hundreds of hours of valuable engineering resources and hundreds of thousands of dollars in building and/or maintaining a proprietary processing pipeline. Once data is processed into tilesets, it's available to be used across the Mapbox platform and turned into world-class visualizations.
Dynamic colorization
Since raw pixel values are stored, colorization can happen dynamically at runtime rather than needing to reprocess a tileset when it’s useful to change the color of visualizations. This opens up the possibility for localized color ramps based on user view area or zoom level, the visual selection of value ranges based on user behavior, or dynamic colors changing over time. To support this greater control and styling, we’ve created a new source type, `raster-array`, and we’ve added new fields in GL JS and GL Native to control these color settings, which can be controlled as such:
map.addLayer({
    id: 'precipitations',
    source: 'precipitations',
    'source-layer': "Total Precip",
    type: 'raster',
    slot: 'top',
    layout: {},
    paint: {
        'raster-opacity': 0.75,
        'raster-color-range': [0, 1],
        'raster-color': getRasterColor(PARAMS.colorScale),
        'raster-resampling': 'linear',
        'raster-color-range-transition': { duration: 0 },
        'raster-fade-duration': 0
    }
});
Studio
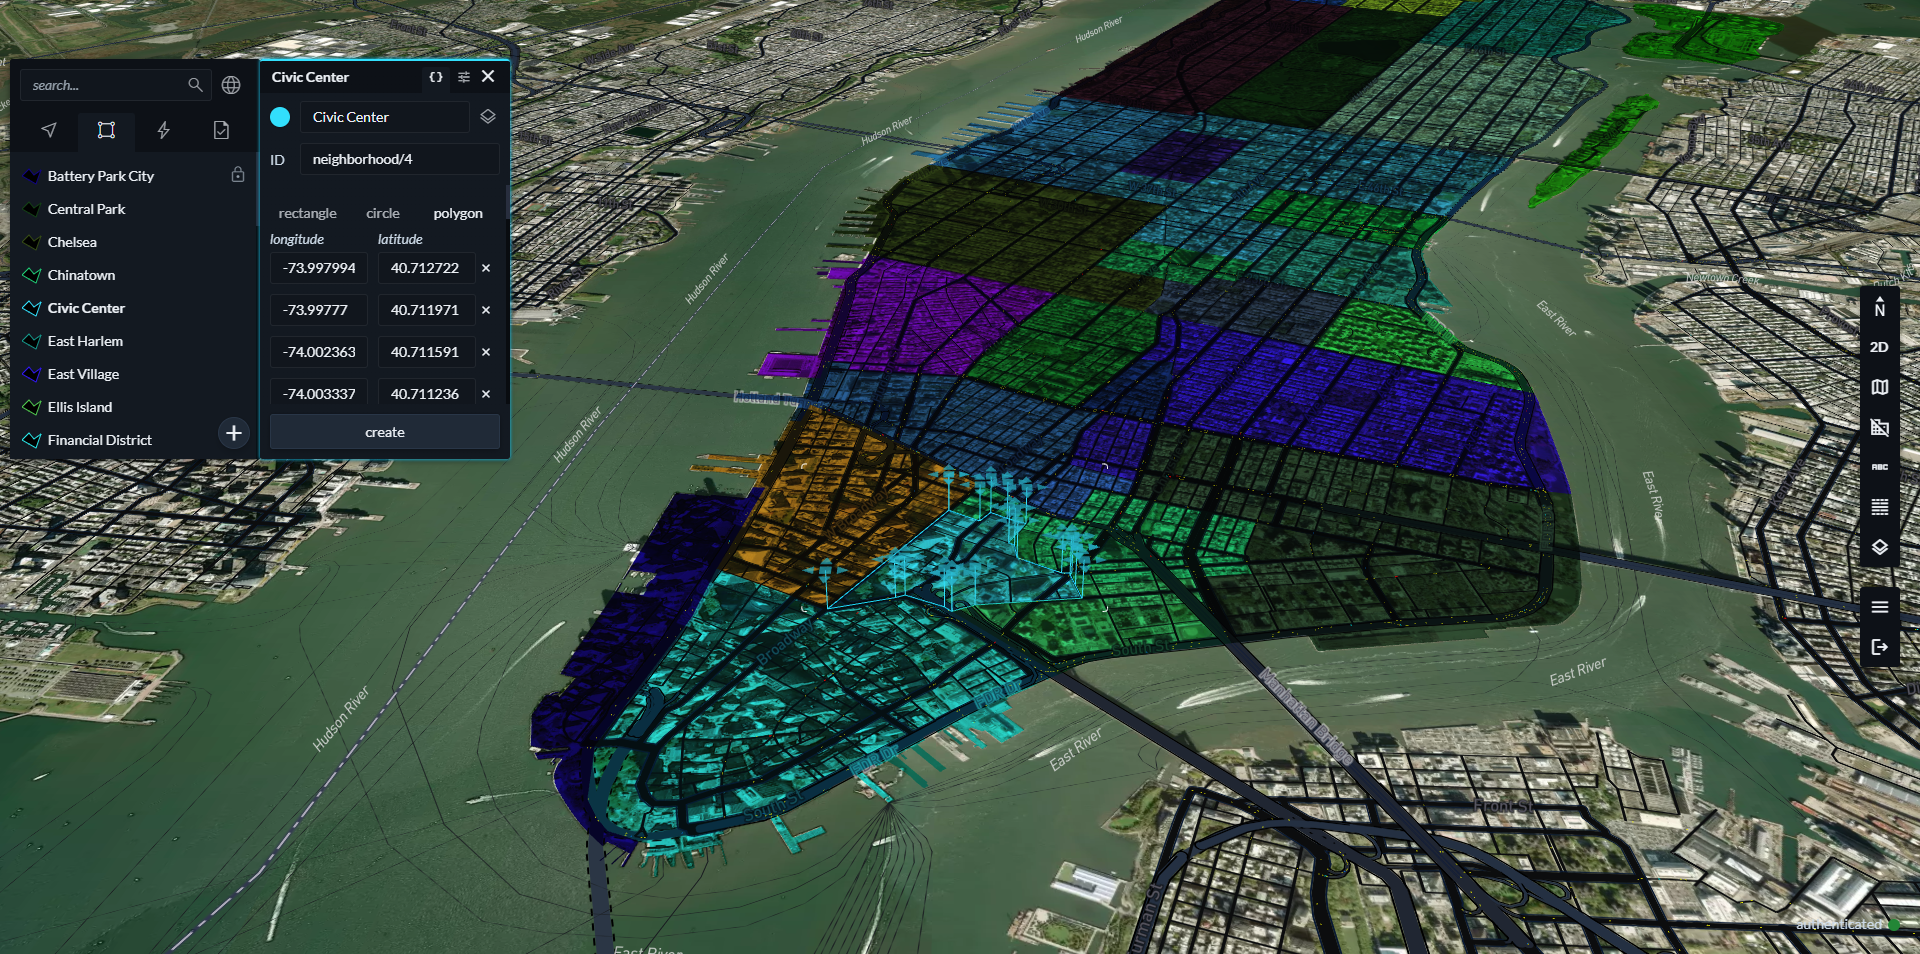
Like all Mapbox Styles, raster array sources can be created, edited, and shared using Mapbox Studio. Mapbox Studio provides a graphical interface that allows you to apply pre-set color palettes, create custom color gradients, manually edit colors, preview bands within the tileset, and more. Combined with the rendering improvements, these features allow you to get started in minutes or spend time fully customizing your raster data before it hits the map.


Updated Tilequery API
To give users greater access and insight into their raster data, we’ve updated the Tilequery API to support raster tilesets. The Tilequery API now allows you to retrieve data values from specific locations within the raster tileset programmatically, without building a map. This is useful in data pipelines, data stream processing, and other server-side applications.
import requests

response = requests.get(
    "https://api.mapbox.com/v4/mapbox.temperature-raster-tileset/tilequery/40,-105.json",
    params={
        "layers": "temperature,wind_speed",
        "bands": "1708304400,1708311600",
    }
)

data = response.json()
{
"type": "FeatureCollection",
"features": [
{
"type": "Feature",
"geometry": {
"type": "Point",
"coordinates": [40, -105]
},
"properties": {
"val": 32.6,
"tilequery": {
"layer": "temperature",
"band": "1708304400",
"zoom": 4,
"units": "C"
}
}
},
{
"type": "Feature",
"geometry": {
"type": "Point",
"coordinates": [40, -105]
},
"properties": {
"val": 2.57,
"tilequery": {
"layer": "wind_speed",
"band": "1708304400",
"zoom": 4,
"units": "m/s"
}
}
}
...
]
}
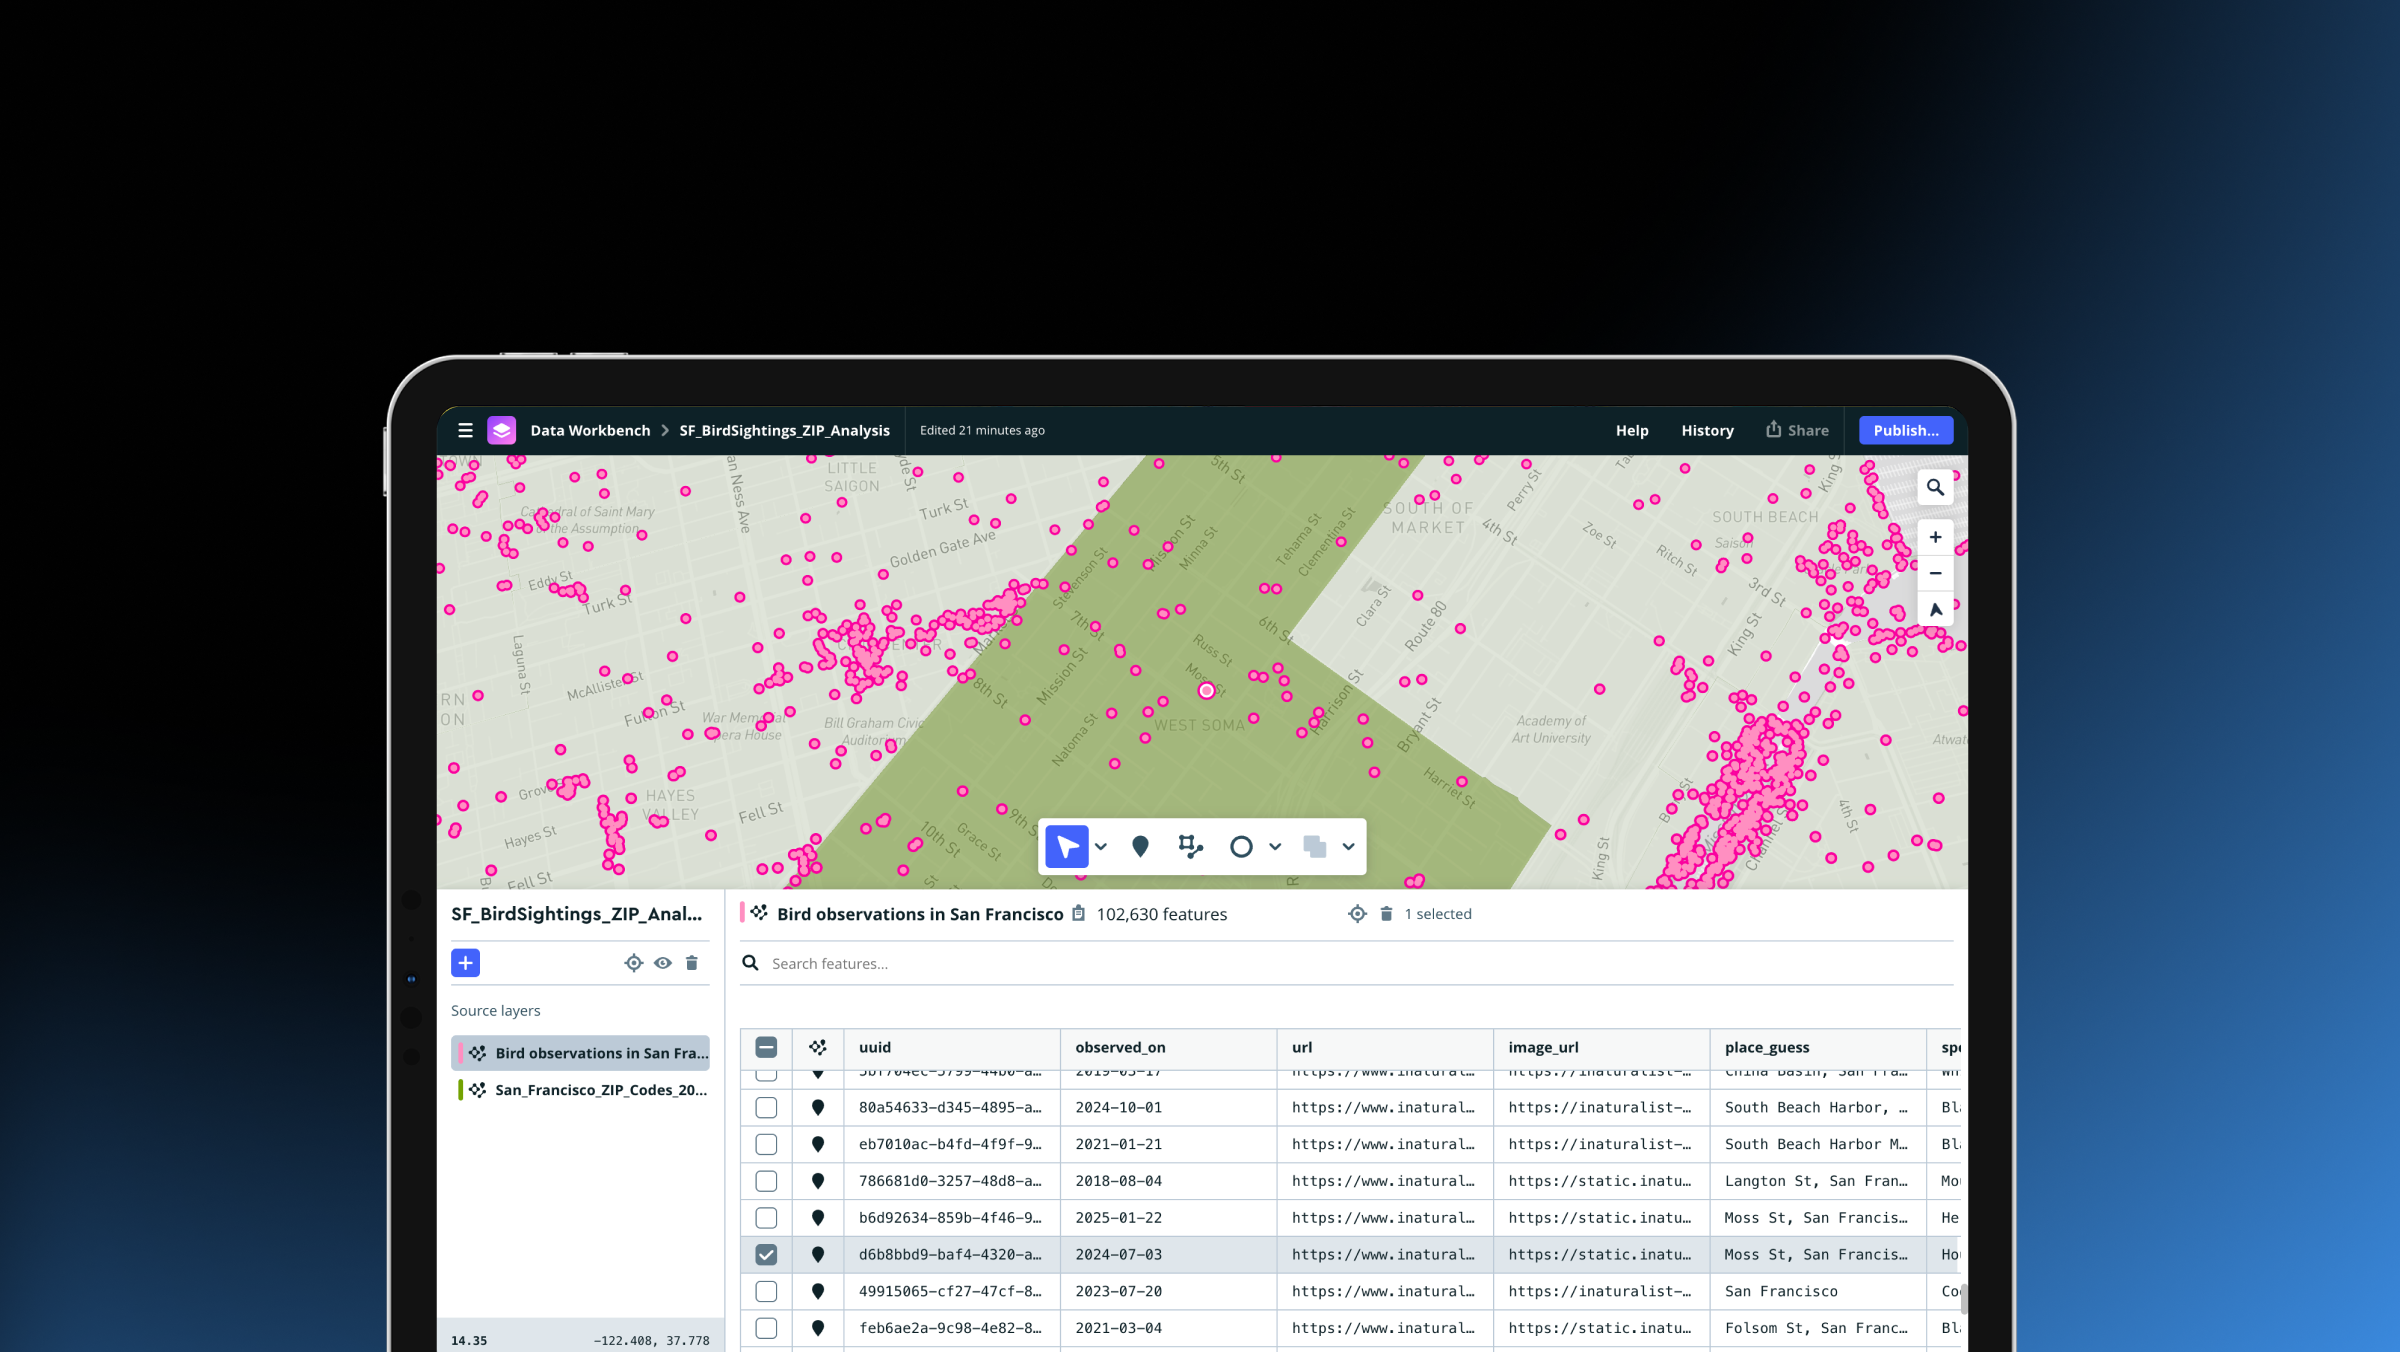
Working with raster tilesets also allows for client-side querying of pixel values within an application. For example, users can set thresholds for which temperature ranges to display, or click on the map and be served the temperature in an exact location:
.gif)
Particle Animation
An exciting feature coming soon is the ability to animate raster particles. This is especially useful for data that includes multiple attributes, such as magnitude and direction of wind, waves, and ocean currents. Weather customers participating in the MTS support for raster weather data beta will get access to new releases of our map renderers, GL JS and GL Native for mobile, to take advantage of particle animation and provide feedback on ways to make the functionality better.
Get started with raster
MTS support for raster data is now generally available to all Mapbox customers, with full documentation available on the Mapbox Docs site. For help with accessing the new capability or understanding the documentation, fill out this form and let Mapbox know. A Mapbox representative will then reach out.


Related articles
Drag, drop, edit, publish: A simplified workflow for custom data
Mission-ready mapping: Securely bring together maps, AI, and response