Australia’s Bureau of Meteorology combines Mapbox and ESRI
powering their Murray-Darling Basin Information Project

The Bureau of Meteorology is Australia's national weather, climate and water agency. Its expertise and services assist Australians in dealing with the harsh realities of their natural environment, including drought, floods, fires, storms, tsunami and tropical cyclones. Through regular forecasts, warnings, monitoring and advice spanning the Australian region and Antarctic territory, the Bureau provides one of the most fundamental and widely used services of the government.
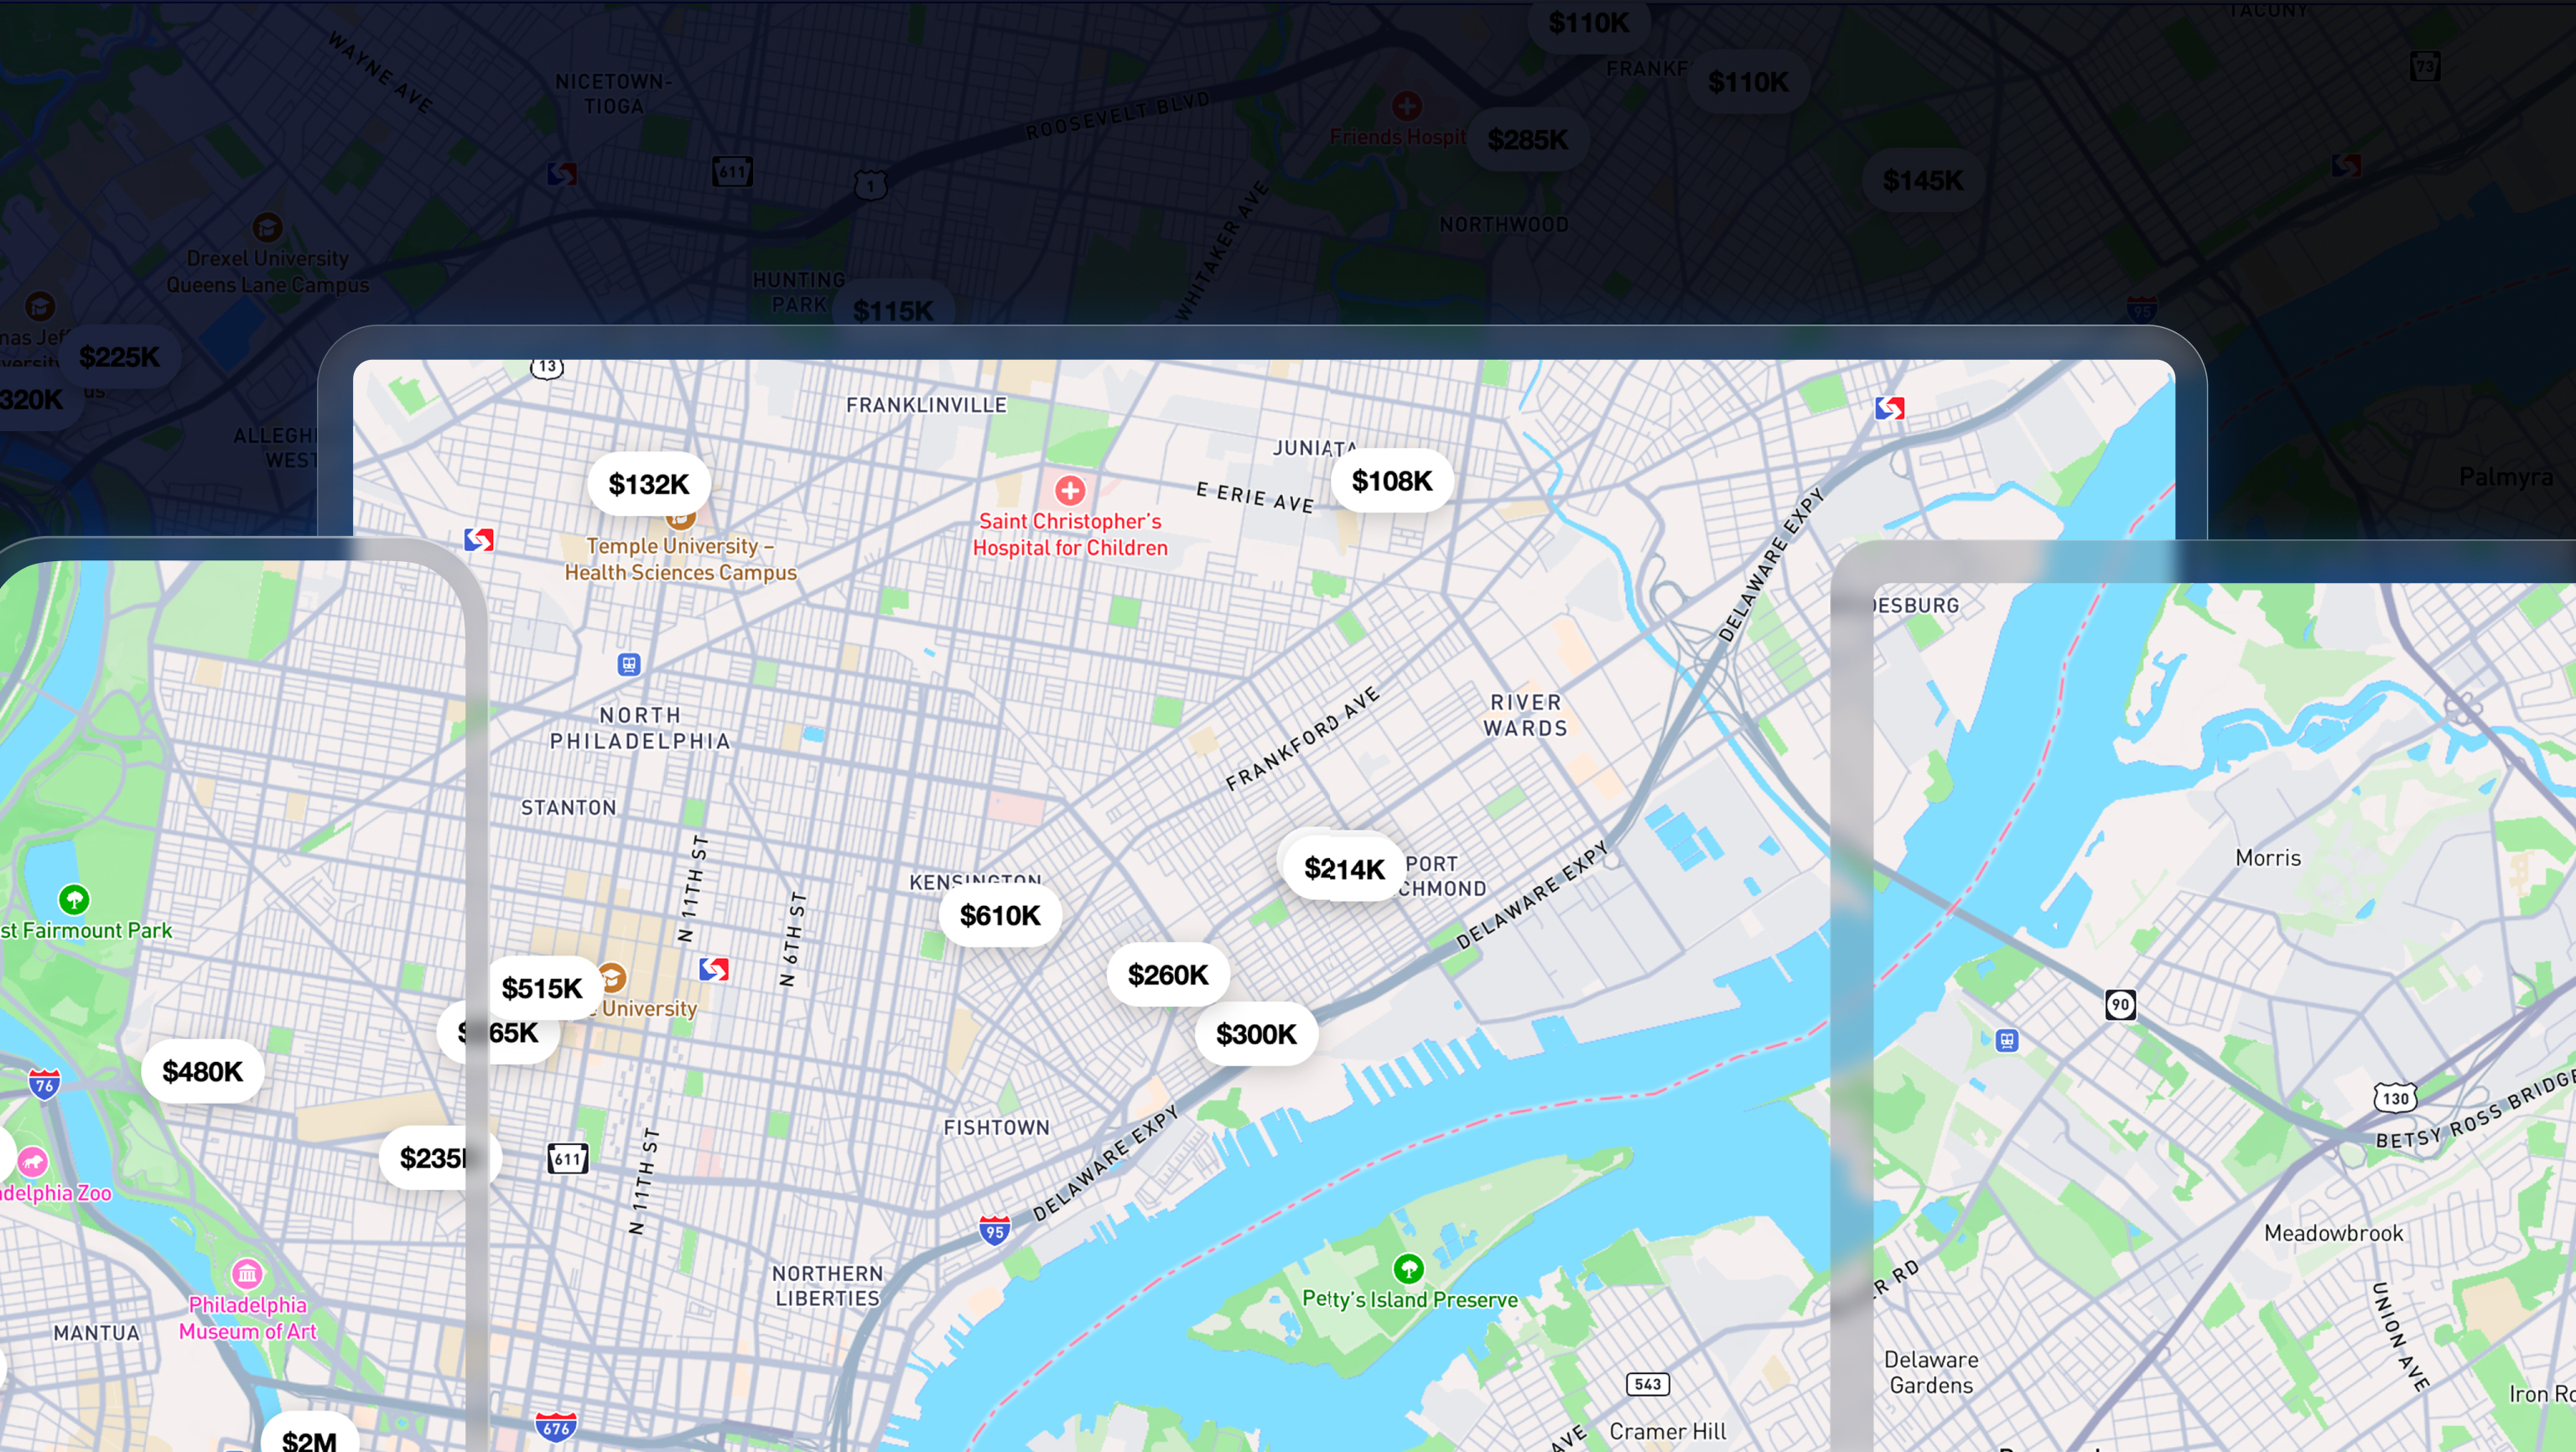
The Bureau of Meteorology (BOM) needed a map to visualize the storage, allocations and trading information for catchments for different regions along the Murray–Darling Basin. Built using React, the map is rendered using react-map-gl component from vis.gl framework, which wraps the Mapbox GL JS library. Mapbox GL JS library provides easy integration to existing ESRI tilesets by providing support for external map tiled source and layers. Both raster and vector tile source are supported.

As BOM describes:
“The Murray–Darling Basin is a large area of south-eastern Australia where water flows through a system of interconnected rivers and lakes. The two main rivers are the River Murray and the Darling River. More than 2.2 million people live in the Basin, including people from 40 different First Nations. It’s home to 16 internationally significant wetlands, 35 endangered species and 98 different species of waterbirds. Around 40% of Australia's agricultural produce comes from the Murray–Darling Basin.”

Learn more about the Murray-Darling Basin at https://mdbwip.bom.gov.au/
The flexible building blocks, customizability, and ease of integration with ESRI convinced BOM that Mapbox is the best partner to render their maps for visualizing the storage, allocations and trading information for catchments for different regions. Mapbox Studio empowered their designers to quickly customize maps with different features and colors. It enabled their web development team to be extremely productive and launch the portal in the public domain faster.


Related articles
Build once, run everywhere: Web support comes to the Mapbox Maps SDK for Flutter
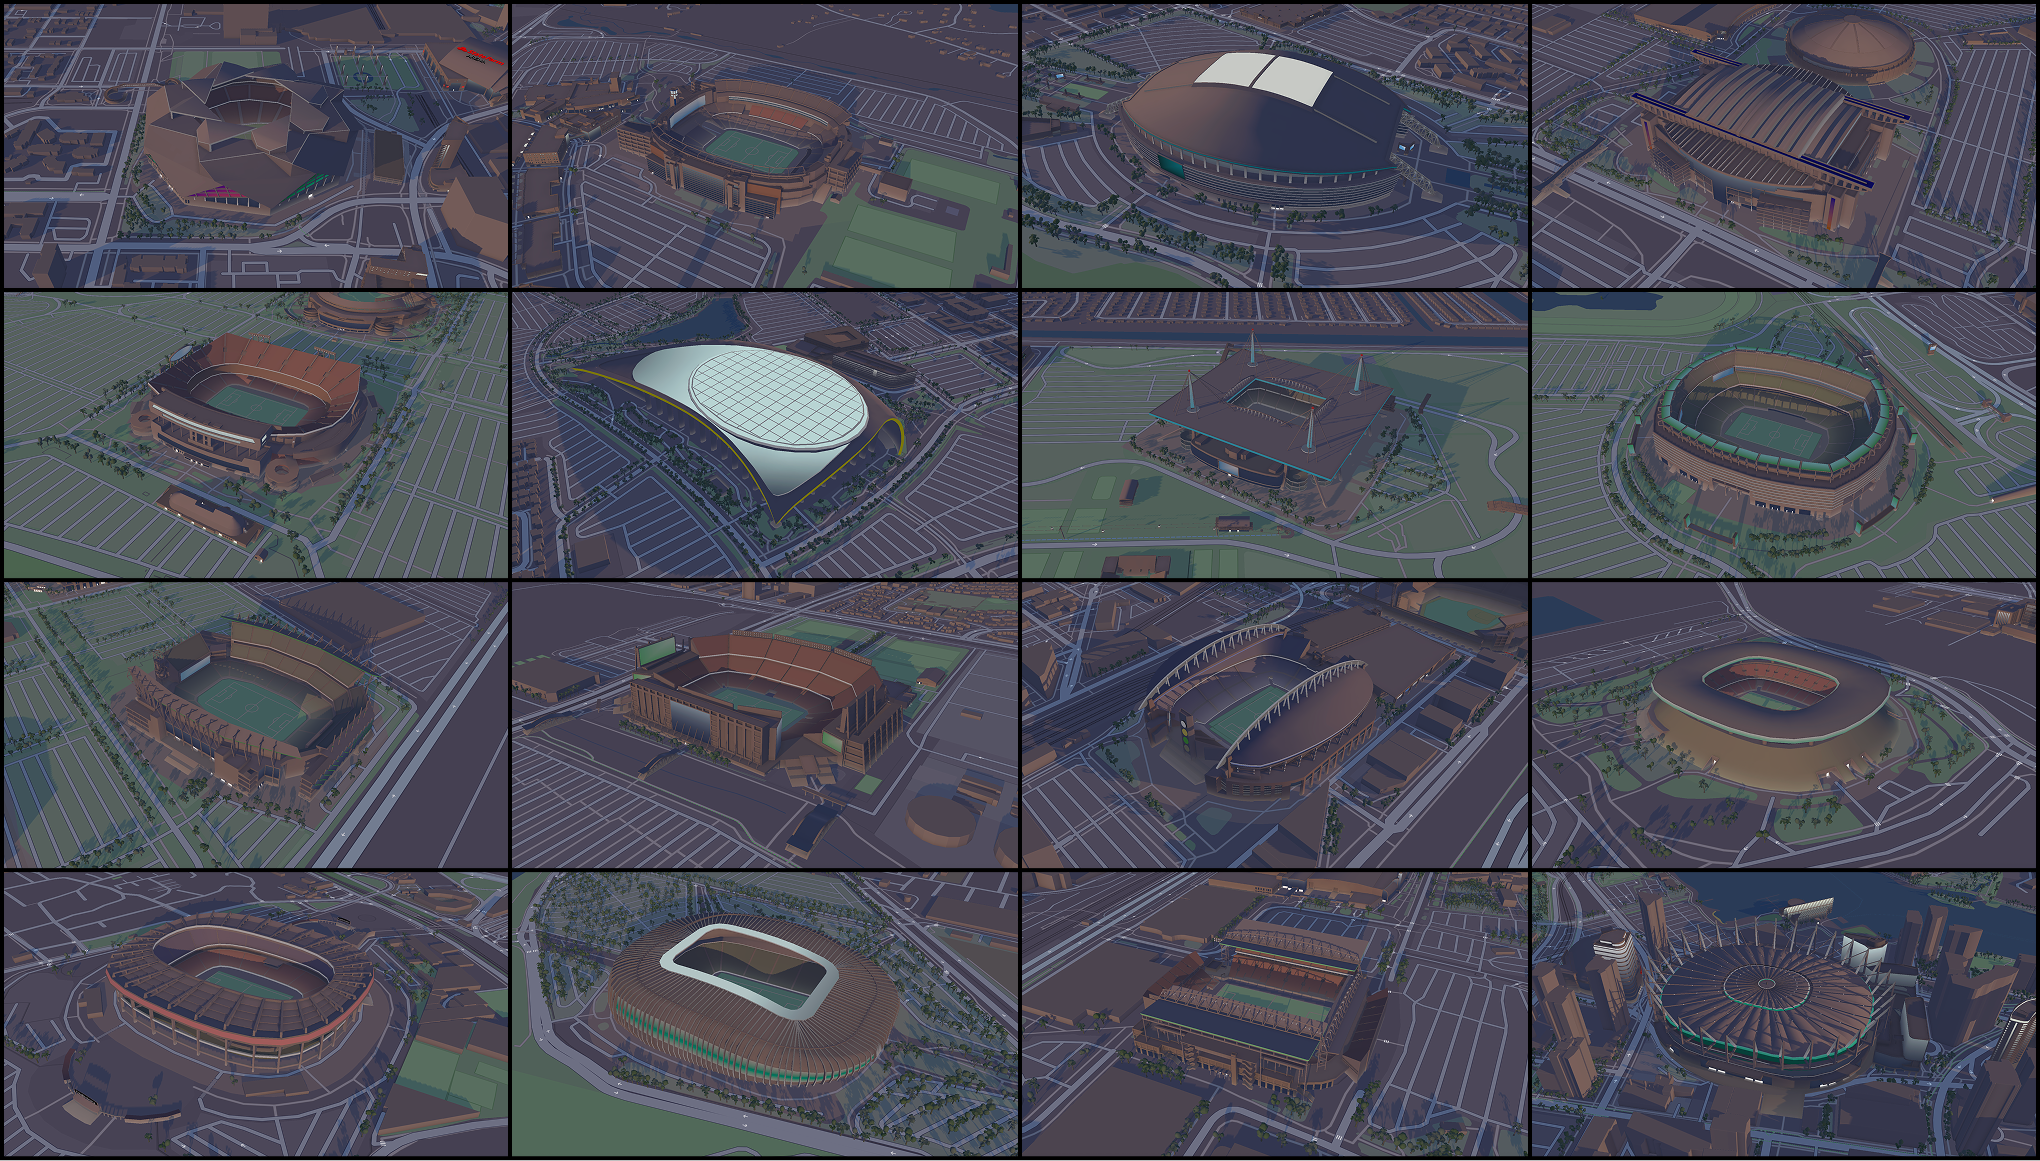
From airports to stadiums, maps are elevating the soccer fan experience