Reimagining projections for the interactive maps era
A deep dive into Adaptive Projections in Mapbox GL JS
Last month, we released Mapbox GL JS v2.6 with Adaptive Projections — a novel way to make interactive maps more accurate on a global scale, without any compromises to user experience, rendering quality or street-level precision.
We have put a lot of thought into making this feature feel seamless and natural, so that our customers could adopt it on all kinds of map apps by adding one line of code. Let’s take a deep dive into why we did it, and how it works under the hood.
Introduction to map projections
Any maps we see on either screen or paper use a certain map projection — a way to represent the globe on a flat surface. This has been a topic of research for at least several thousand years, ever since the ancient Greeks established that the Earth is a sphere. However, one thing is certain — there’s no perfect projection, and any way to map a sphere onto a plane inevitably leads to distortion (with a notable mathematical proof by Euler from 1777).
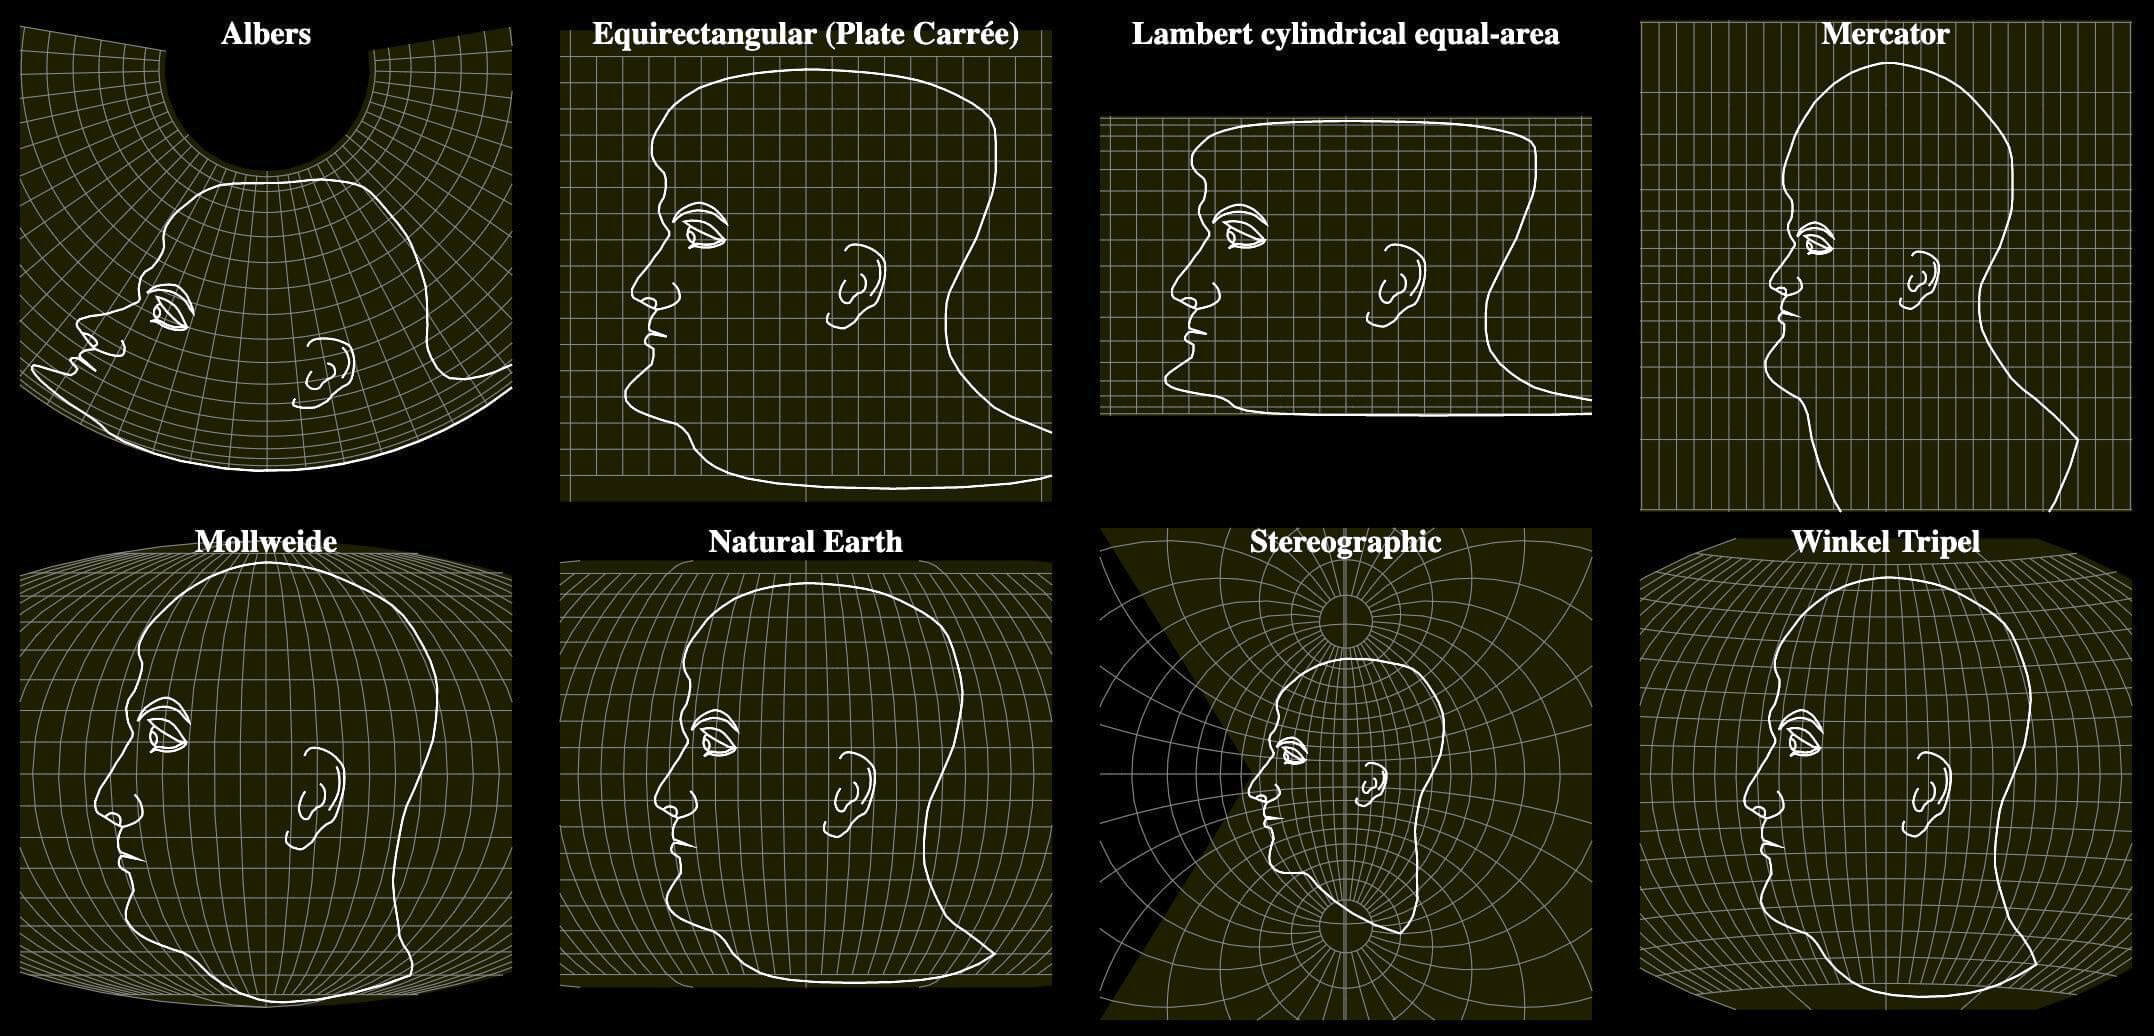
All projections distort shapes, sizes or distances, so choosing one is a matter of trade-offs:
- Some maps need to preserve relative sizes, so that nothing looks bigger than it actually is (e.g. using the Albers projection for country maps or Equal Earth for world maps), but achieving this also requires distorting shapes.
- Some maps need to preserve shapes, which is especially important for navigation (Mercator) and aeronautical maps (Lambert Conformal Conic), but this distorts sizes.
- Compromise projections try to balance both kinds of distortion — not too much shape distortion and not too much size distortion. They aim for something that “looks right”, and are often used for visualizations on world maps (Winkel tripel, Natural Earth).
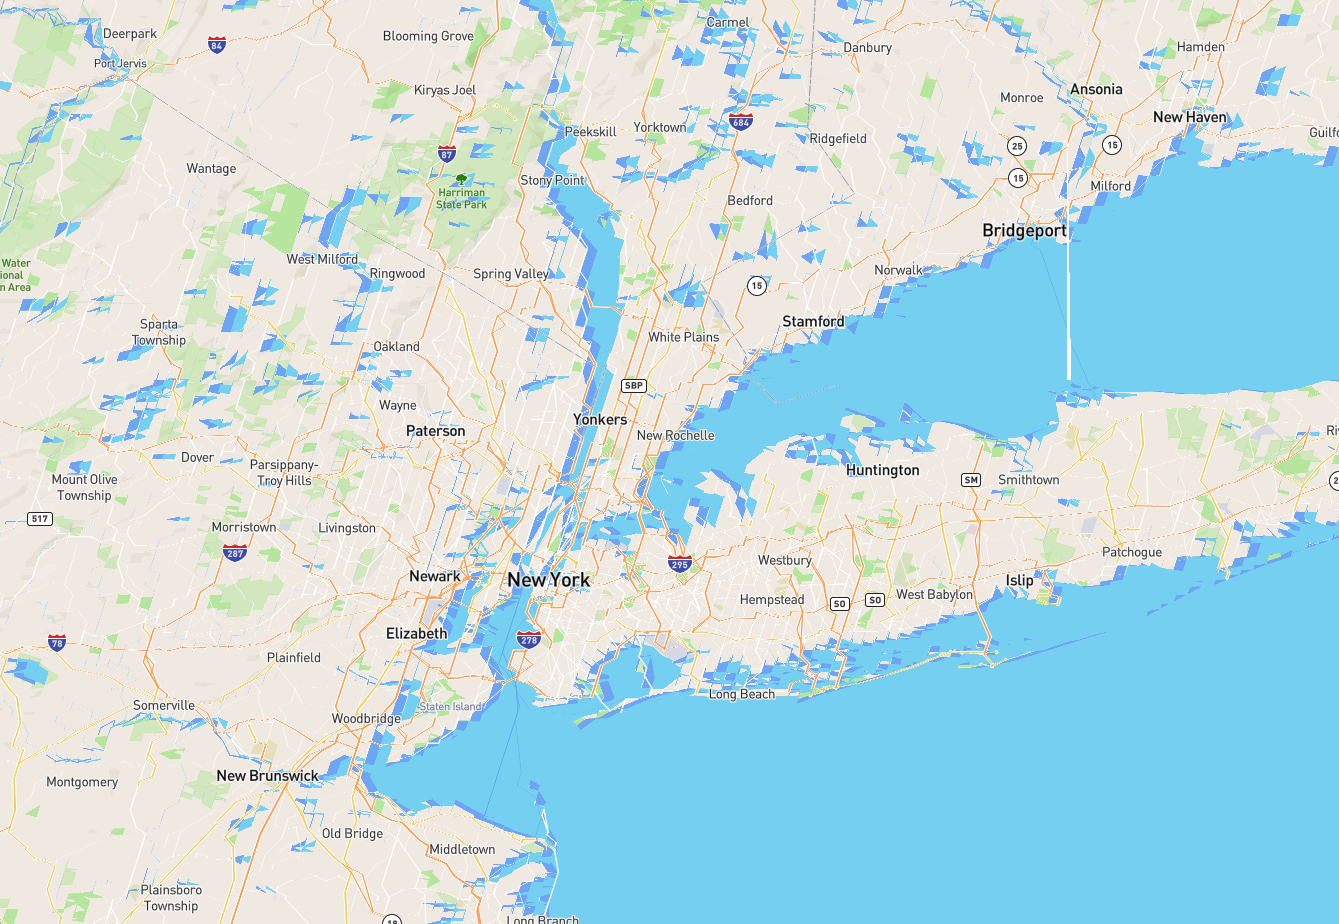
The most famous such trade-off, one we all experience in our daily lives, happened at the dawn of web cartography, which adopted Web Mercator as the projection of choice. At the time, interactive maps were invented for street-level navigation, and Mercator is perfect for this — it preserves angles between lines, avoids stretching of shapes, and makes it so that north is up at any point.

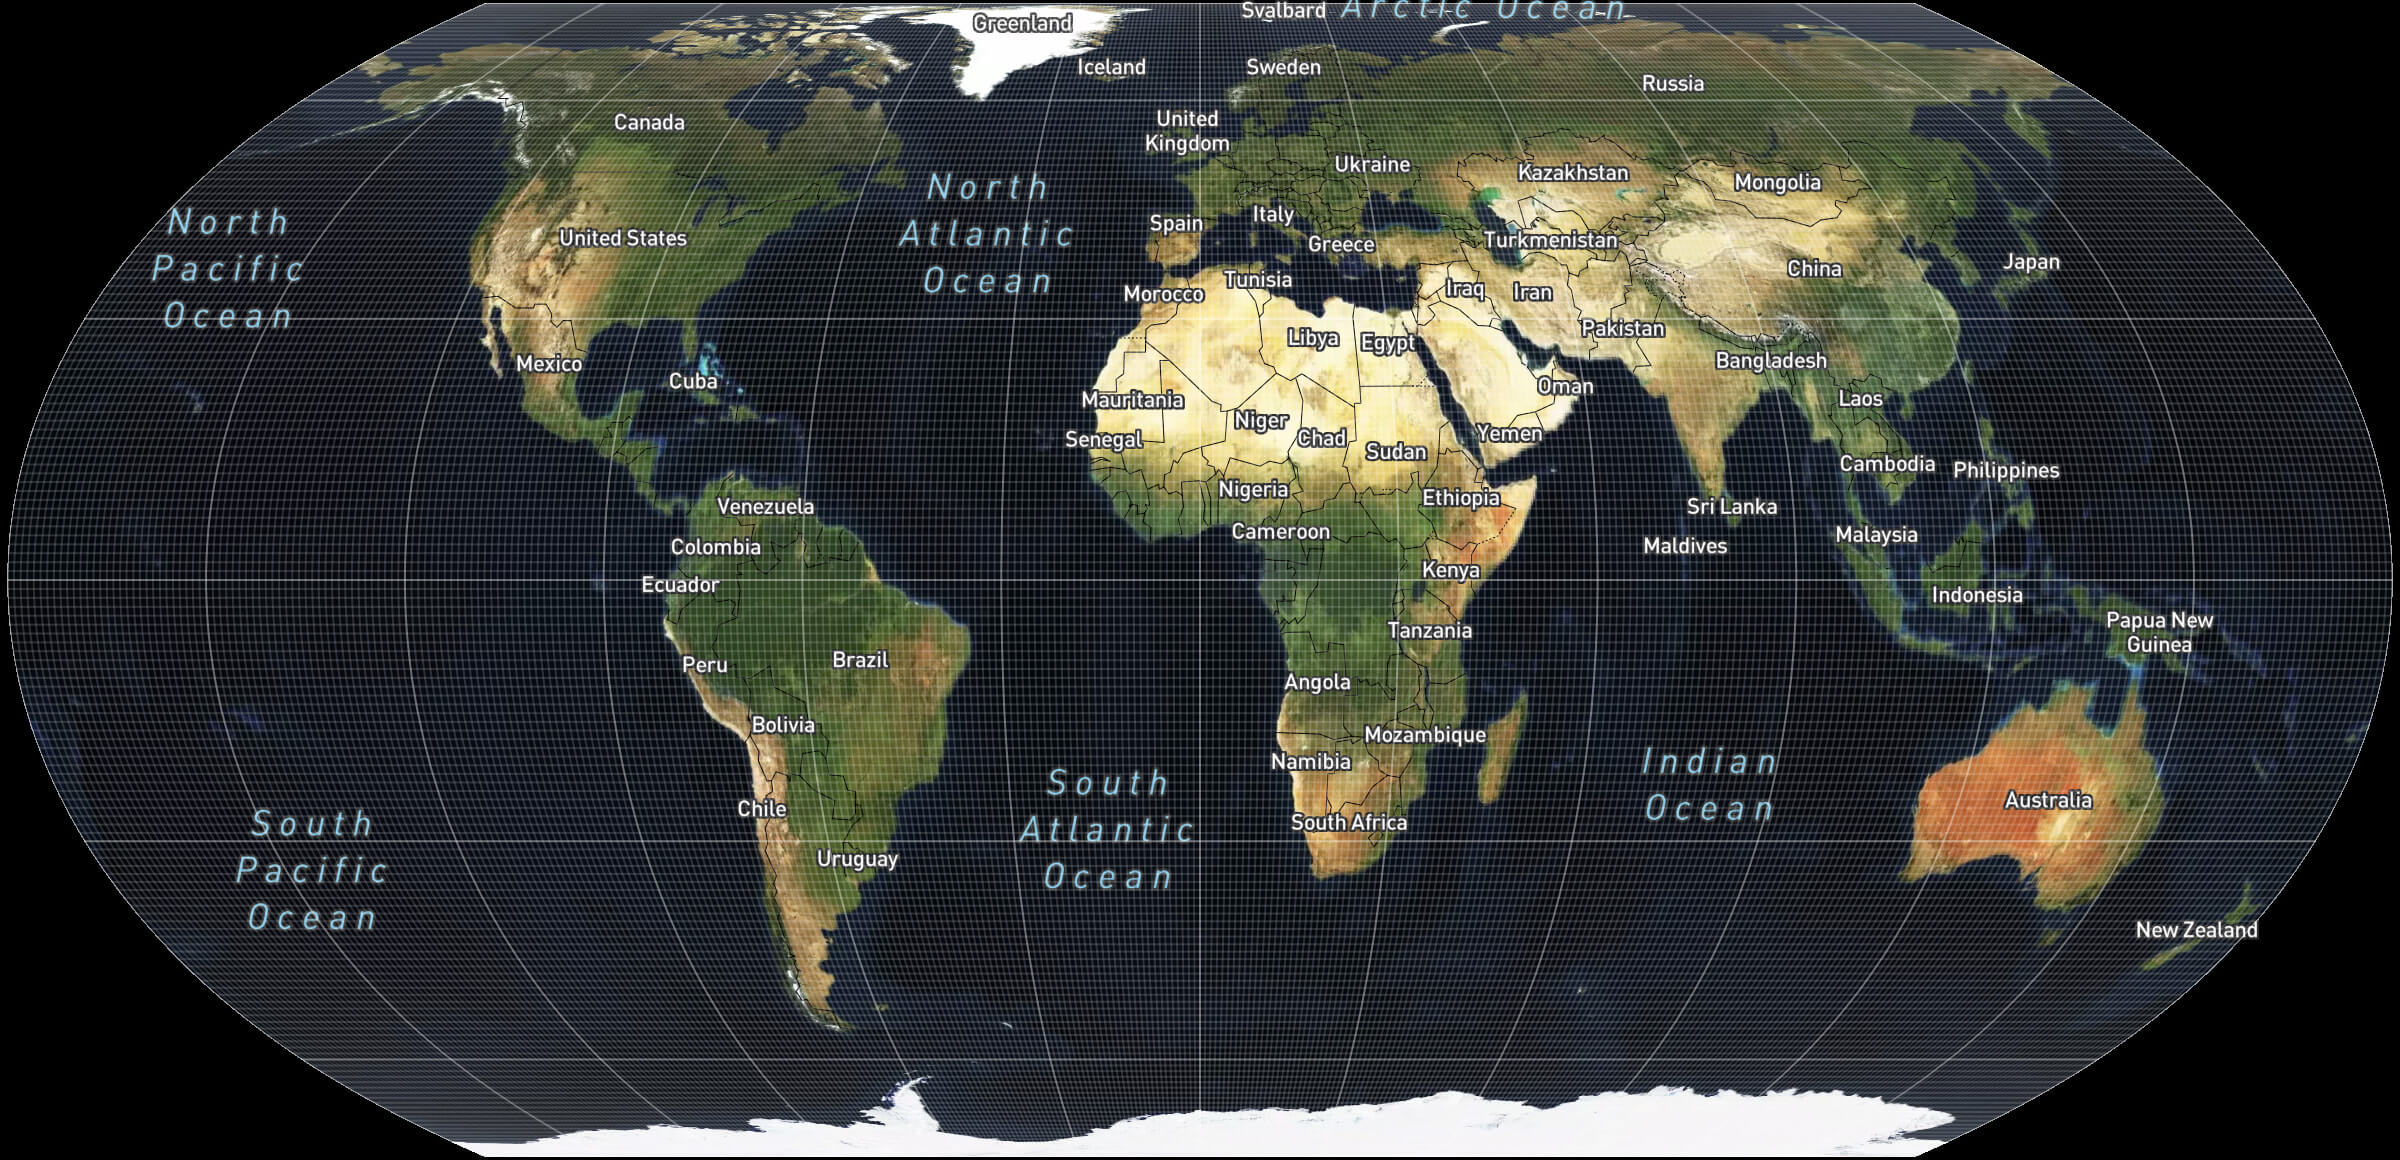
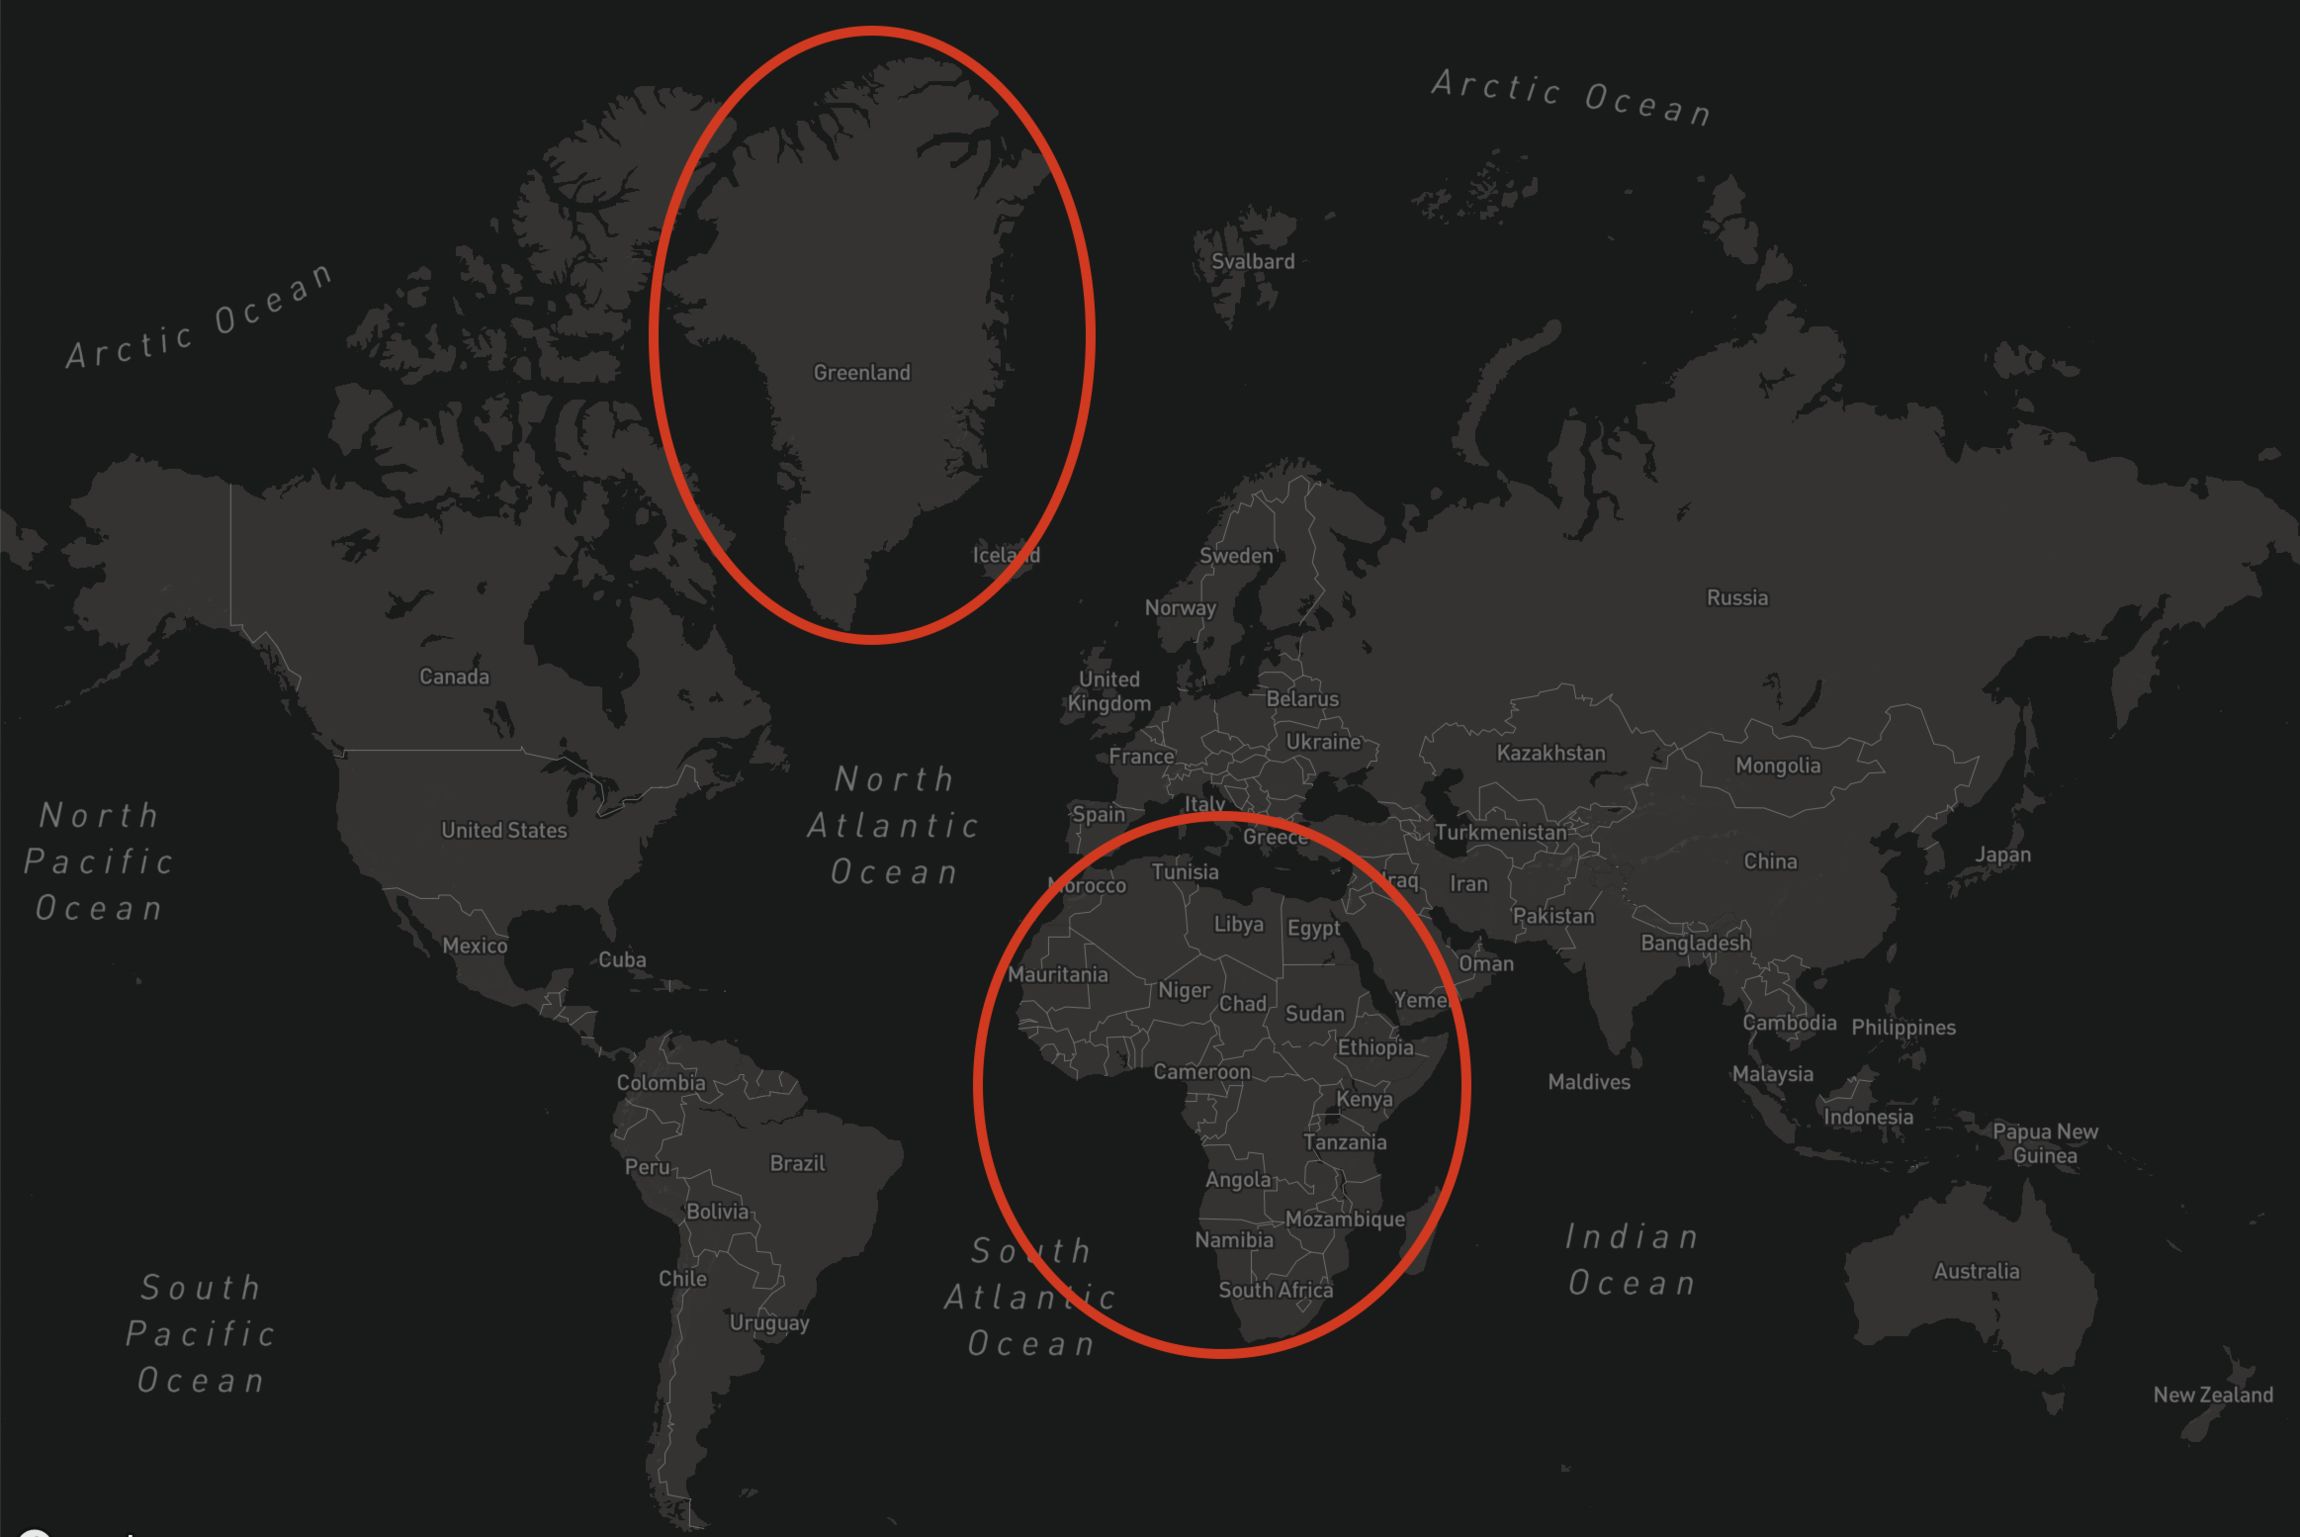
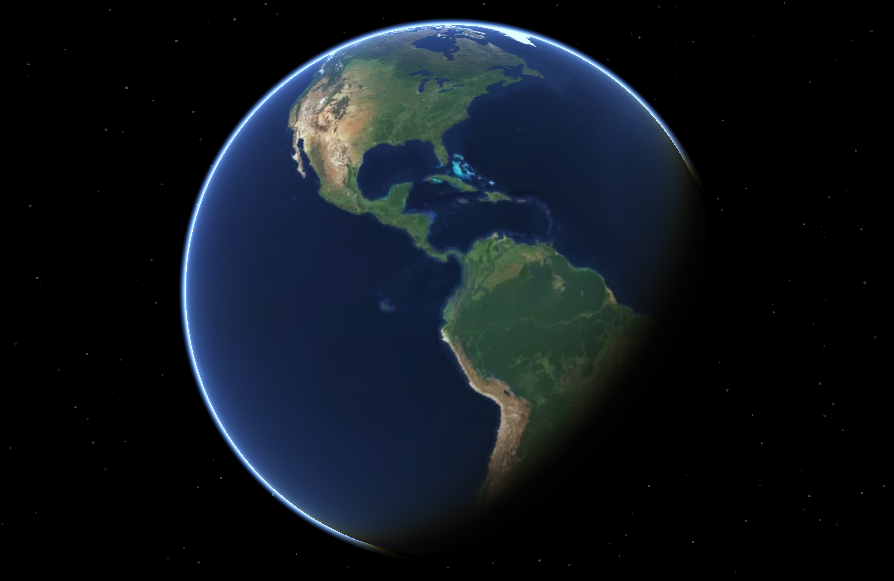
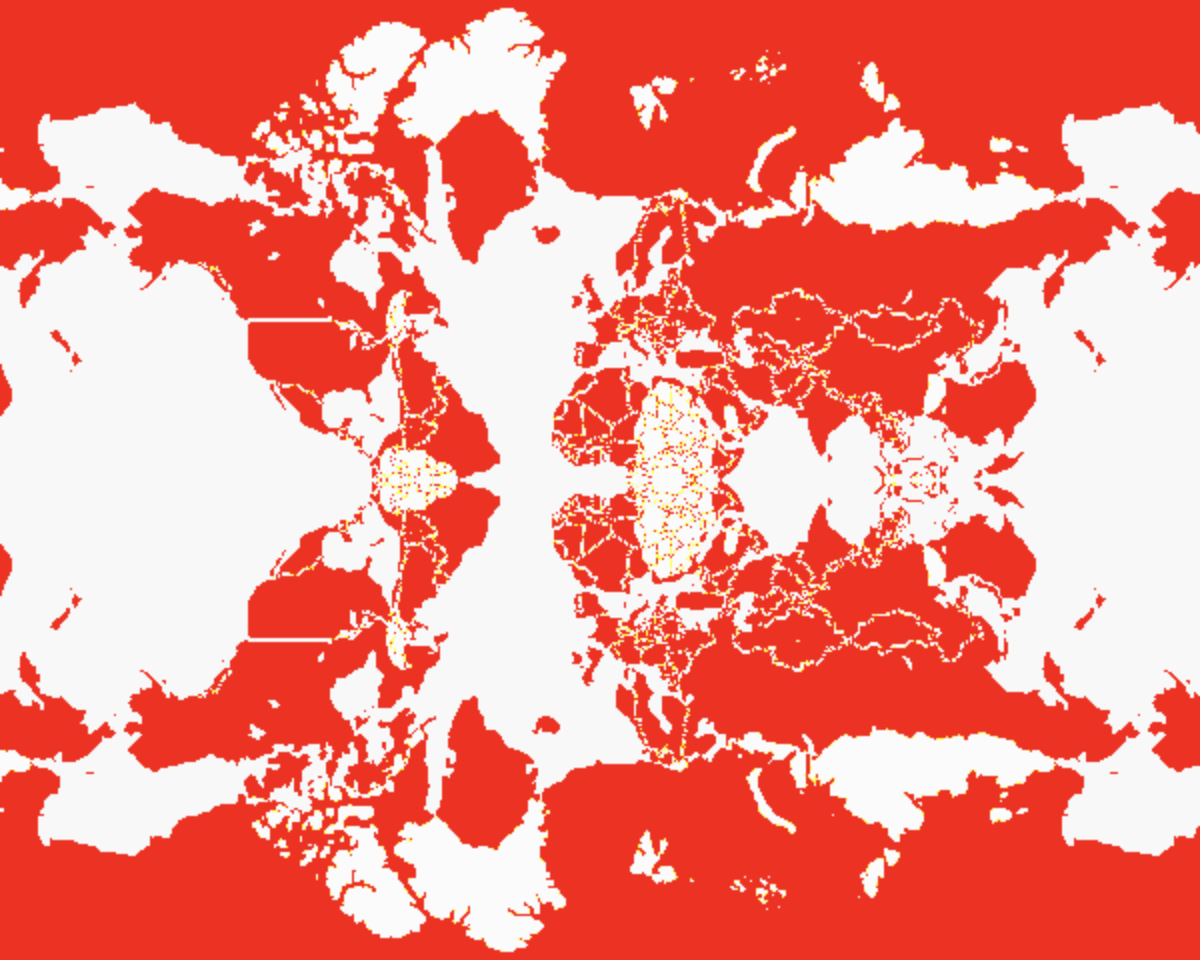
At the same time, Mercator heavily distorts sizes on a global scale, inflating shapes the farther away they are from the equator. This is why so many people living in the Internet era think that Greenland is as big as Africa, even though it's 14 times smaller:
Projections on interactive maps
Even though map projections are one of the fundamental concepts of cartography, adopting non-Mercator projections in interactive mapping has proven incredibly difficult. Despite many passionate campaigns by cartographers and mapping enthusiasts, Web Mercator remains dominant.
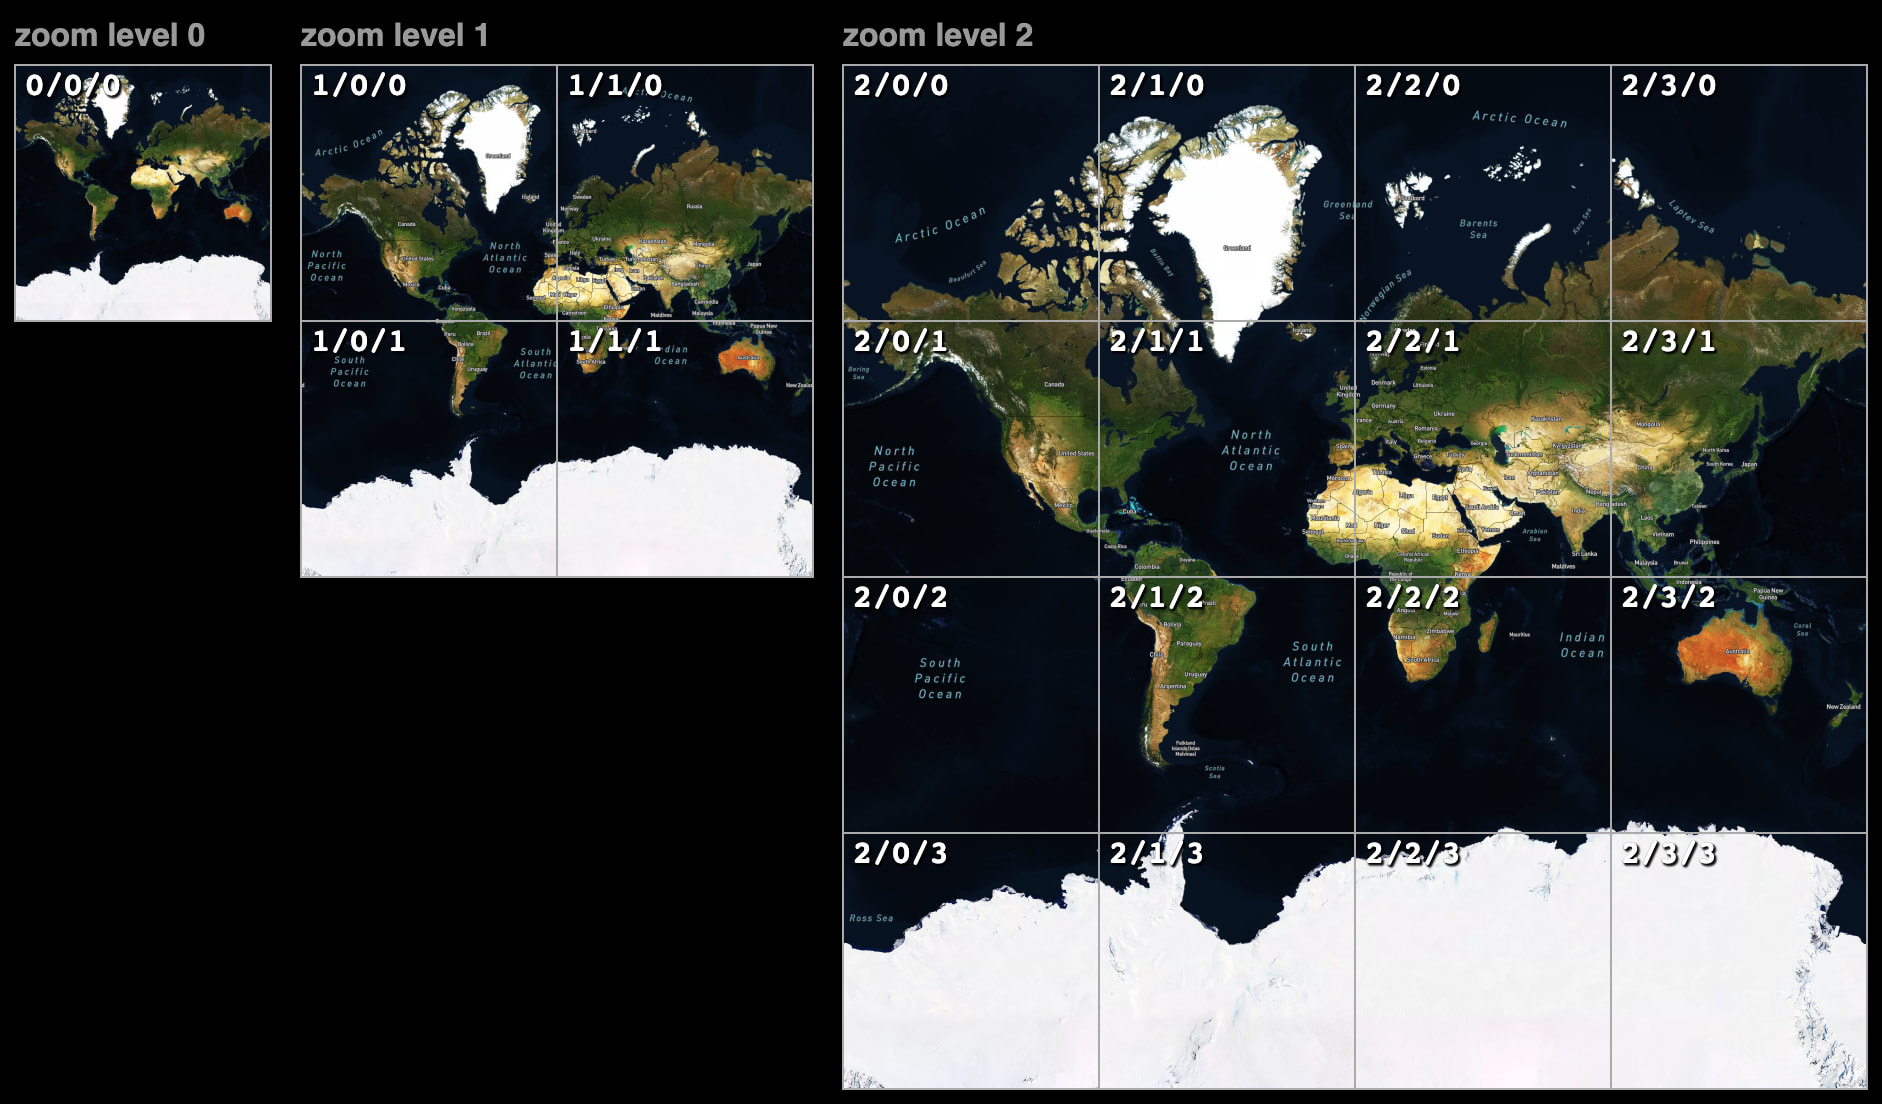
One reason for this is that along with the projection, the maps industry adopted a corresponding tiling scheme, which starts with a Mercator-projected square tile on zoom 0, and splits each tile into four on every subsequent level. This simple and efficient format for distributing map data became ubiquitous.
Consequently, to use another projection,all the data would have to be reprocessed into differently projected tiles, but this is enormously expensive — for example, Mapbox generates tiles for its base map styles up to zoom 16, which is 5.7+ billion tiles. Generating separate tile sets for each possible projection for every dataset would be impractical.
Reprojection of raster map tiles is often not an option because text labels would get distorted, and sharp lines and icons would become blurry.
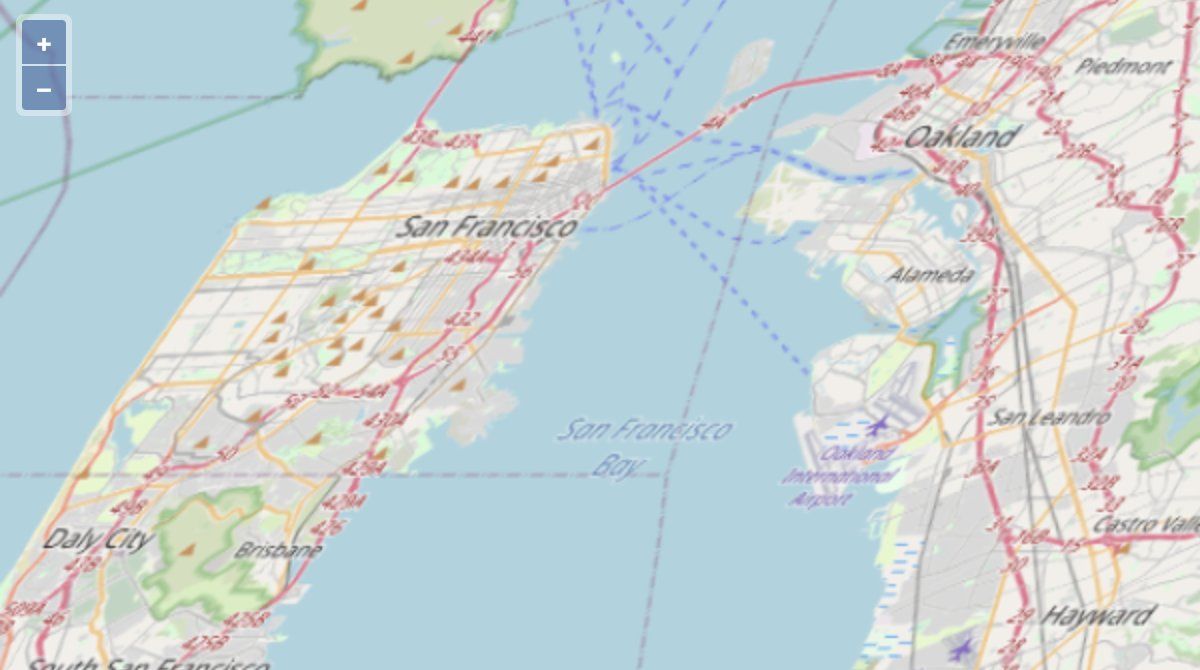
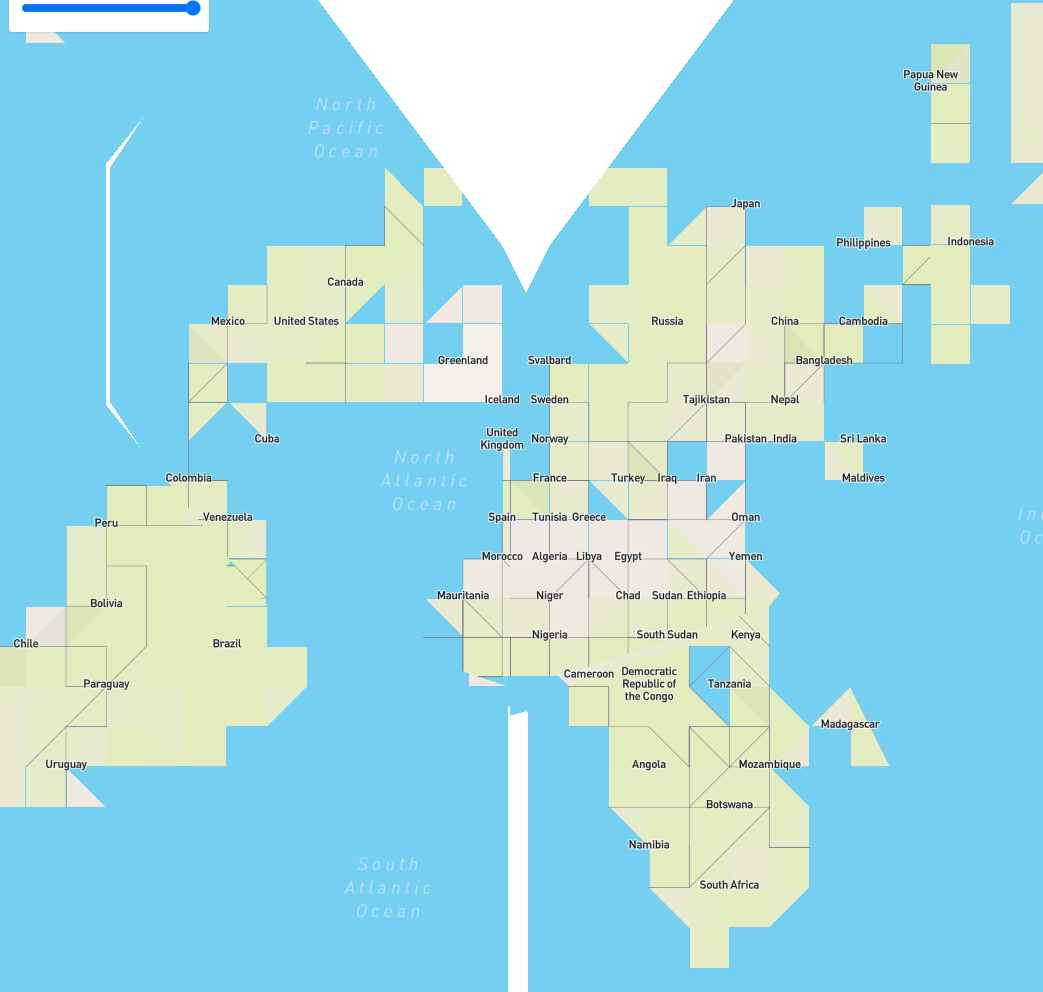
Another fundamental problem when applying map projections to an interactive map is that projections were designed for paper, and don’t work well when users can zoom between a world map and a street-level map. Projections that work well on a global scale are heavily distorted when zoomed in (as seen on this example of the Bay Area in Mollweide), and vice versa (Mercator).
There was a remarkable attempt at adapting map projections for interactive maps by Bernhard Jenny of Oregon State University in 2012. However, it unfortunately remained a proof of concept. The approach required reprojecting geometry on every rendering frame, which would be difficult to scale to modern vector rendering standards that often require rendering millions of points on the screen at once, while keeping compatibility with existing Mercator tiles. Additionally, interacting with a map that has abrupt projection changes may feel disorienting.
Due to all these limitations, non-Mercator projections are a rare sight on regular web maps, instead being mostly confined to purpose-built D3-based visualizations. Advancing vector rendering technology seemed like the only viable path towards wider adoption.
Projections in Mapbox GL JS
Ever since Mapbox changed the maps industry with the introduction of GL JS and its vector rendering technology, we were uniquely positioned to tackle this problem — perhaps the most requested feature in the project’s 8-year history.
When we finally got to work on this, we wanted to do it right. This was our chance to make alternative projections so compelling that there would be no barriers to widespread adoption. And once you commit to a particular design of such a big and complex feature, it’s difficult to change afterwards, so this one shot had to count. We settled on the following guiding principles:
- Compatibility with existing sources and styles, so that anyone can start using alternative projections right away on their Mapbox maps. This required loading Web Mercator tiles and reprojecting the data on the client.
- Vector rather than raster reprojection to keep vector features rendering sharp and precise.
- Dynamically adjusting the projection while zooming in to eliminate distortion.
- Redefining what zoom and bearing mean to make switching to a different projection feel intuitive and seamless.
- Zero overhead for rendering performance, so that maps with alternative projections feel as fast as our usual maps.
Projections and zoom level
One of the first questions we asked when designing projections seems trivial: what does zoom level mean? Historically, for Mercator maps, zoom was defined as 0 for a map with a single tile containing the whole world, with each increment by 1 doubling the size.
With a non-Mercator projection, both the tiles and the world are no longer axis-aligned squares, so we can’t rely on the same definition. But intuitively, we want the zoom value to reflect the scale of features on the map — so that regardless of the projection chosen, a certain map zoom and center configuration would make the map cover approximately the same area, with sizes of shapes relatively the same. We can do that we these steps:
- Take an arbitrary area on the map as a reference point (e.g. a red square below).
- Calculate its size in reprojected coordinates.
- Calculate its size in Mercator coordinates.
- Adjust the projected map scale so that these sizes match.
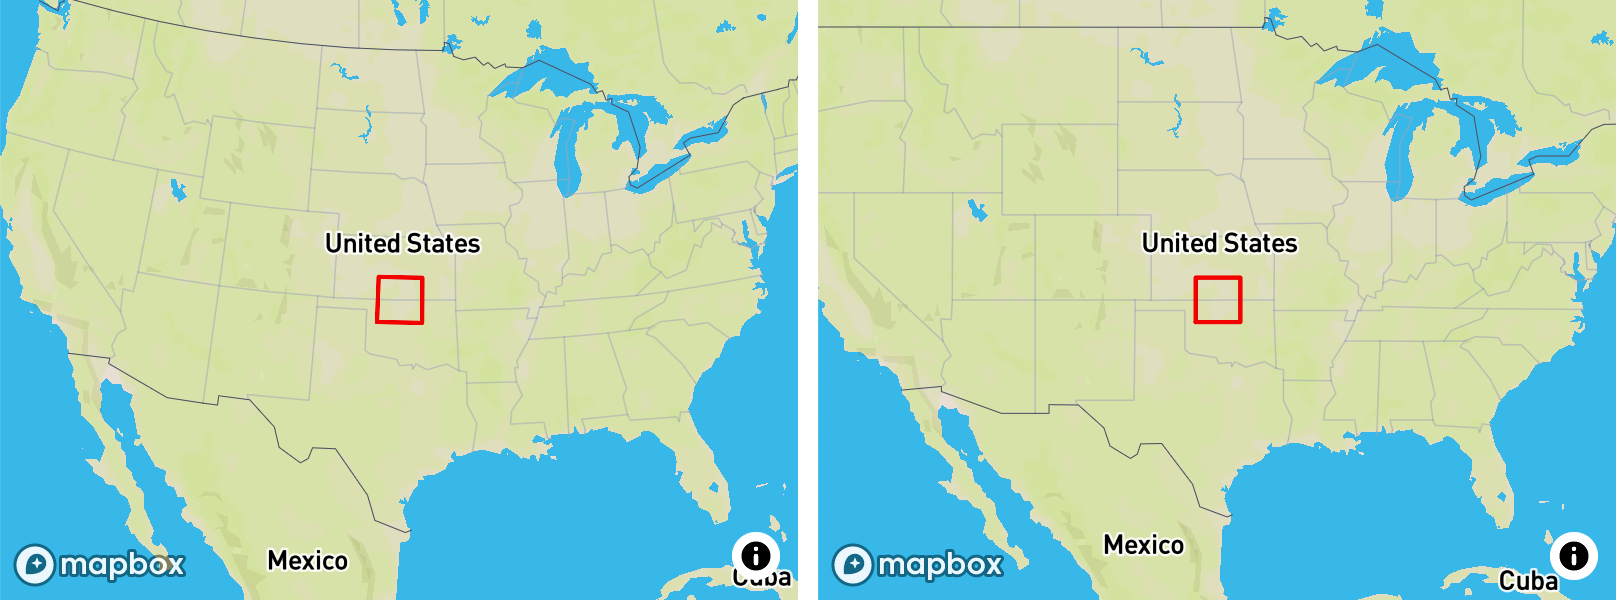
There’s just one catch — which point do we take as a reference? If we use the center of the map view, then the map will visibly zoom as you pan, which feels weird. And if we use a fixed point on the map (e.g. the center of the world), the size discrepancy will grow as the user moves away from that point.
The solution we landed on combines these approaches:
- On low zoom levels, use a fixed point (projection center). This way, the shape of the world remains the same & doesn’t scale during panning.
- On high zoom levels, use the center of the screen. Since panning is limited to a relatively small distance, any scale change will be unnoticeable.
- On middle zoom levels, use both, smoothly transitioning between the two as the user moves from low to high zooms or back.
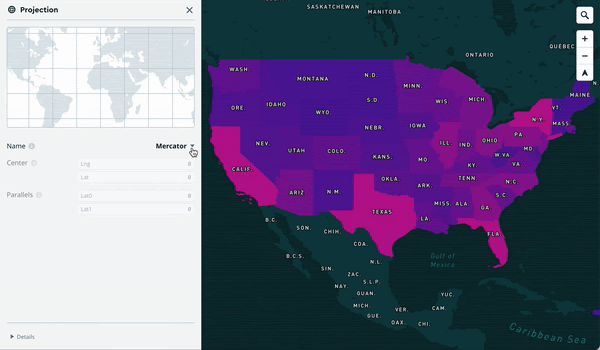
This makes designing maps for different projections and picking the right one a joy:
Projections and rotation
Similarly to zoom, when using interactive maps, we have certain preconceived notions about how a map should be oriented. Conditioned by Mercator, we intuitively expect it to align to the north unless we rotate it. And we expect any given map view configuration (center, zoom and bearing) to have the same orientation regardless of projection.
So we rotate the map automatically to match this intuition in a similar way to zoom:
- On low zoom levels, orient the map so the north is straight up from the projection center. This way the map won’t rotate when panned.
- On high zoom levels, orient the map so the north is straight up from the screen center. This way north is up like in Mercator regardless of which point on Earth is shown, and rotation during panning is unnoticeable.
- On middle zoom levels, smoothly transition between the two approaches.
Correcting distortion when zooming in
After we apply the zoom and bearing adjustments above, one problem remains: when we zoom in, the map is noticeably skewed:
This is a natural property of non-conformal projections like Winkel tripel — it preserves relative sizes of shapes, but meridians and parallels are not perpendicular to each other, so shapes look distorted when zoomed in. How do we correct this?
When you're zoomed in enough, the view represents a nearly flat portion of the Earth. Consequently, alternative projections are no longer necessary, since you don't have to compromise between distorting shape or size. Notice how as the map zooms in, the curves representing meridians and parallels straighten out, approximating straight lines on higher zoom levels. We want to skew the map back so that these lines are perpendicular, and stretch it so that vertical and horizontal distances are equal. This will make the map conformal, matching it nearly perfectly with the Mercator projection.
This skewing/stretching is called an affine transformation, and it can be applied in real time on the GPU by correcting the WebGL view matrix. This way, we can apply the coordinate reprojection once when a tile loads, and then adjust the view of those coordinates as the user zooms without any performance overhead. It also feels much more natural when interacting with a map than more advanced transformations that twist and distort the view non-uniformly.
We do this the same way as with previous corrections — no adjustment on low zoom levels, then smoothly transitioning to full correction as the user zooms in, giving the best of both worlds:
Tile loading changes
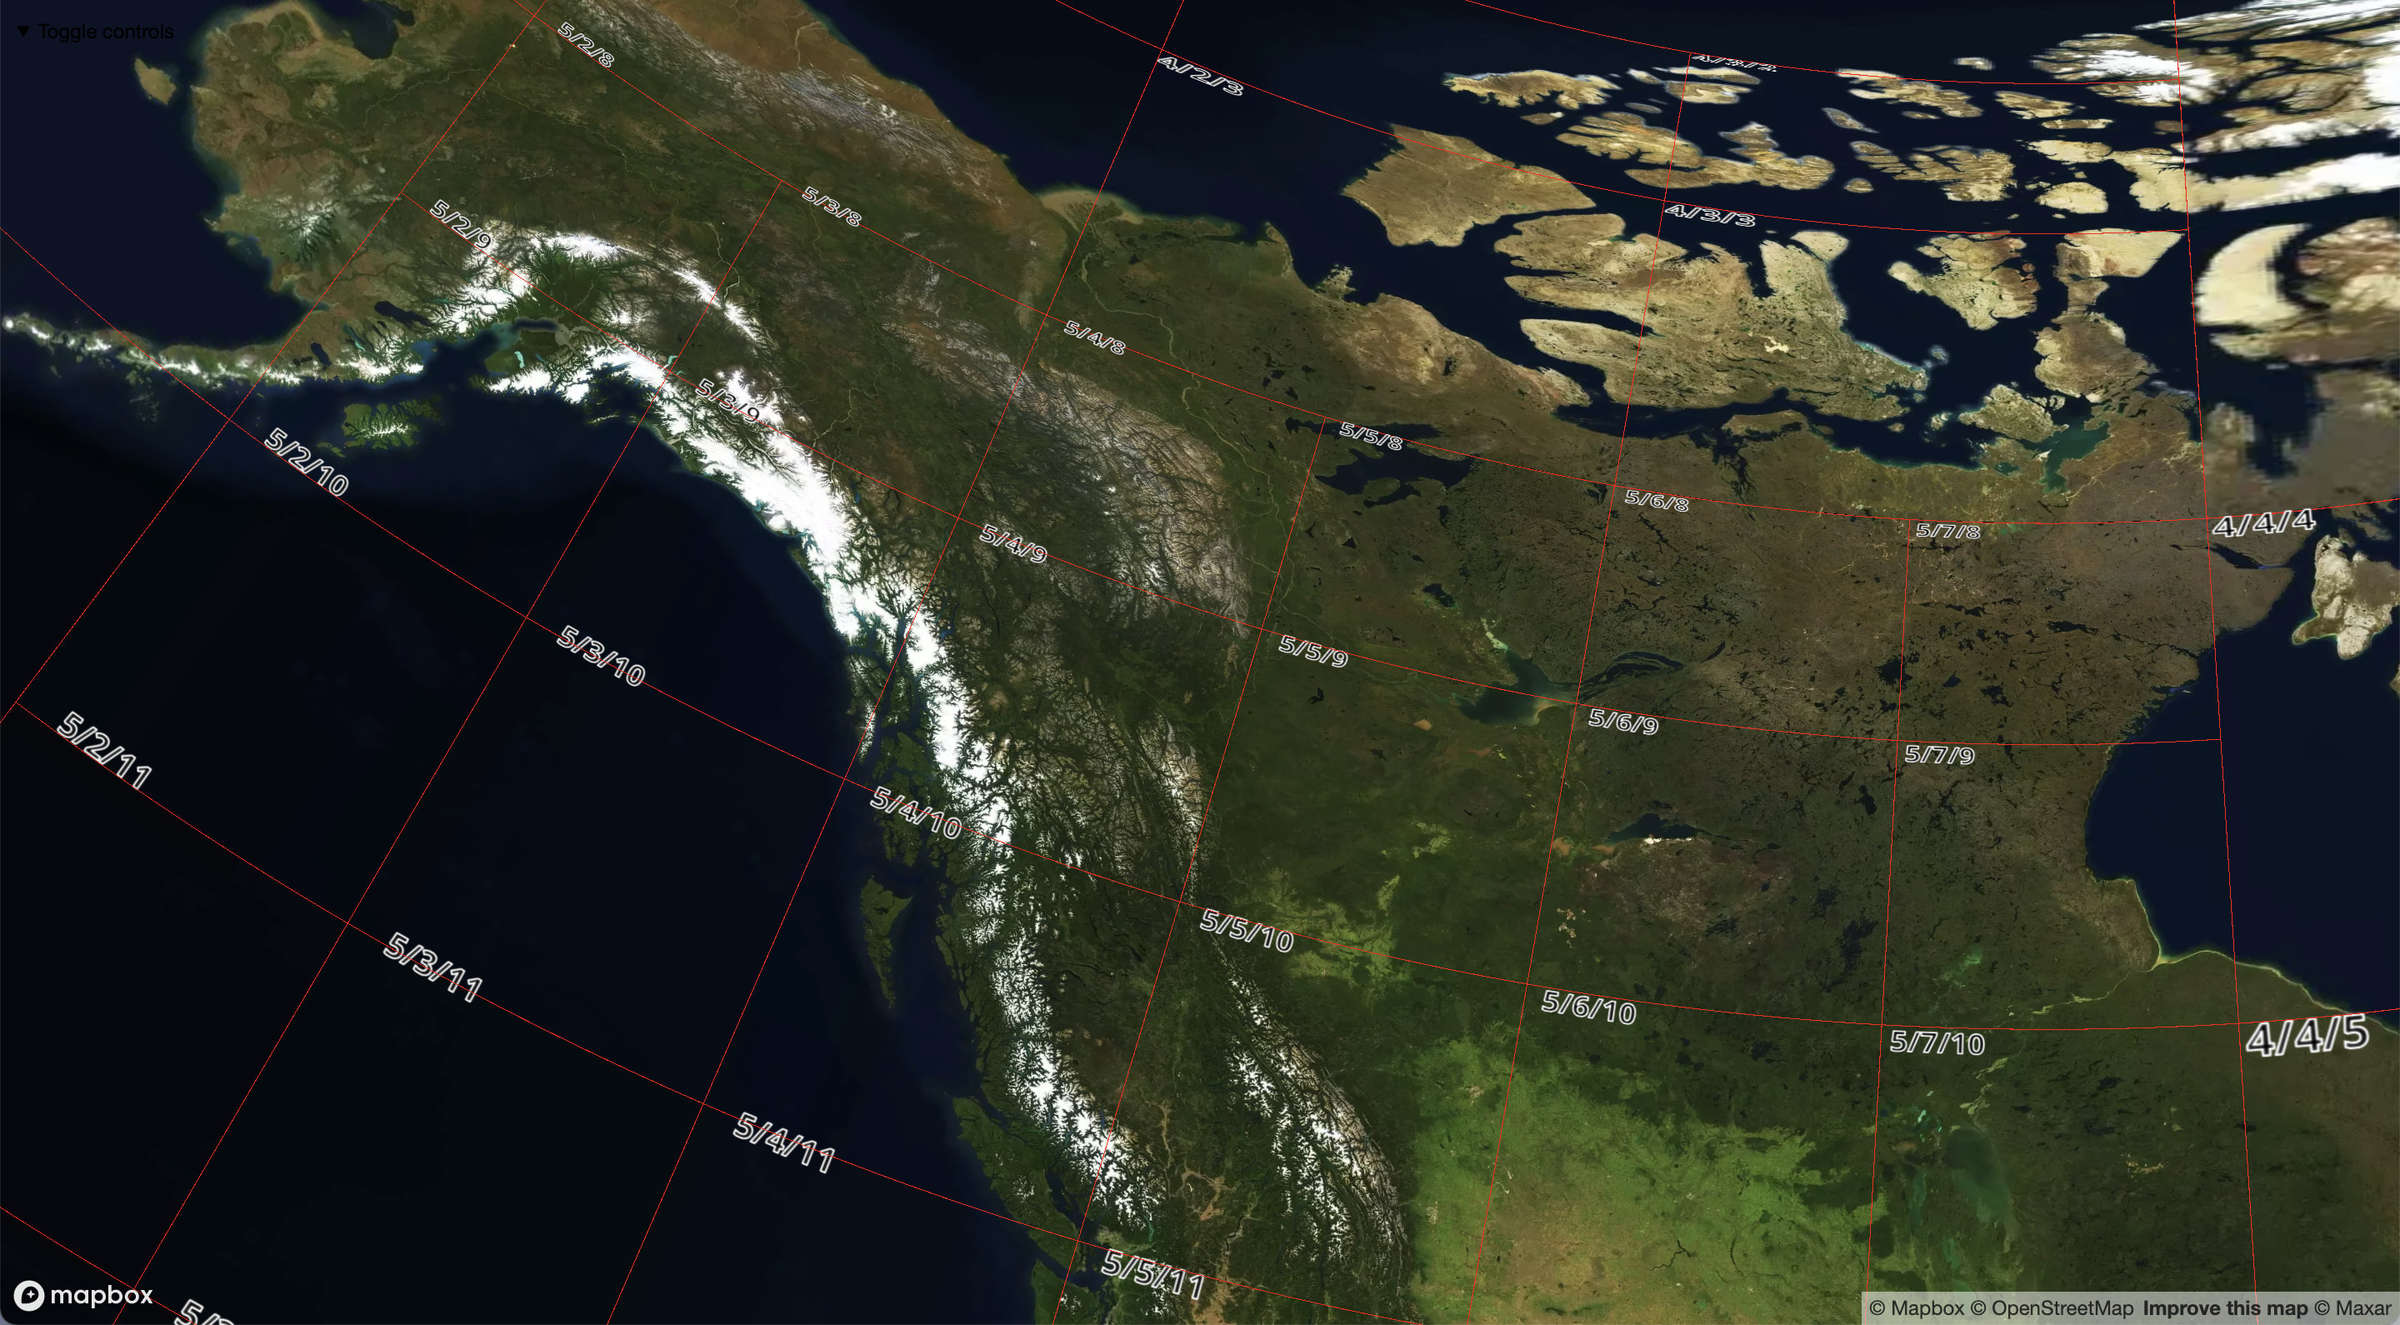
Due to rotation, pitch, and more recently 3D terrain features, the code responsible for deciding which tiles to load is quite convoluted. With projections, it gets even more complex: tiles are no longer perfect squares, instead taking various shapes depending on the projection used.
Moreover, since some tiles of the same zoom level can become large, and others small when reprojected, we adapted the tile loading logic, fetching tiles of different zoom levels on the same view depending on their size.
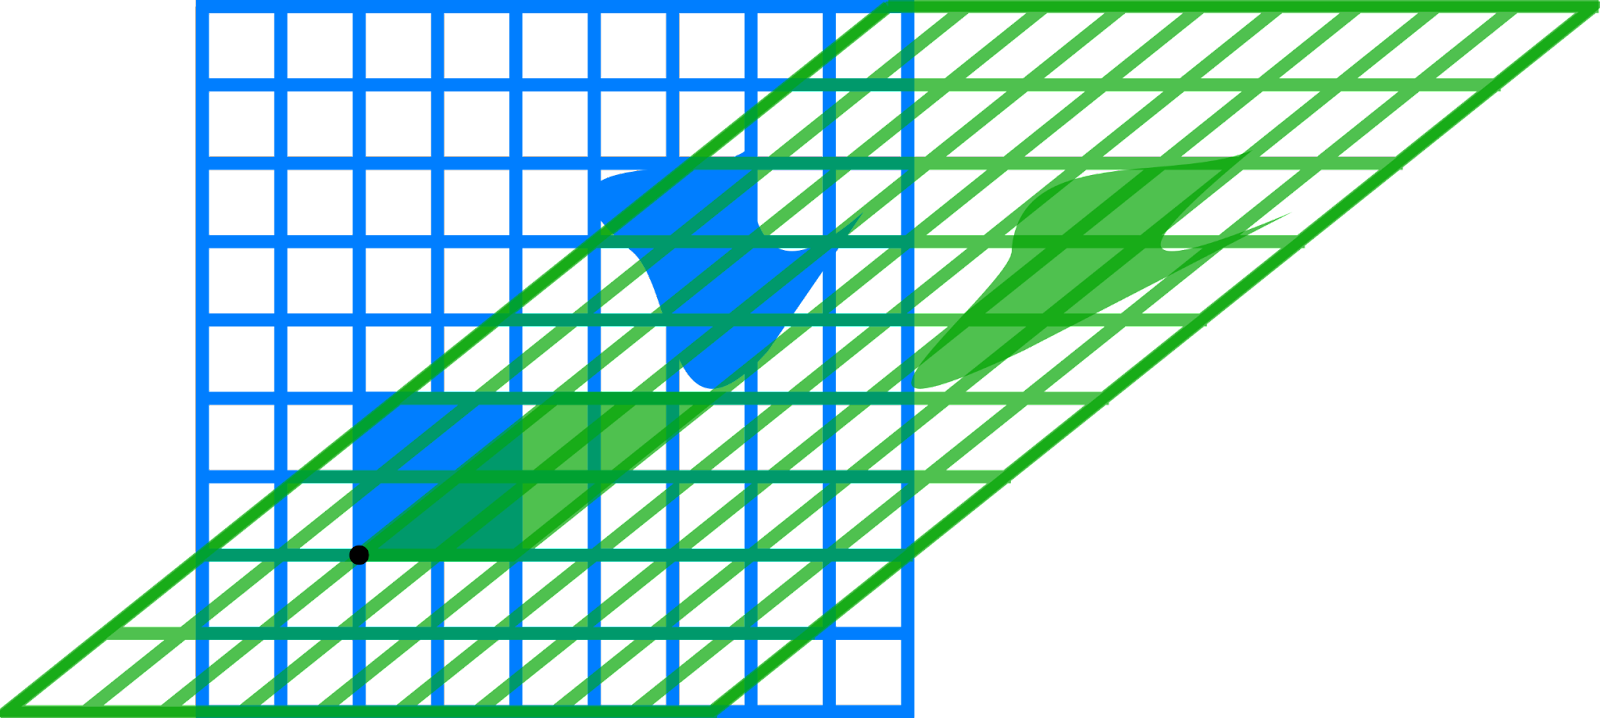
Resampling vector geometry
When we reproject vector tile data from Mercator to another projection, it’s not enough to calculate new coordinate values — line and polygon segments that were previously straight might become curved, so we need to add more points in between to follow the curve. Add too many, and rendering performance would be impacted. Add too few, and the lines wouldn't match the projection.
We find a balance with an adaptive algorithm — adding a point in the middle of a line segment, then in the middle of the newly created two segments, and continuing recursively until each segment approximates the curve with sufficient precision. It is very similar to the popular Douglas-Peucker polyline simplification algorithm, but in reverse. This approach allows us to render reprojected geometry accurately with only 2–3% additional points on a typical map.
Reprojecting raster tiles
To render raster tiles such as the satellite layer in alternative projections, we need to load Mercator images and then map them to the distorted tile shapes. To do that in WebGL, we need to split the tiles into many little triangles, with each triangle responsible for representing a tiny part of the image. Generally, the less triangles there are, the faster the rendering.
2 years ago, we introduced MARTINI — an open source library for real-time generation of 3D terrain meshes from raster heightmaps, with an accompanying interactive article describing how it works in detail. As it turned out, we can use exactly the same approach to generate triangular meshes for reprojecting raster tiles. Only instead of measuring how well individual triangle edges approximate terrain (to decide whether to split them further), we measure how curved an edge becomes with reprojection.
This results in a triangular mesh in which less distorted regions have less triangles, and more distorted regions have more:

Get started with Adaptive Projections
As a result, your fast, beautiful and detailed interactive Mapbox maps can now be effortlessly used in alternative projections. Thank you for reading!
Play with the new feature on this demo, check out the minimal example and documentation, try it out on your maps (either with code or Mapbox Studio), and let us know if you run into any issues. And look out for another awesome upcoming feature the Mapbox community has been longing for years:
Bonus: bloopers
Development of such complex features never goes smoothly, but on the upside, there’s a lot of accidental art to enjoy (our team has a separate #lol-gl Slack channel for sharing these):
.jpg)
.jpg)


Related articles
Tour Osaka in 3D with Mapbox Standard

One Attribute to Rule Them All