8 compelling stories told with the Storytelling solution

Since we launched our Interactive Storytelling solution, we’ve seen everyone from newsrooms to non-profits to individuals using this no-code solution to tell compelling and interactive stories.
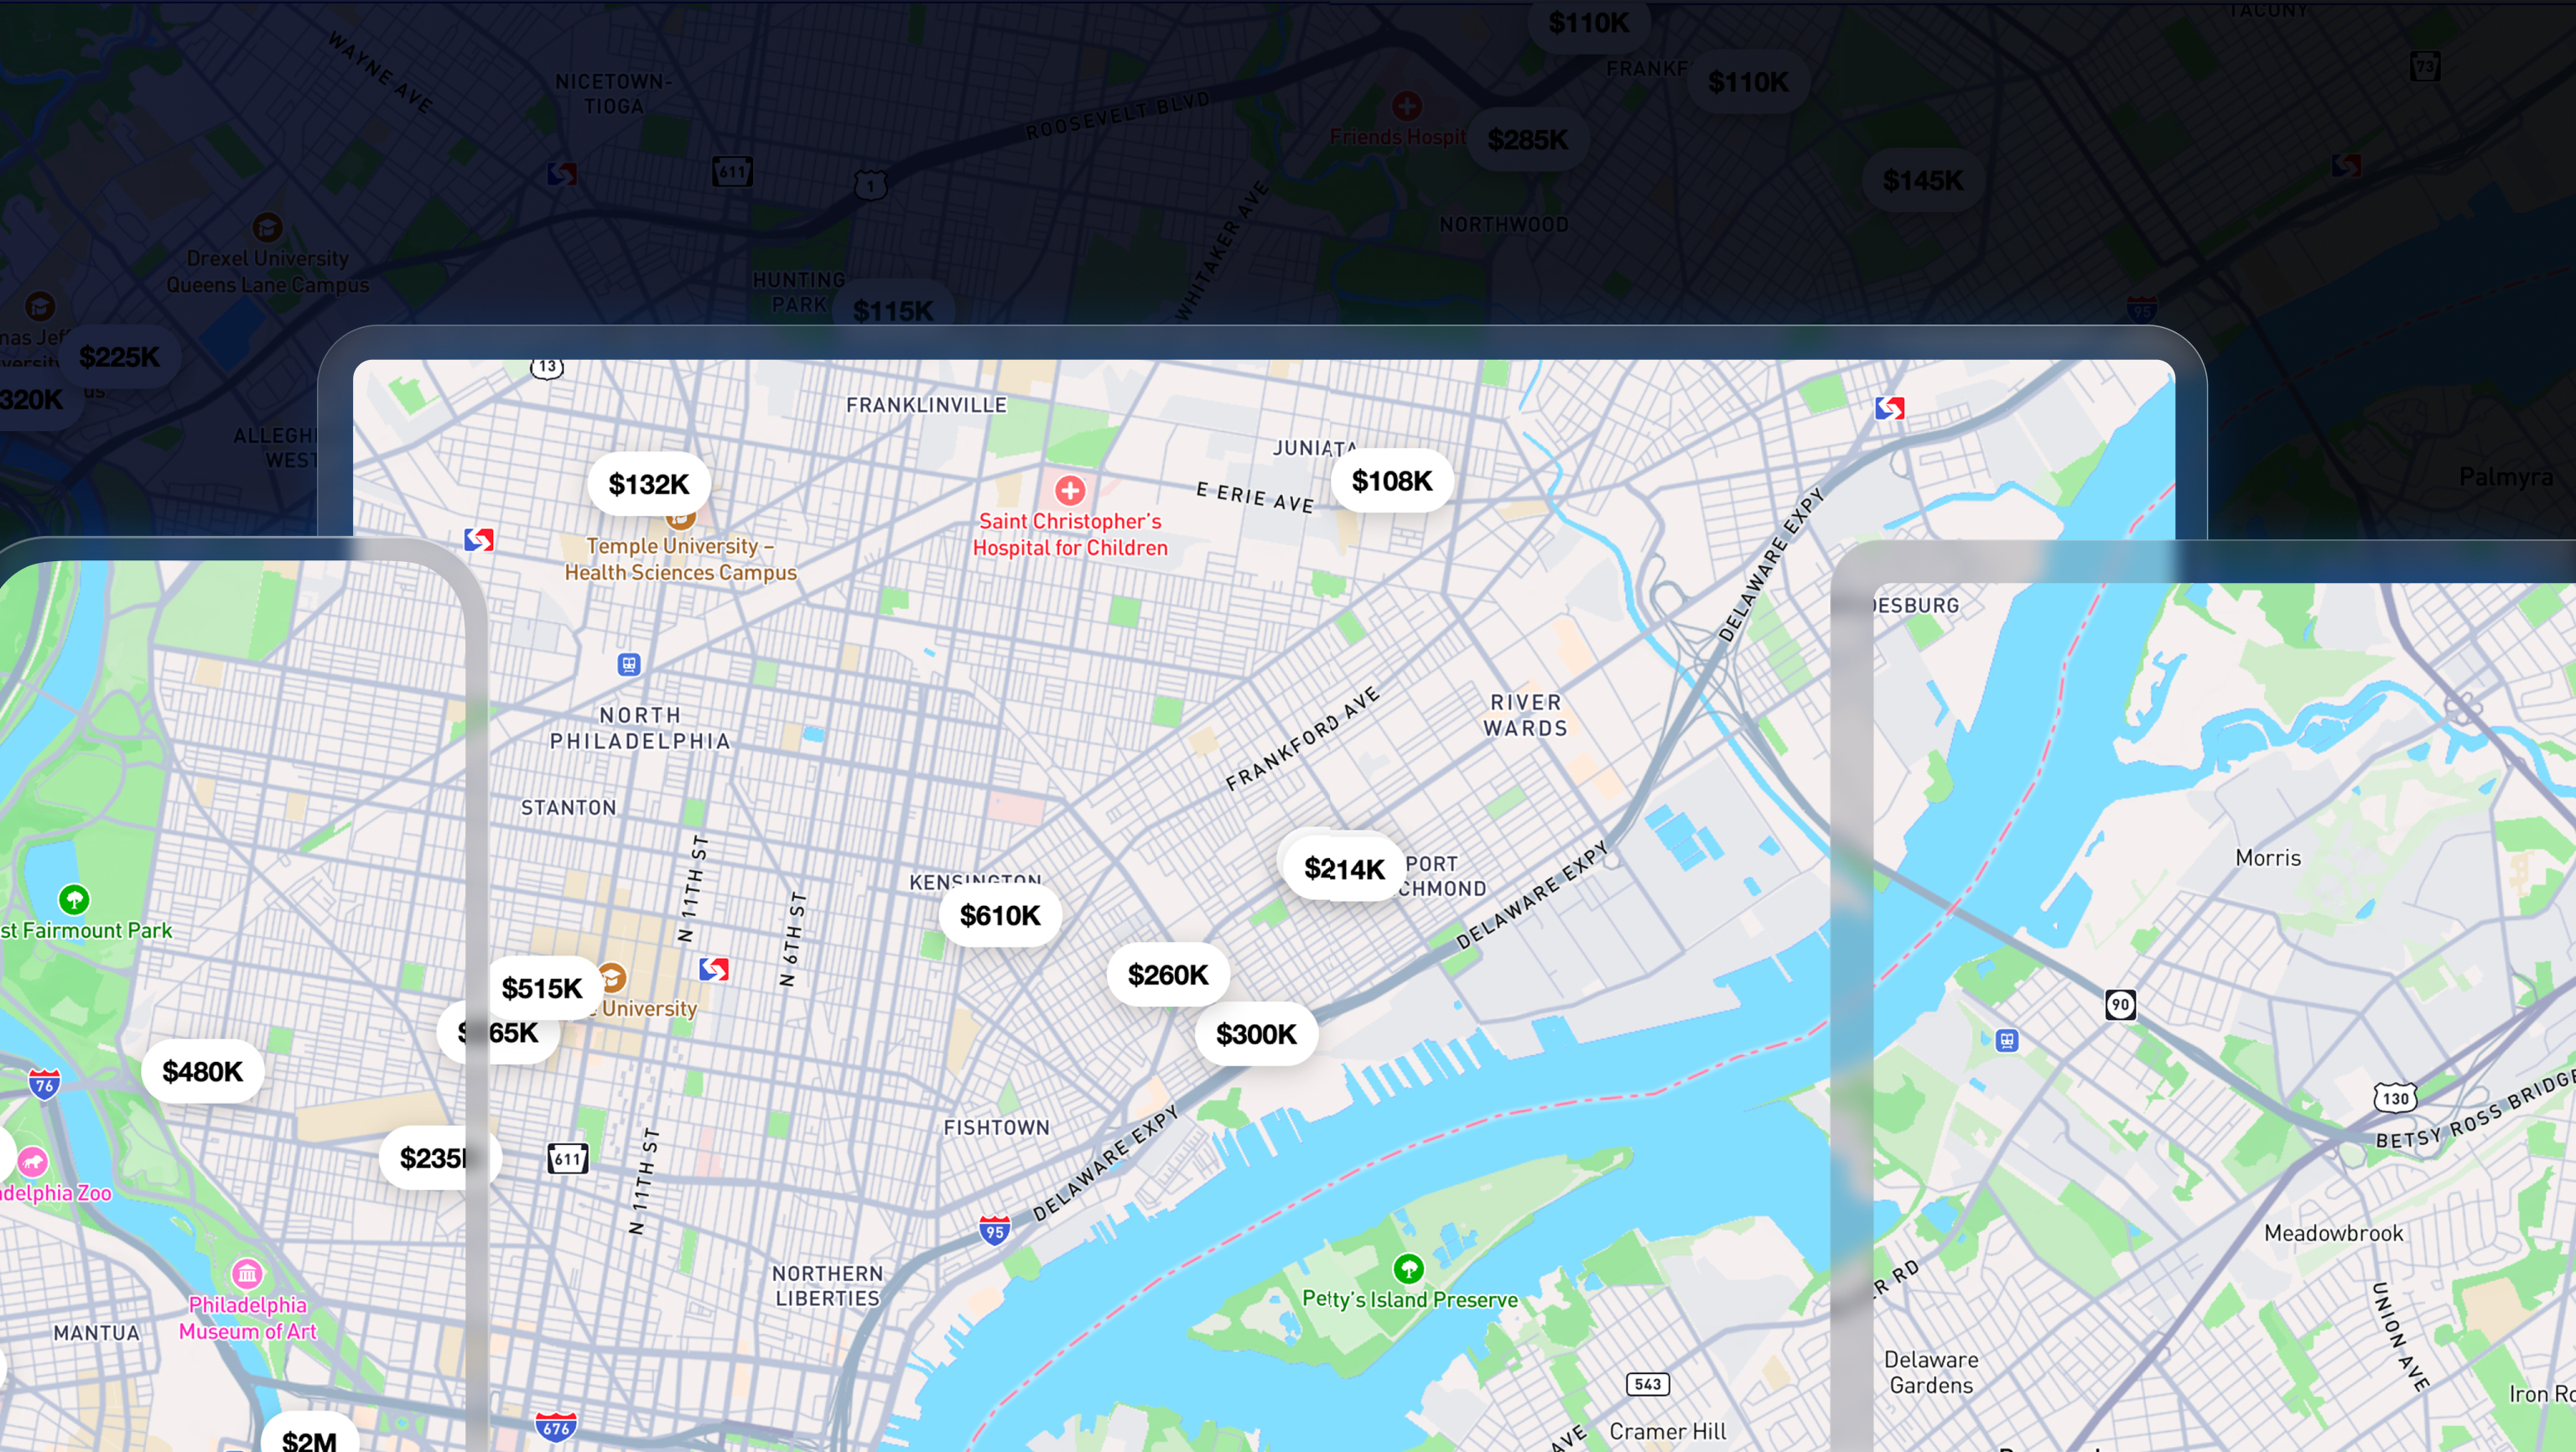
Each new story pushes the possibilities of this solution, creating more engaging and intricate stories from journalists, developers, data viz whizzes, and non-coders. From Expresso’s Angelo real estate map to the SF Chronicle’s mapping of the Kincade fire to celebrating Lunar New Year, it’s been inspiring to see how maps are used to tell different stories around the world. Here’s just a few of our favorite:
Washington Post | Safe Passages

The Washington Post used the Storytelling template to follow the journey of a pronghorn as she makes her way south for the winter in Wyoming. They analyze her path as she crosses several major interstates, a dangerous situation for both wildlife and drivers. As a user scrolls, the pronghorn’s daily journey animates and engages the user as they follow her path.
Hutttrip | Skimap

Huttrip displays ski routes with important details on distance and elevation. With rich terrain data, the Huttrip team adds extra interactivity by matching the elevation graph with the trail location on the map. The Storytelling template provides a platform for users to scroll and explore ski routes and potential huts to rent.
Conservation Land Federation | #TimeToChoose Map

The CLF is using the Storytelling template to tell the story of public lands at risk of being damaged by mining efforts by adding relevant, custom layers as a user scrolls through the exact section they are reading. First, they show the public lands and share their rich history, and then add the surrounding areas’ hyper-vulnerability to oil extraction, mining, and highway development.
Integral Group | University of Michigan Carbon Neutral Infrastructure Analysis

To better represent their analysis of the carbon-neutral infrastructure at the University of Michigan, The Integral Group turned to the Storytelling template. By dynamically visualizing the college’s current status, they’re able to better understand the progress of the University efforts and how to continue to reduce the University’s carbon footprint in its thermal and power generation infrastructure.
SF Chronicle | 49 Mile Scenic Route

Scrolling through the San Francisco Chronicle’s 49 Mile Scenic Route takes a user through an in-depth view of the city’s breath-taking landmarks, making even locals fall in love with it all over again. The Chronicle used Mapbox’s custom map styling to highlight the route overview and add custom icons for each landmark.
Al Jazeera | Saving the Nile

Al Jazeera used Mapbox’s satellite imagery to showcase the changes that a damn would have on the landscape around the river’s mouth. We love how Al Jazeera not only used the scrolling interactivity for the map but also made that interaction core to reading the other visuals and text of the story.
ICEYE | Dark Vessel Detection

ICEYE, the synthetic aperture radar (SAR) satellite imagery company, brought their business offerings to live by using the Storytelling template to provide an interactive demo for users to engage and understand their company’s satellite solution. Each scroll hones in a little further to show off more of the granular data that ICEYE has captured about suspicious vessels along coasts.
Jonni Walker | A Dystopian Future of Deforestation

Jonni Walker used the Storytelling template to explore what a map of the world would look like if all tropical rainforests were deforested in a day. Using his incredible 3D styling techniques, he brings the deforestation to life by casting shadows for the mountains. With each scroll, Walker guides a user to a new rainforest shows what deforestation would look like, and puts the scale of the loss into perspective by quantifying them as football fields.
Feeling inspired to tell your own story? Check out the Storytelling template or view our how-to guide and webinar from engineers Lo Bénichou and John Brannigan for an interactive walkthrough of building a story step-by-step. Tweet at us using #BuiltWithMapbox so we can share what you build.


Related articles
Build once, run everywhere: Web support comes to the Mapbox Maps SDK for Flutter
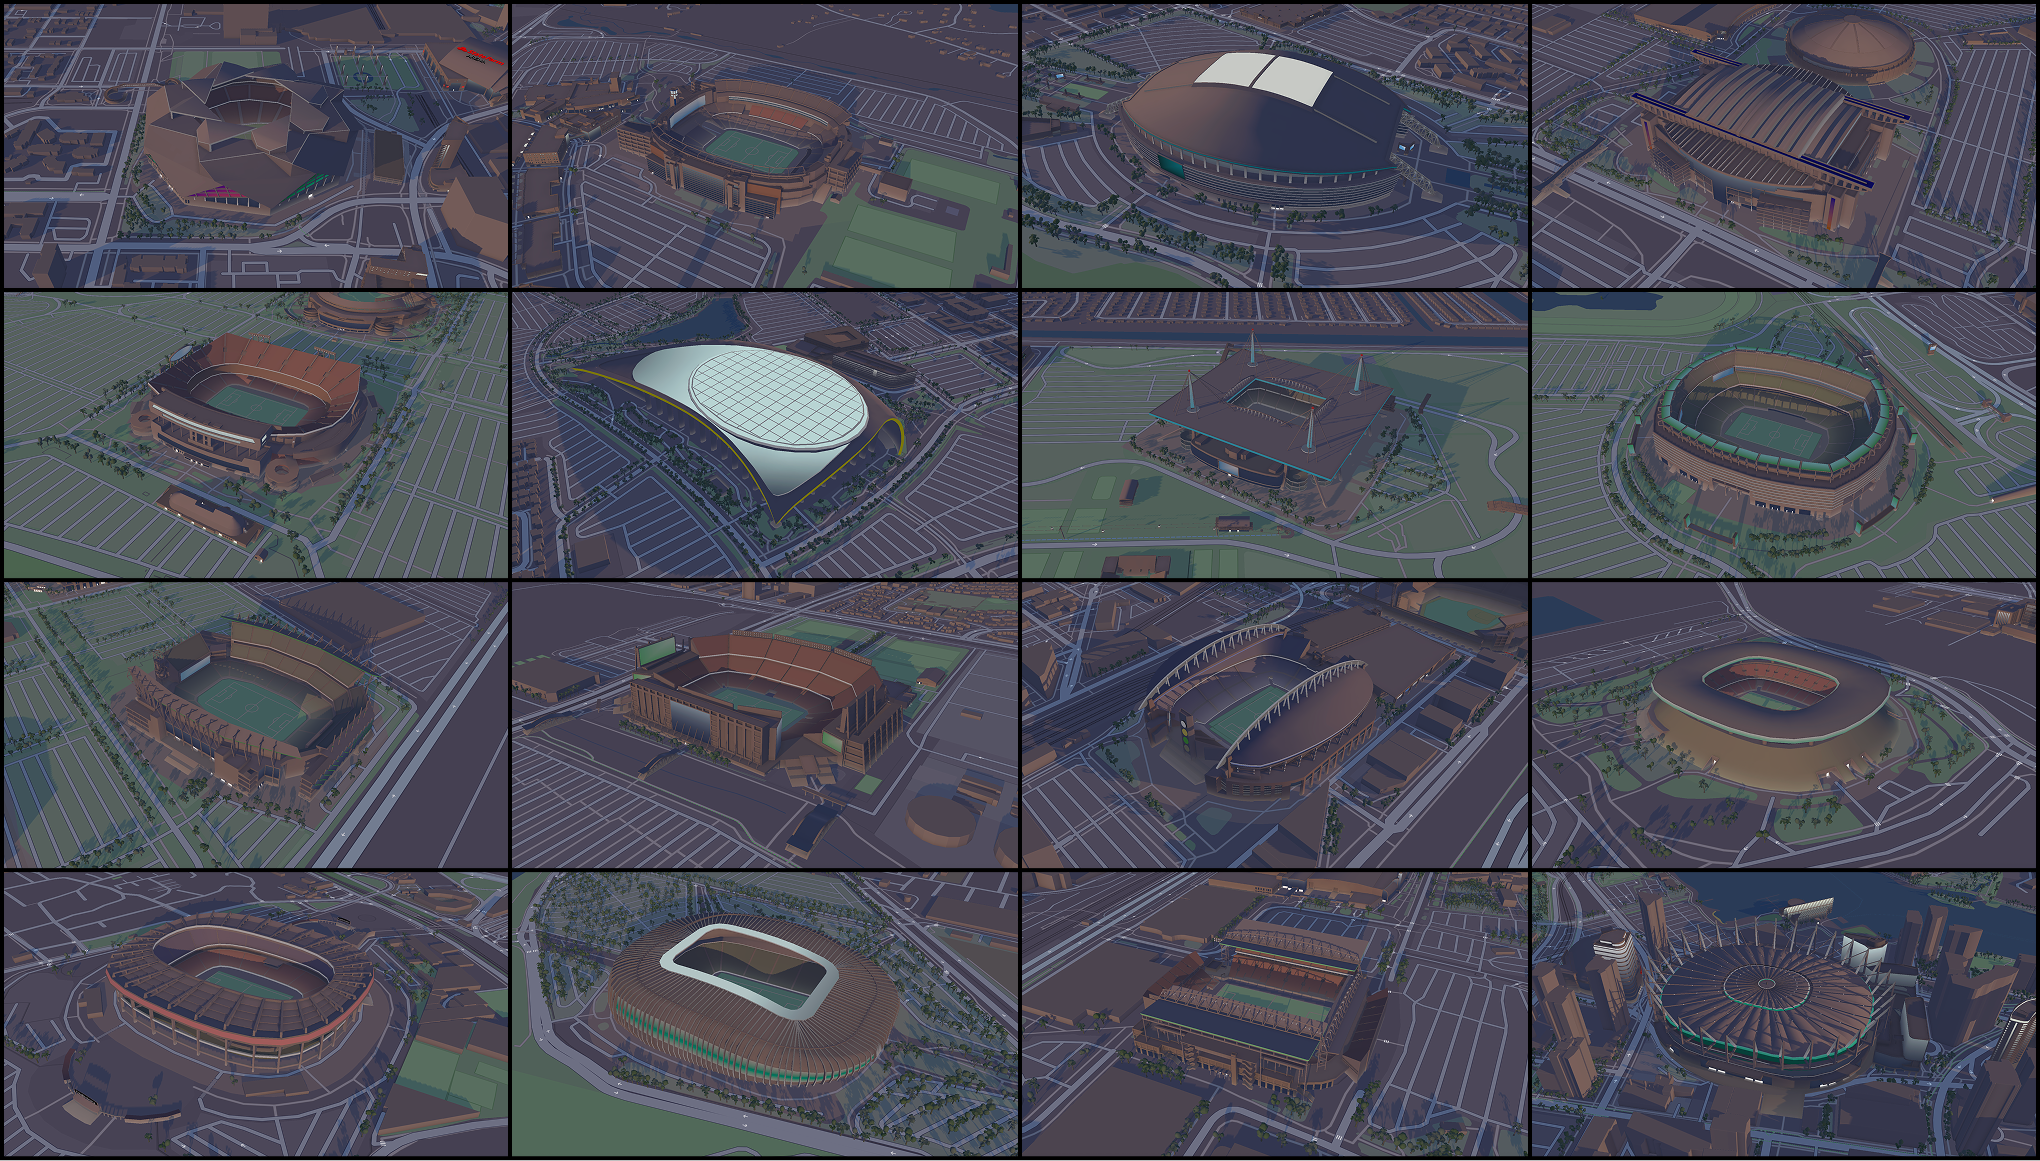
From airports to stadiums, maps are elevating the soccer fan experience