10 years of Mapbox GL
A look back to the invention of our web mapping library

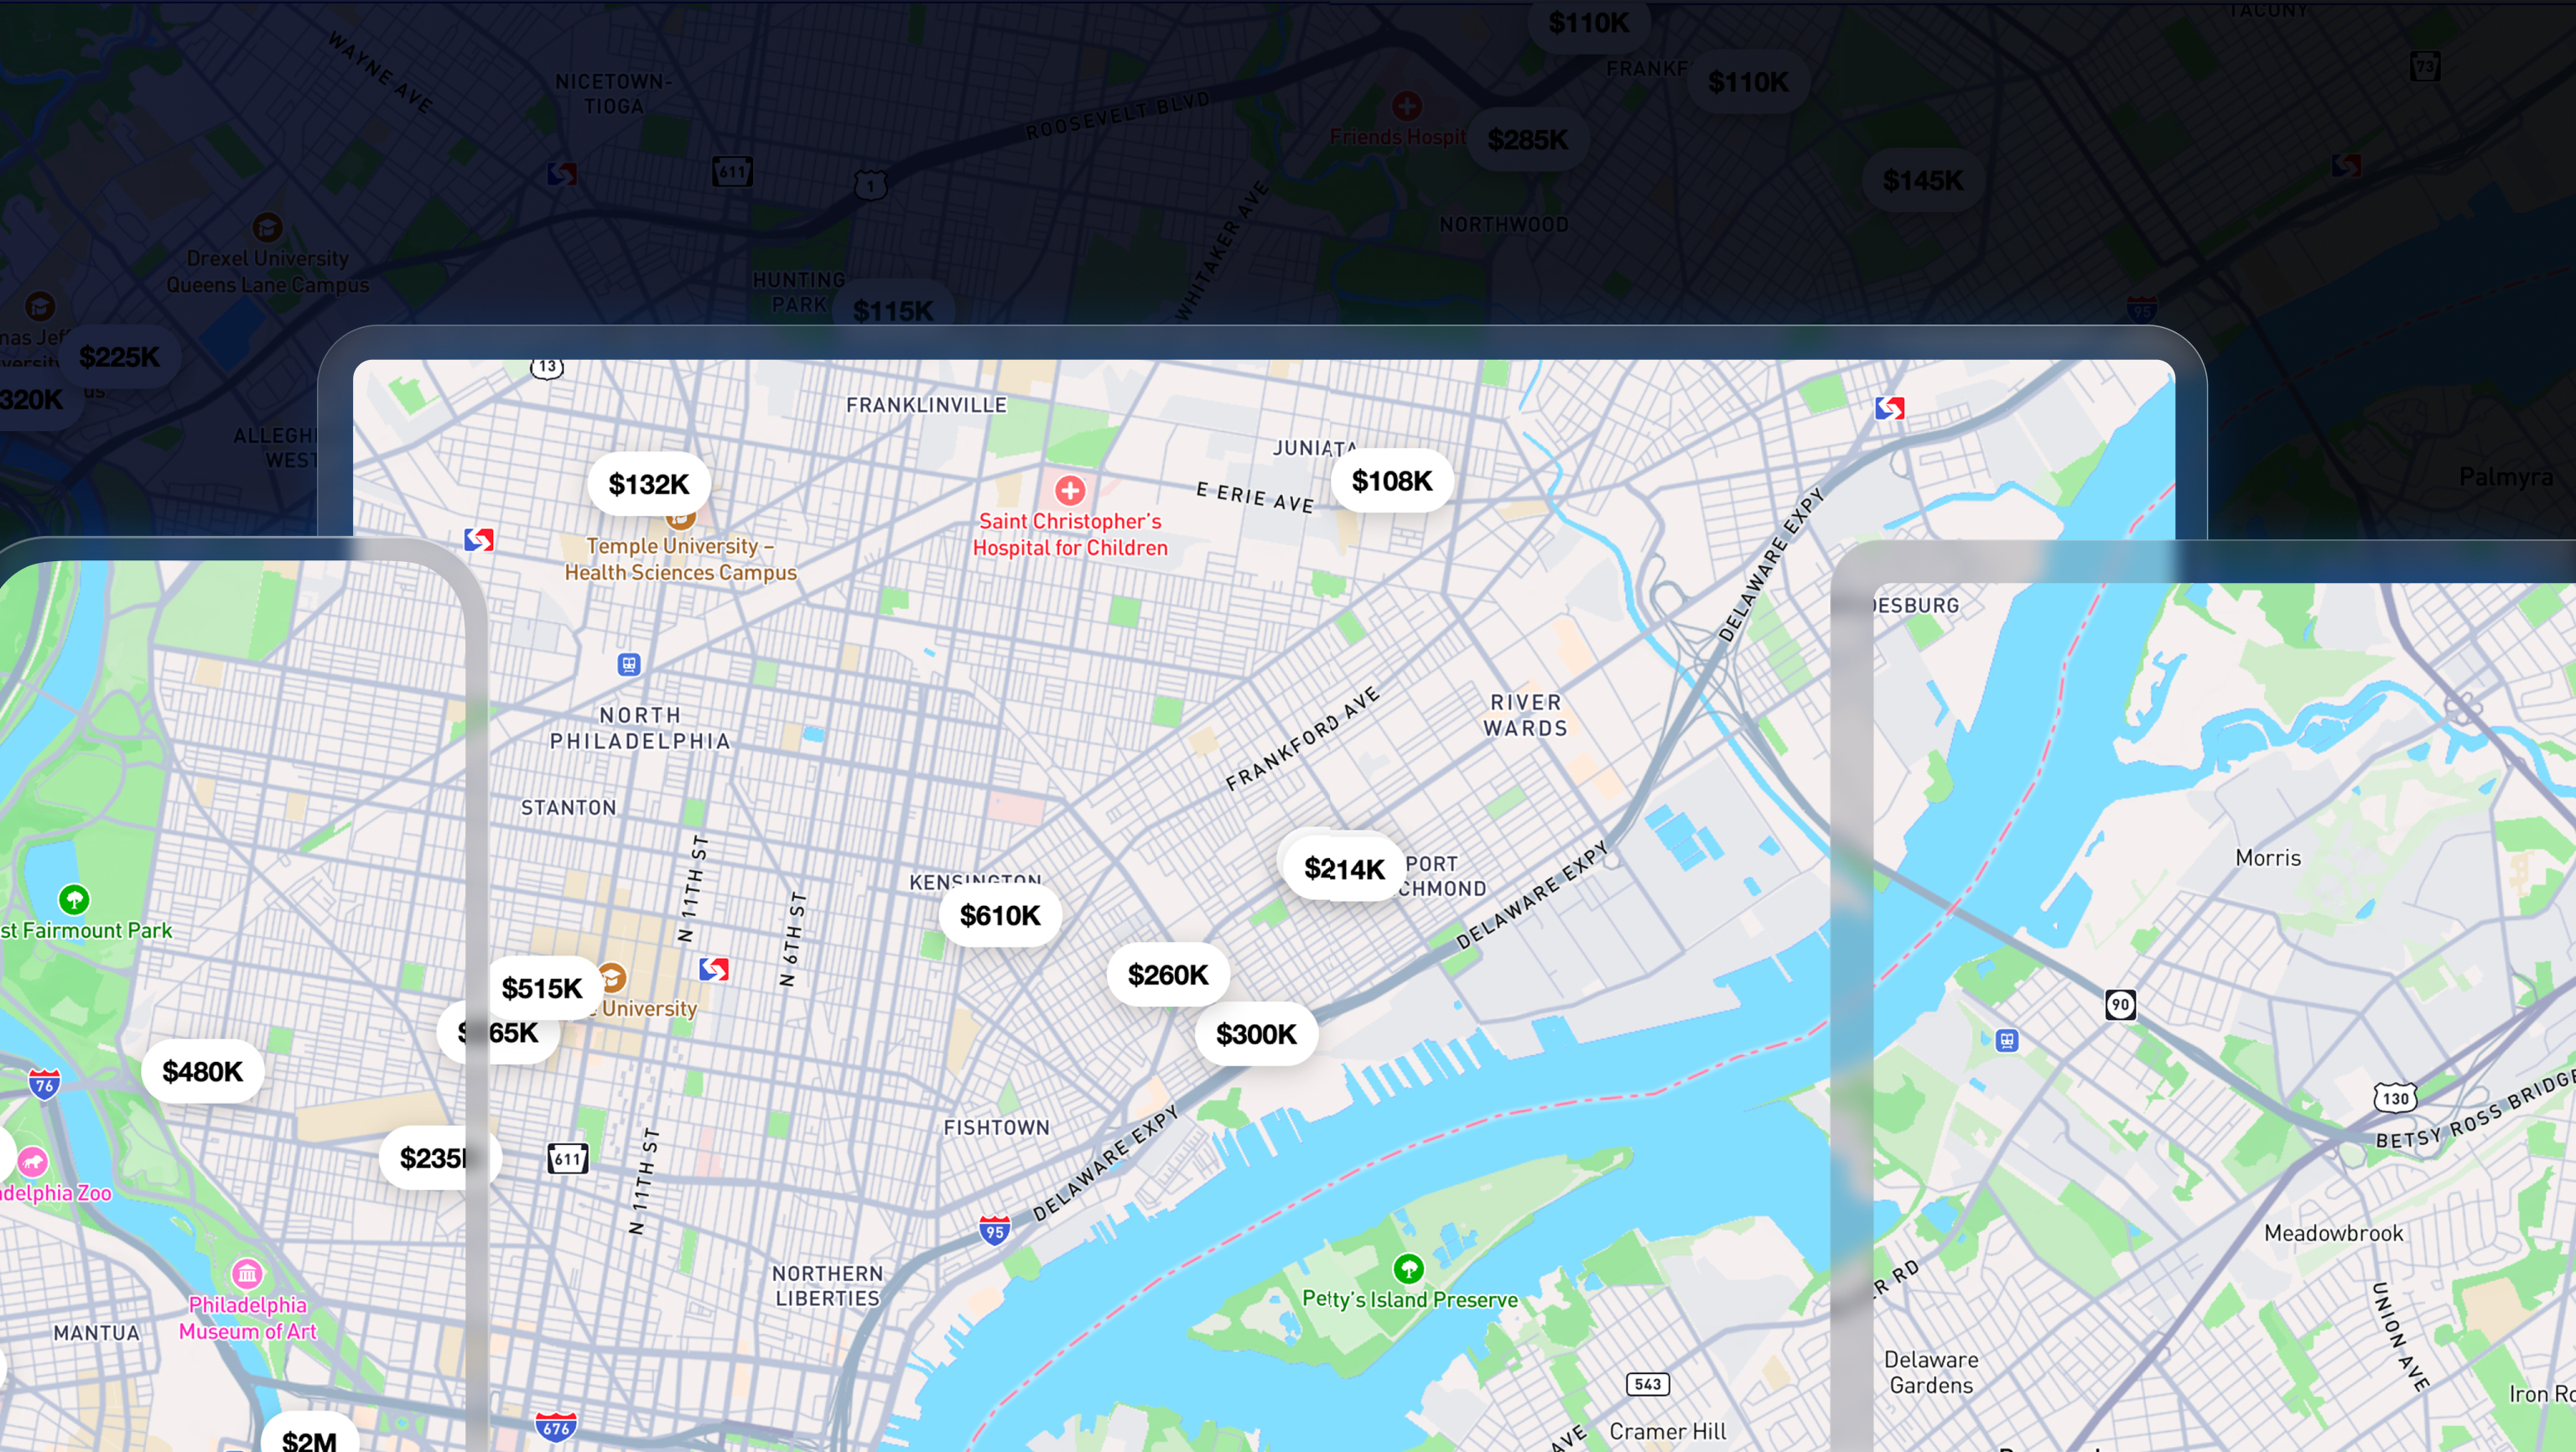
Ten years ago an internal post announced the start of what would become Mapbox GL. This innovative mapping library has changed the way the world interacts with maps, enabling more dynamic and interactive visualizations than were previously imaginable. Mapbox GL has been adopted by some of the world’s most famous companies and news organizations; made the leap to smartwatches, cars, and cable TV; been used for everything from mapping Mars to helping people with limited vision to navigate. Today, Mapbox GL is the foundation for maps used by billions.
Below is the internal blog post from July 6th, 2013 where I presented the first prototype of a new kind of on-device map renderer built on WebGL. Back then, Mapbox maps were made of raster image tiles that had been pre-drawn with Mapnik and rendered with Leaflet. Both of those projects are powerful in their own right, but we were starting to see the limits of that approach:
- Techniques for adding data to already-rendered tiles had downsides. Custom data always looked like an intruder.
- Rendering individualized maps server-side required a lot of resources.
- We couldn’t rotate, tilt, or smoothly scale the map between zoom levels.
- The growing popularity of high-DPI “Retina” displays meant doubling or tripling the size of map tiles, significantly increasing bandwidth requirements.
Luckily, the time was right for a new approach. Several things fell into place that enabled the creation of Mapbox GL:
- We had just developed the Mapbox Vector Tile format, enabling efficient delivery of small chunks of geodata to the client. Over the past decade, this format has become tremendously successful and is now an industry standard that is used across the entire geospatial community.
- WebGL was becoming widely available, having been standardized just two years earlier.
- Shortly after the initial prototype, Mapbox received its first financing round, allowing our team to evolve the prototype into the most flexible and full-featured map renderer in the industry today.
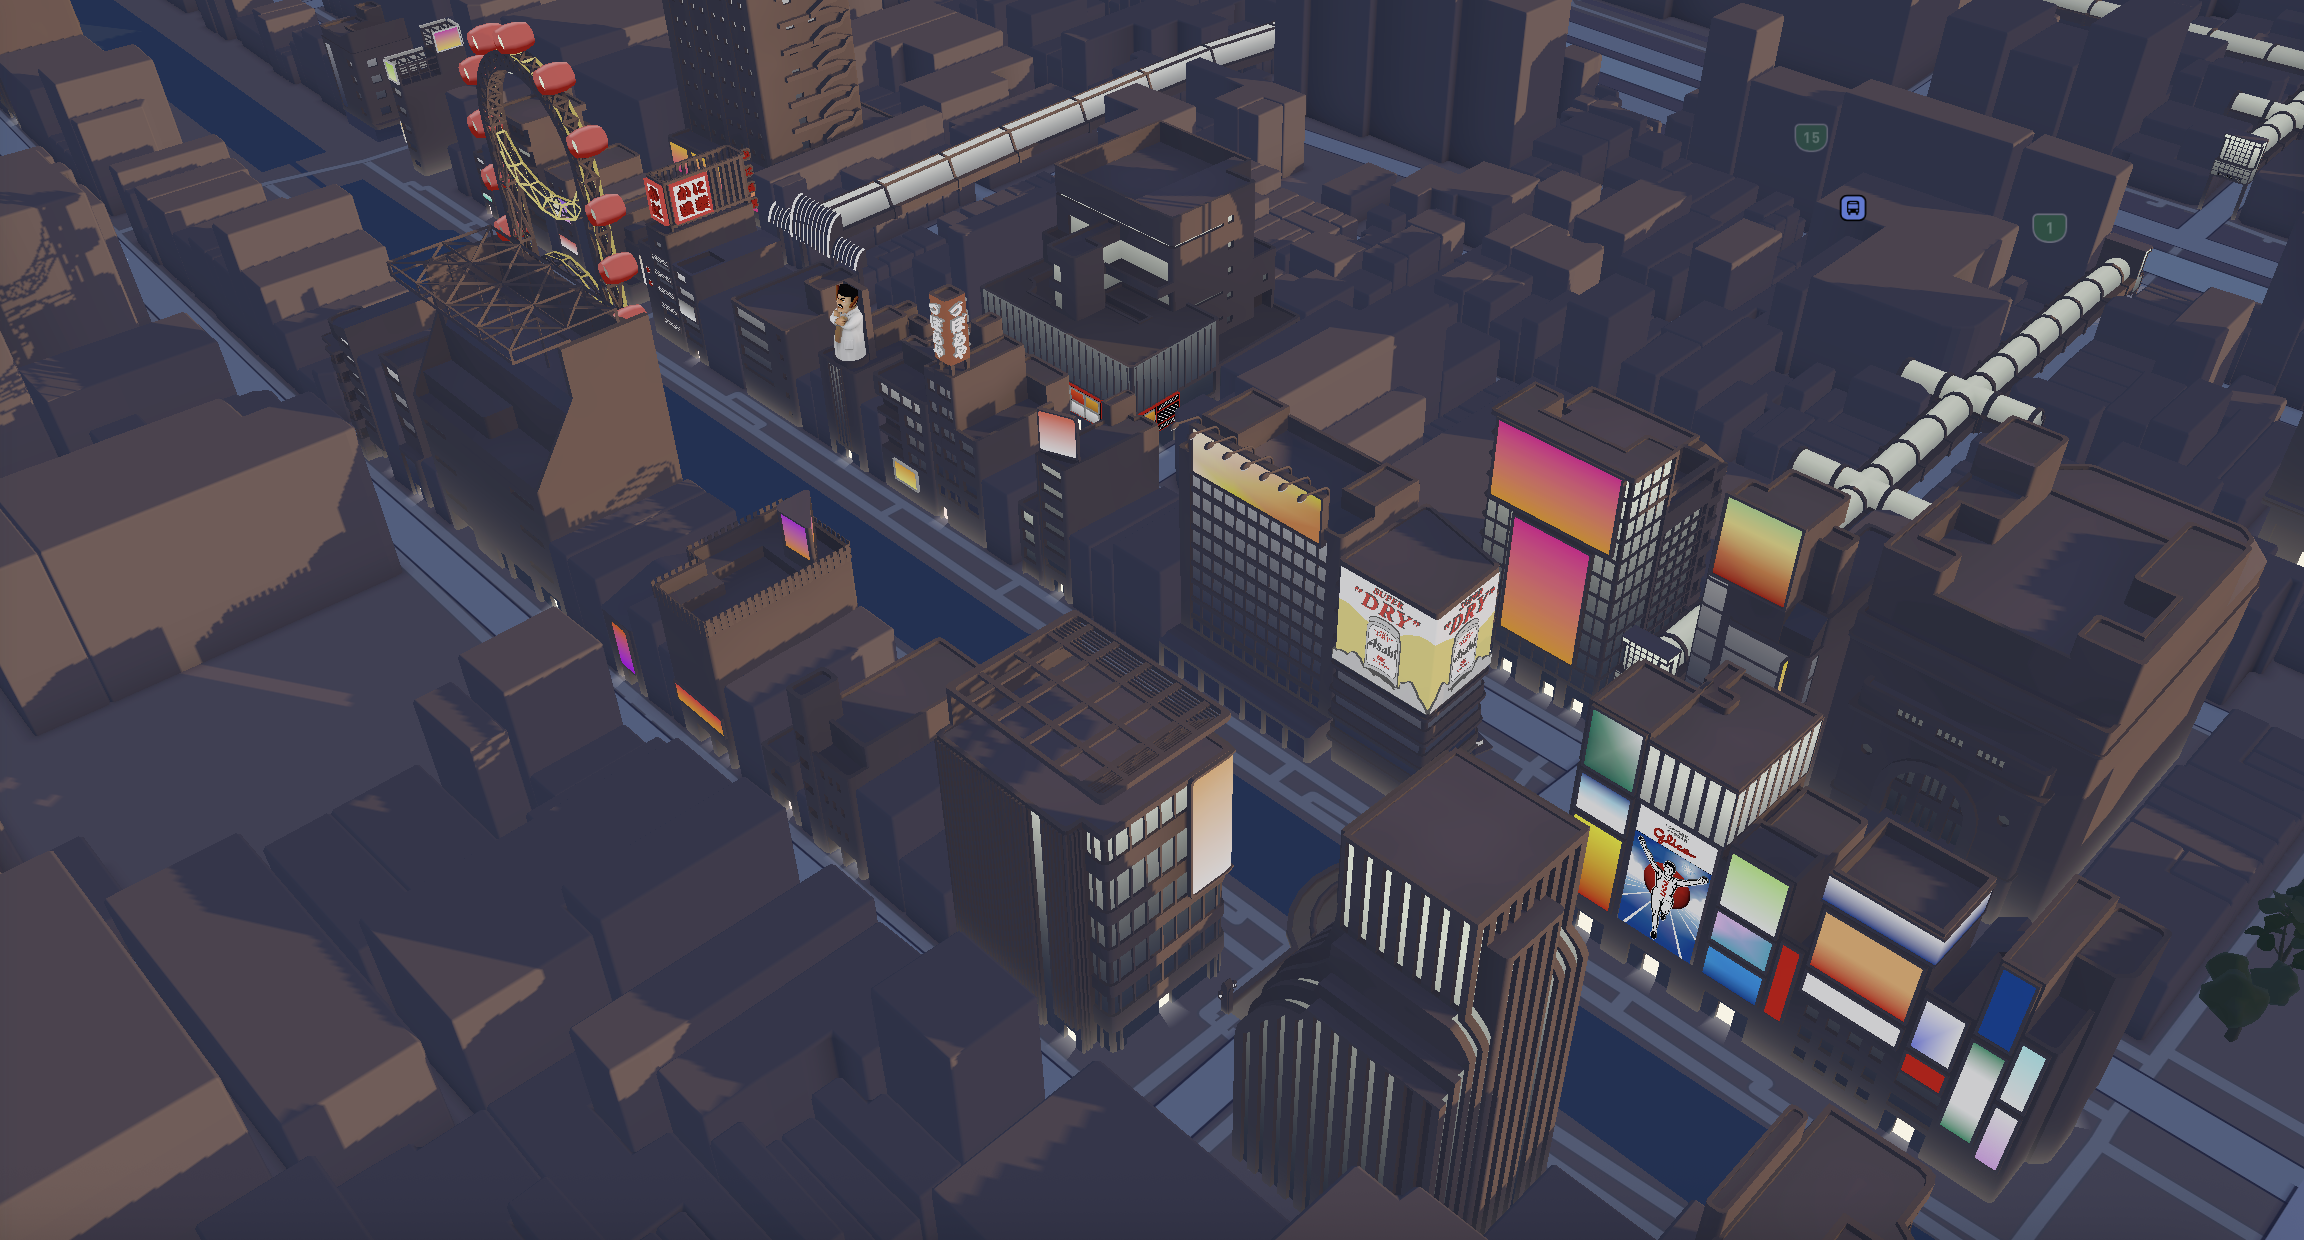
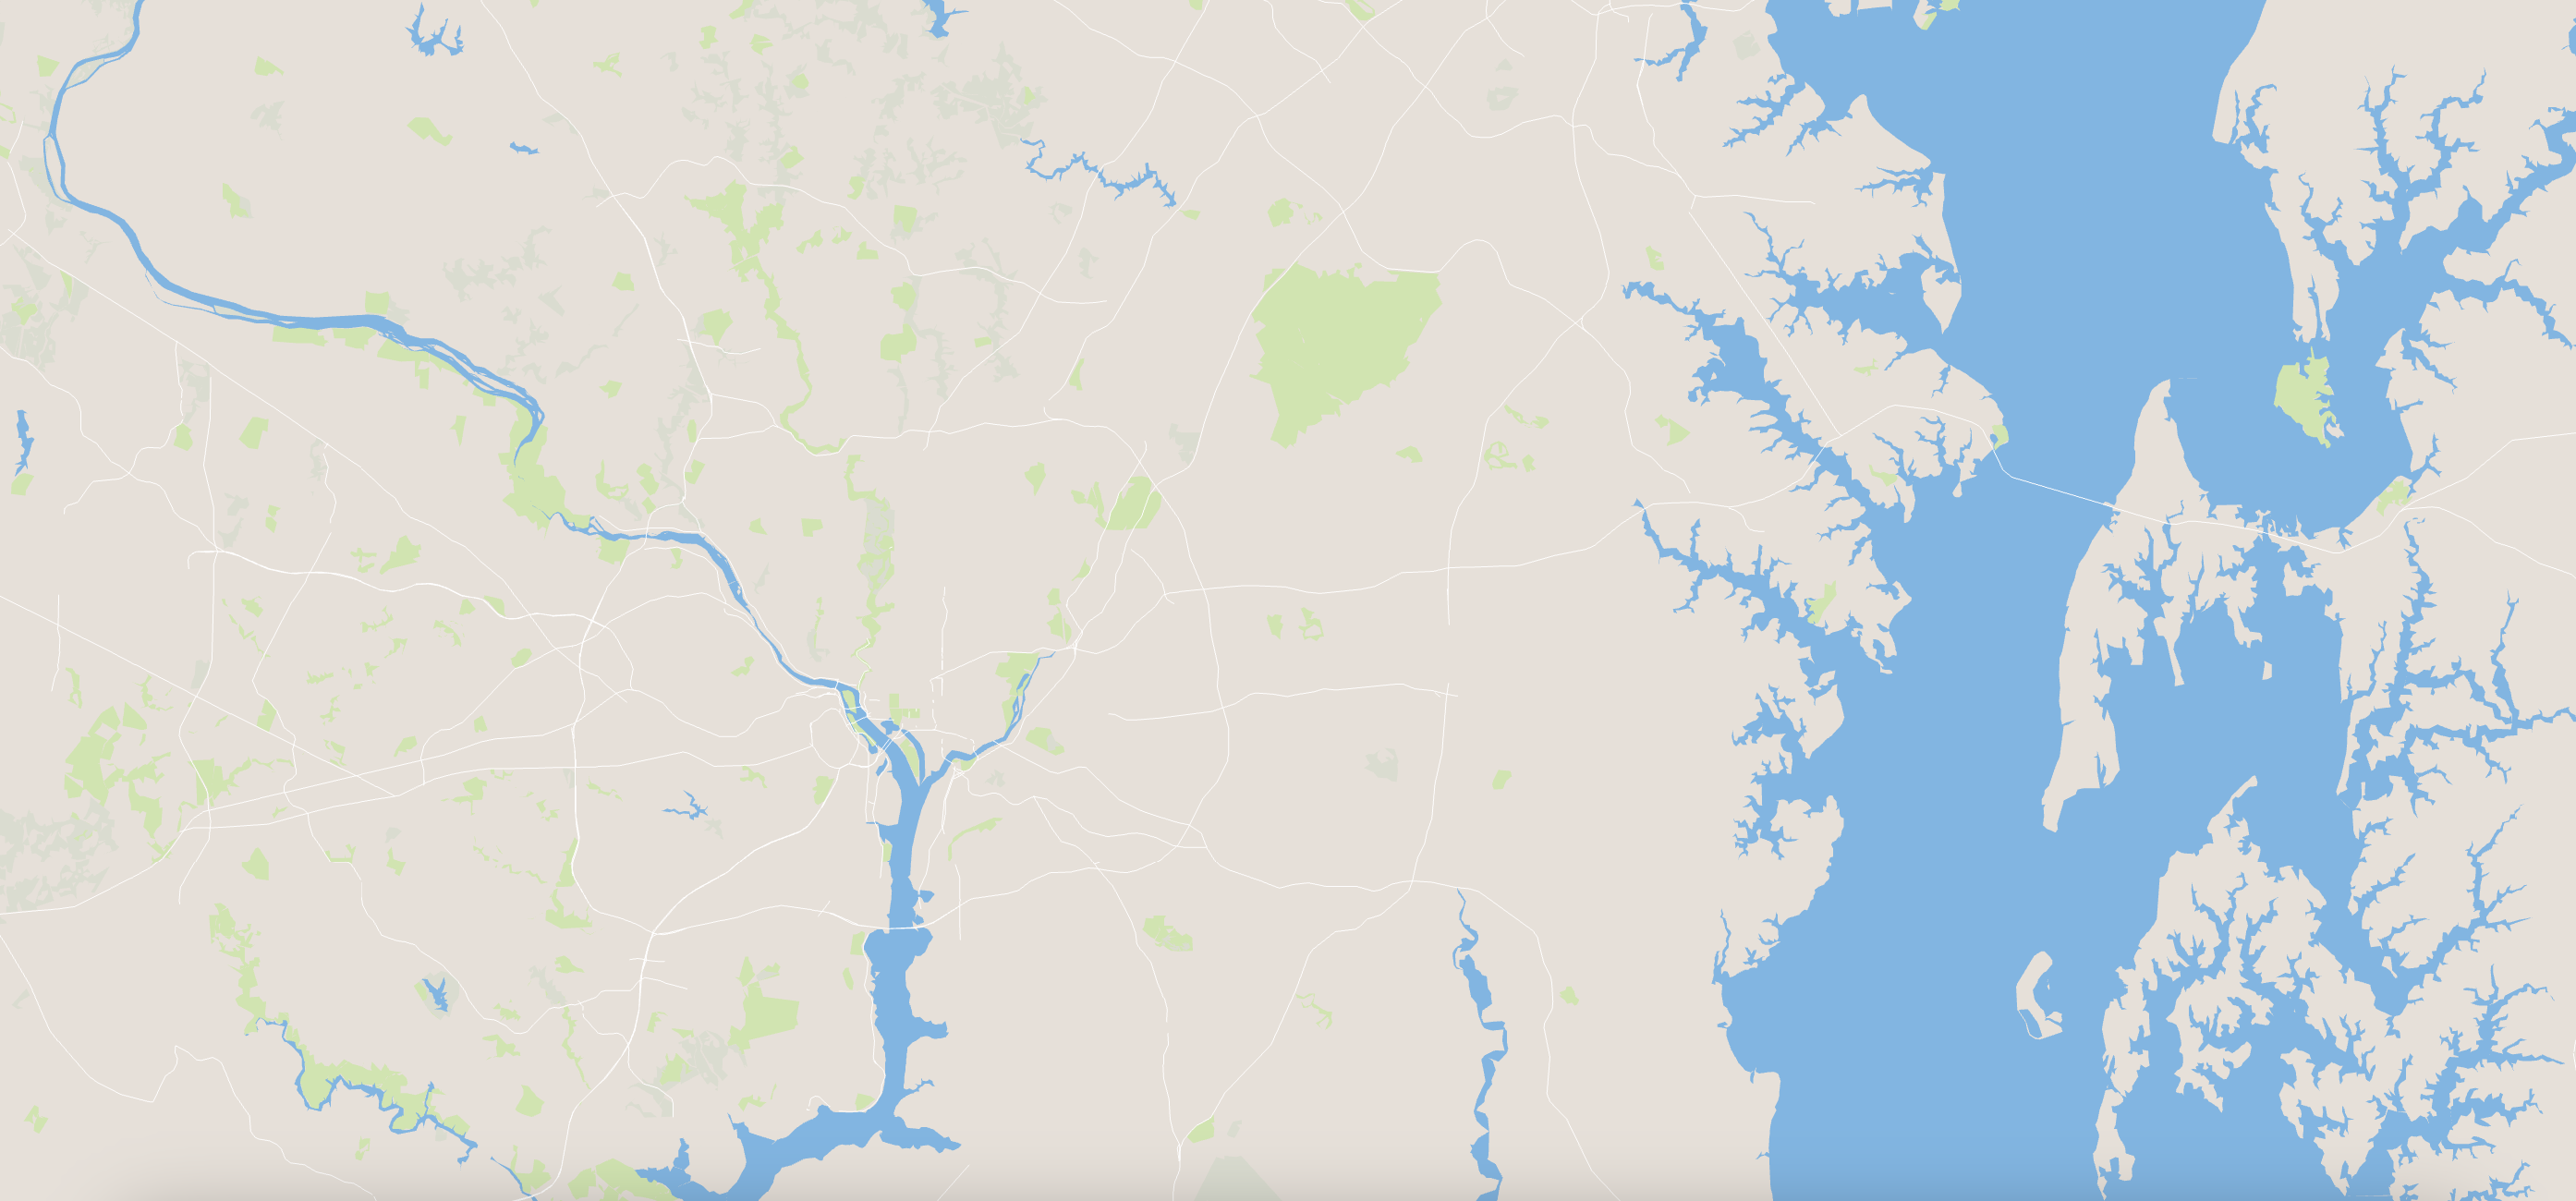
The first prototype had smooth zooming and could render streets, parks, water and buildings. But it still lacked lots of other features that made it into the first publicly available version 11 months later, like text rendering and labeling, wide lines, rotation, and the C++ port that brought the renderer out of the browser and into mobile and embedded devices. In the years since we added support for building extrusions, client-side polygon tessellation, tilt, data-driven styling, heatmaps, and much, much more. The number of innovations, optimizations, and brilliant people who have contributed to the success of the project is too large to count.
But it all started with this demo. Here’s a look back at that first prototype of Mapbox GL JS, 10 years ago:
WebGL Maps
posted by @kkaefer on Jul 6, 2013
Over the course of the past two weeks, I implemented map rendering with WebGL. This is a relatively new browser API that makes it possible to directly access the GPU built into the computer. It’s an implementation of OpenGL ES 2.0 adapted to run with a JavaScript interface.
OpenGL works quite differently from software rendering (like the 2D <canvas>, or Agg): Instead of calling draw operations like moveTo or lineTo, or using a scanline renderer that goes through every pixel and every line, the GPU renders everything at the same time (or almost the same time) on multiple cores within the GPU.
Rather than submitting a vertex at a time, OpenGL ES works a lot more efficiently if you create one big buffer that contains all the information required to render the scene. There are multiple reasons for this, but probably the biggest one is that moving data from the CPU/RAM to the GPU is very slow, and making fewer individual calls will result in better speed.
The vertex shader is essentially a program that takes several parameters, including the “input” coordinate, and generates an output position for a vertex. This is required because that way, you can make the GPU compute the new position of an object if the camera shifts without having to update your buffer.
Our vertex shader looks like this:
attribute vec3 a_position;

uniform float uPointSize;
uniform mat4 uMVMatrix;
uniform mat4 uPMatrix;

void main() {
    vec4 pos = uPMatrix * uMVMatrix * vec4(a_position.xy, step(32767.0, a_position.x), 1.0);
    gl_Position = pos;
    gl_PointSize = uPointSize;
}
It takes one 3D vector as input (we only use 2 of these coordinates). This one is changing for every call of this function. The other 3 (uPointSize, uMVMatrix, uPMatrix) are “uniforms”, which is OpenGL’s version of constants.
The only interesting line is the first line where we multiply the vertex with the model/view and the projection matrix to receive the final position. The z coordinate is determined by the step() function. I’m going to describe later what this is and why we need this.
Projection
OpenGL is a 3D API, which means that it supports many things which we don't actually need for rendering. For example, it has support for perspective projections (which most computer games are using). However, since we want to draw 2D vector graphics, we’re using an orthographic projection.
Our matrices are very easy, since we don’t need to do any fancy rotation things: the model/view matrix is essentially an identity matrix, the projection matrix spans open a projection area from 0 to 4095 in both axes. This means that the viewport will contain coordinates between 0 and 4095, which is exactly the default extent of our tiles (we can change this dynamically for tiles that have lower or higher precision).
The projection matrix also defines a near plane of 1 and a far plane of 10. This means that anything that is closer than 1 or further away than 10 units will be “culled”, which is OpenGL speak for “not rendered”. Along with the step function from our shader, this gets interesting later.
Tiling
There are two basic ways to implement tiling for OpenGL: Leaflet-style with canvas, where every tile has its own canvas, and WebGL context. Positioning is done with CSS transforms. This has the advantage that we only have to render a tile once and can throw away everything except for the rendered bitmap after we’re done. It’s also fast to pan around in this setup because the compositor essentially just needs to shift the coordinates of the CSS layers around and compositing is done on the GPU in most cases.
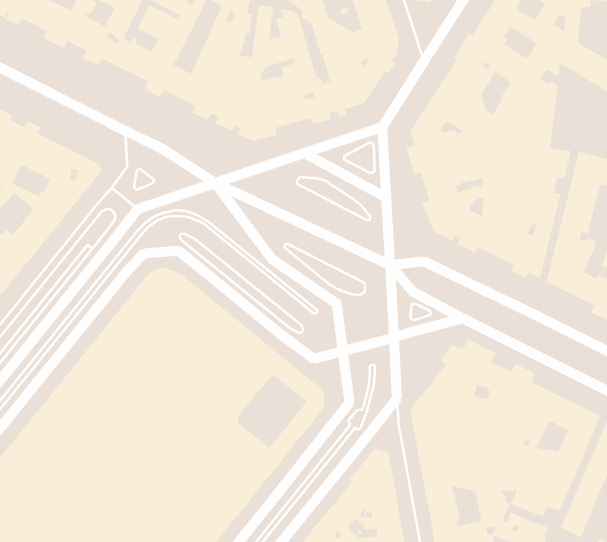
However, I opted for a different way of implementing tiling: Rather than having a canvas per tile, we have one big canvas for the entire map area. Every time the user pans or zooms, we re-render the whole map at the new location. We do this to support seamless zooming. The map view has no fixed zoom levels that it snaps to; since we render everything at the required size, we have a crisp image at every imaginable zoom level.
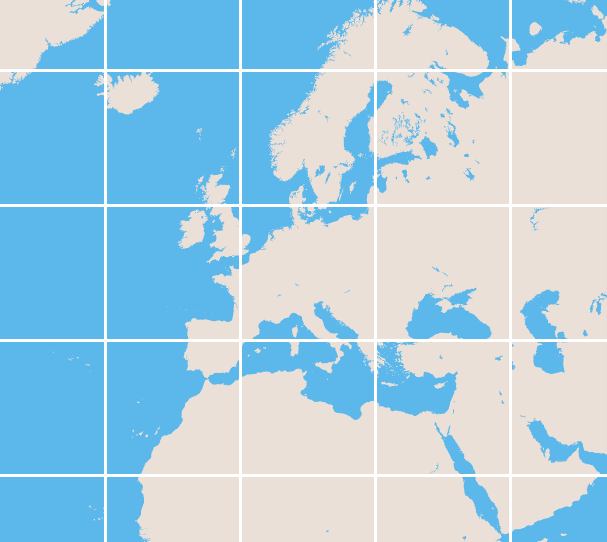
The previous image shows a visualization of tile seams. This image is slightly exaggerated: We render every tile at least 512px by 512px to reduce the number of tiles we need to download. In practice, this means that most map views (even large ones) can be covered by 2-4 map tiles, sometimes we just need one. Of course, on retina screens, we render the same tile twice as big, so there the minimum tile size is 1024x1024 pixels (equivalent to 16 PNG tiles).
To render an individual tile, we first confine the active viewport to one of the white squares you see in the visualization, then use the same MVP matrix for all tiles and render it into just that viewport, clipped to its bounding box. This process is repeated for all tiles visible in the canvas’ viewport. Rendering all of these tiles separately is still reasonably fast; it’s less than 1ms per frame on my machine. To achieve fluent zooming and panning with 60fps, we have about 16ms. So there’s still room to spare.
When zooming in or out, we first generate a list of all the required tiles. If they are not loaded yet, we retain existing parent or child tiles in the list of tiles we need to render. In the actual render step, we sort this list by zoom level, so we render lower zoom level tiles first, then render the available high zoom level tiles on top. Because we’re rendering everything fresh at the right resolution, there are no bilinear scaling artifacts like in Leaflet or Google Maps, even if we render a low zoom level tile. The only difference here is that there’s less detail being shown.
Buffers
As mentioned before, storing all vertices in one buffer is the most efficient way to provide vertex coordinates to OpenGL. To draw the lines stored in a buffer, we just call gl.drawArray with that buffer. WebGL provides an offset and length to this call, but it’s very inefficient to call drawArray for every single line we want to draw. OpenGL now gives us two options: Rather than drawing a connected line (a LINE_STRIP), we can draw individual lines (LINES), but that means we’d have to duplicate almost all the coordinates. However, we’d like to render all the lines that share one style (e.g. all the roads) in one draw call, but they’re connected in the buffer. This is where the view frustum (near/far plane) comes into play: When creating the buffer, we insert a 3D coordinate that is outside of the near/far plane so that any line between those two points gets culled. Essentially, every line we want visible is the same 2D plane, while connections between line strips protrude from that plane and get culled.
Specifying a z coordinate that is outside the view frustum means that we have to add a third dimension to all the vertices in our buffer. Of course, this would increase the required memory storage by 50%. Instead, we still store 2D (2-component) vertices. For the connecting vertice, we use an x value of 32767. In the vertex shader, we use step(32767.0, a_position.x) to determine the z value of the vertex. This function returns 0 if the second value is smaller than the first, and 1 otherwise.
We could have written this like:
if (a_position.x == 32767.0) {
    a_position.z = 1.0;
} else {
    a_position.z = 0.0;
}
However, GPU code works a lot differently from CPU code: Branches are very expensive because the GPU essentially has to execute both branches and then sync execution again. Usually, it’s more efficient to just do “more work” but avoid branching like this. This is essentially what the step function does.
Filling polygons requires another trick. After we tessellated our polygons (this will be in another blog post), we get triangle strips:
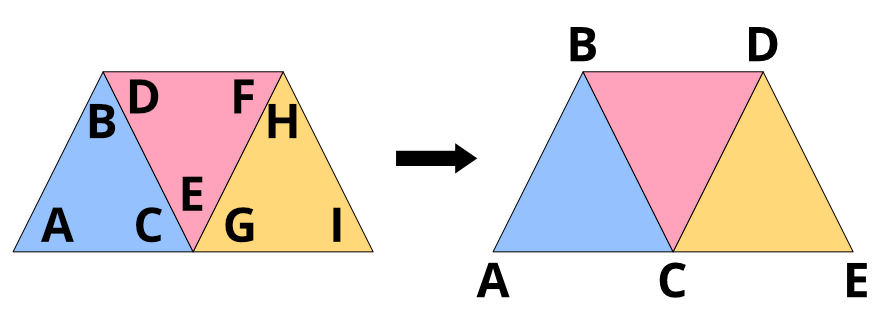
Coordinates ABCDEF form four triangles with only 6 coordinates. However, we still want to pack multiple polygons into one buffer and render them in one go. So we need a way to get from the end of one triangle strip to the beginning of the next strip without actually filling triangles on the way. We can do this with “degenerate” triangles: We simply repeat the last coordinate of the first triangle strip and the first coordinate of the next triangle strip.
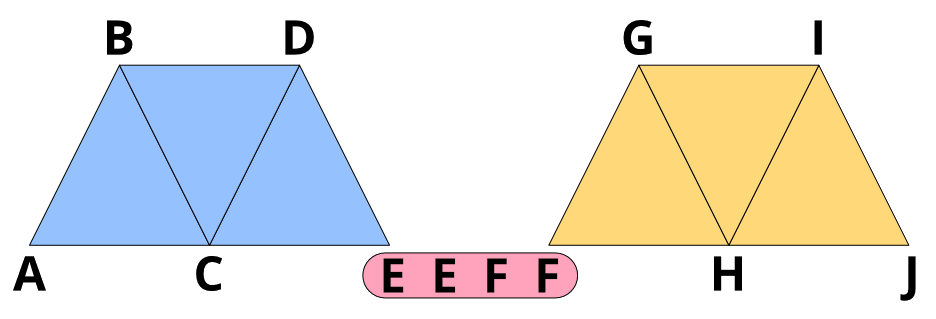
This will generate two triangles that have two points that are coincident, leaving the triangle with zero area. GPUs are very good at eliminating those degenerate triangles
Element Buffers
When I said that we’re going to pack all the lines into one buffer, I wasn’t actually telling the truth. To render lines, we’re actually using two buffers: One buffer that stores just the coordinates (with repeating coordinates deduplicated), and another buffer called “element array” that stores indices to the coordinates in the first (vertex) buffer.
This has several advantages. When rendering the same object both as outlines and as filled polygon, we only have to repeat the vertices once and can just reference them from both buffers. Despite tessellation, we often have repeated vertices in the tessellated polygon due to degenerate triangles. This means that it becomes a lot cheaper memory-wise to do degenerate triangles because we only have to store the index (2 bytes) rather than the actual vertex (4 bytes).
Rendering from element arrays is also faster because the GPU only needs to fetch the (smaller) indices through its pipeline and can use an optimized vertex cache to look up the actual coordinates (this may depend on the GPU).
Line Joins
Drawing high-quality lines is tricky in OpenGL. Last summer, I experimented with line joins. This time, I decided to largely ignore the issue for now, the same way Google doesn’t seem to care:
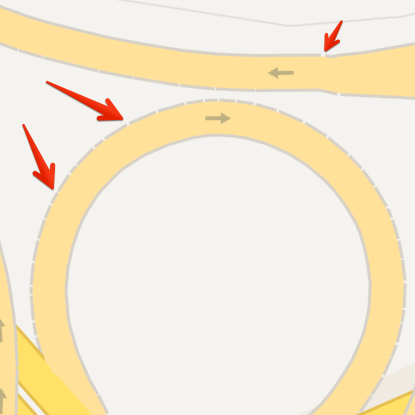
Turns out that most streets don’t actually end without connecting to another street. If the line resolution is high enough the angle between connecting segments is low enough in curves that this is not a big issue. However, in some cases we still see missing line joins:
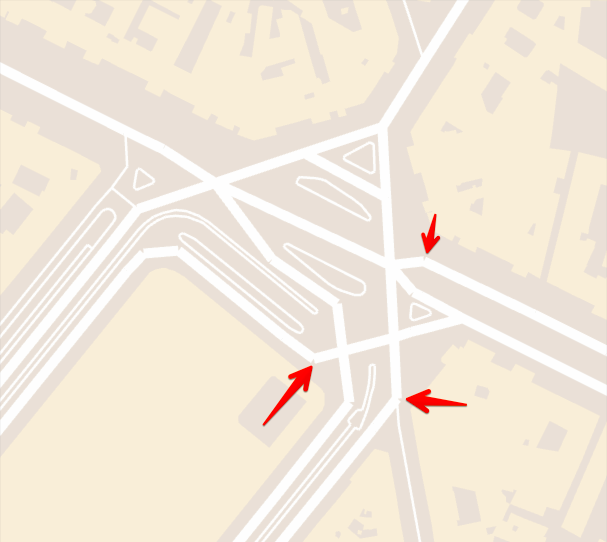
We can fake line miters very well by just drawing points at the line joins,
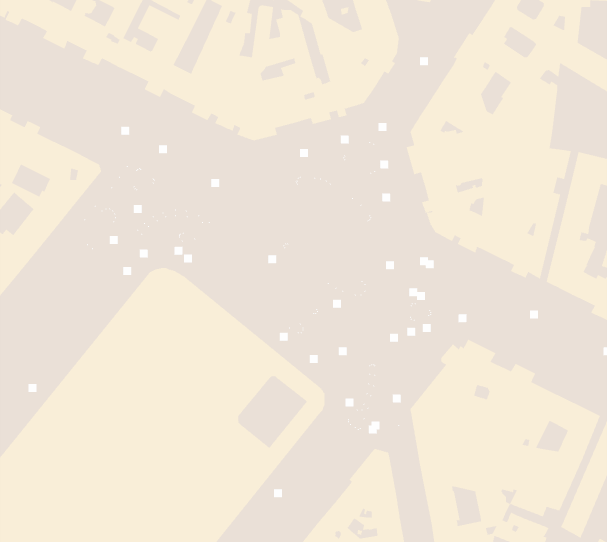
which results in:
To make it even more smooth, we can apply a circle texture to the rectangular points.
The biggest issue with OpenGL’s LINES feature though is that it’s hardware-limited to 10 pixels (on my machine). When rendering for Retina resolution, this drops to 5 visual pixels, which is of course not enough.
Next Steps
This isn’t everything that went into the WebGL map demo, but enough for wrapping up this blog post. I will write another post about more specific topics, e.g. the data format update and polygon tessellation.
While many of the initial problems are now solved, there’s of course still lots to do: labeling, lines, ends and caps, antialiasing on unsupported machines, support for resizing the canvas, moving processing to Web Workers, improving overzooming/tile retention, and much more.
Final note from 2023: You can see for yourself how far Mapbox GL JS has come. If you'd like to experiment with the current version of Mapbox GL JS, check out our guides, sign up for a free account, and start building today.


Related articles
Build once, run everywhere: Web support comes to the Mapbox Maps SDK for Flutter
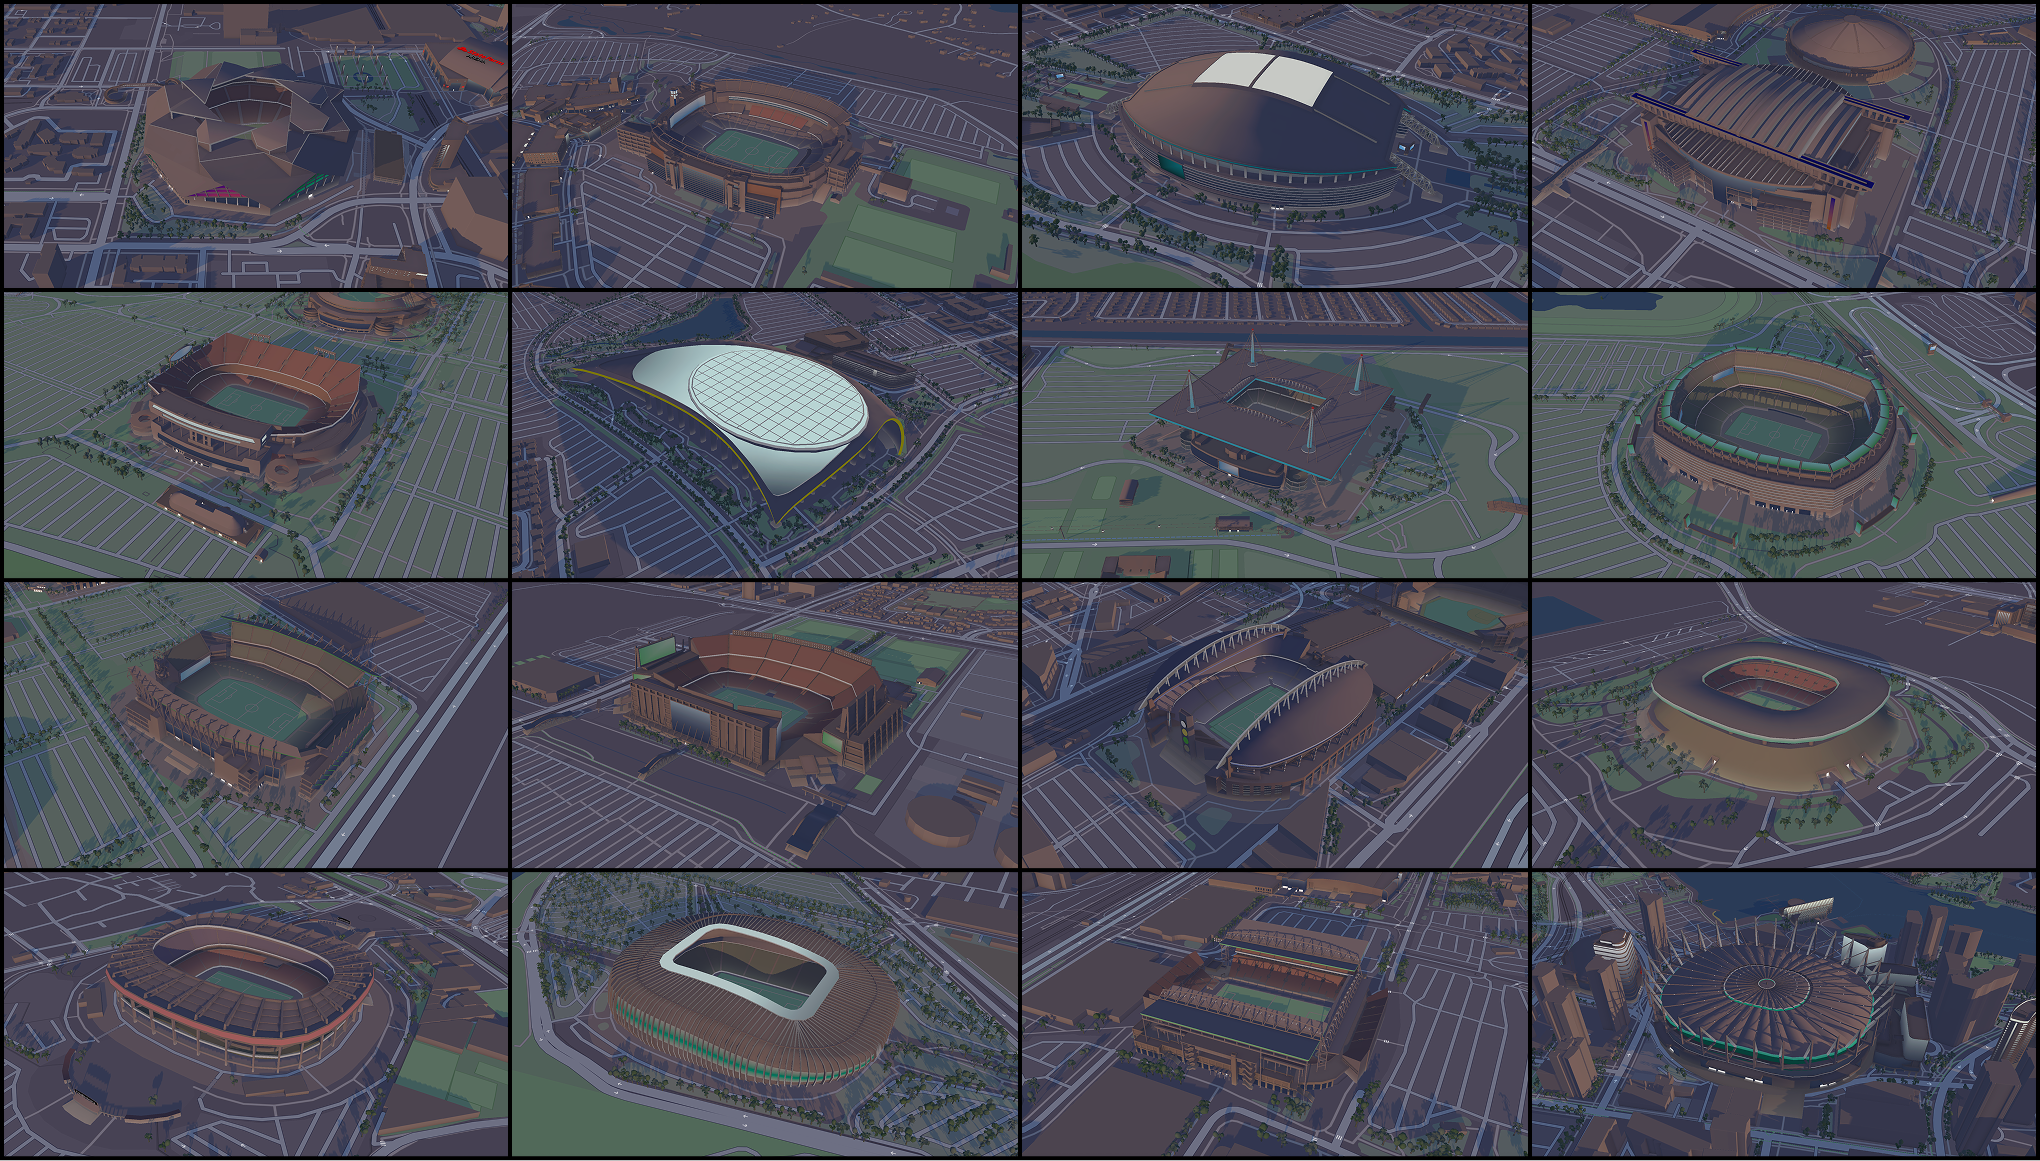
From airports to stadiums, maps are elevating the soccer fan experience