Runtime Styling
Mapbox’s runtime styling features allow you direct control over every layer in your maps with code. It’s now possible to create dynamic maps and visualizations that aren’t possible with other mobile maps SDKs.
Runtime styling expands upon the design power of Mapbox Studio and exposes all of the same properties and attributes directly to mobile developers in our SDK.
Beyond the custom styled maps that you can create with Mapbox Studio, you can now change the look and feel of your map on the fly having maps in your app visually respond to user interaction or or context. Or leverage the power of OpenGL for highly performant and complex data visualizations. Now it’s possible to mix in your own data and bring your map to life.
Example use cases
As an example of what’s possible with runtime styling, consider some of the following use cases:
Styling maps on the fly
At runtime, you can tailor the map specifically to your user interface. Tweak colors, text, and icons to match the style to your brand.
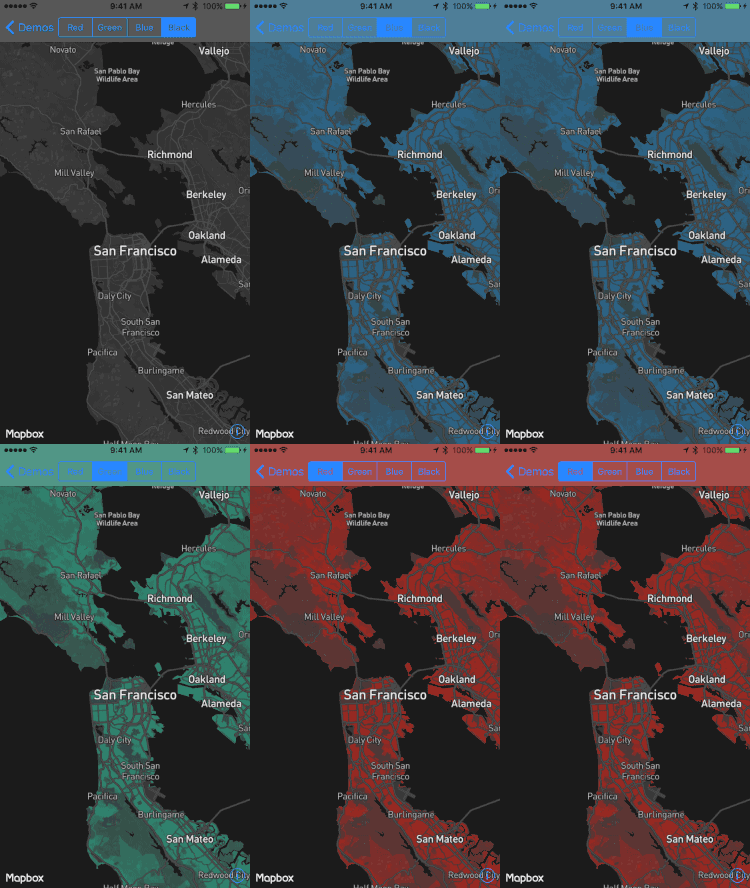
For maps that aren’t going to change in response to custom data or user interaction, consider creating a custom map style with Mapbox Studio.
Map interactivity
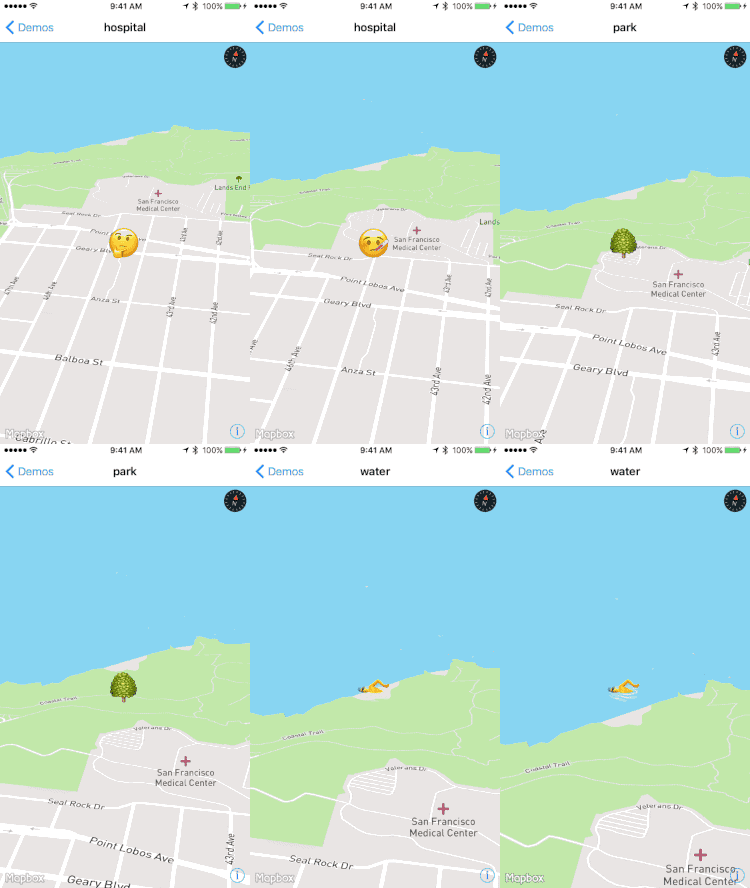
You can customize the map to the point of having it respond dynamically based on the actions your users are taking. Increase the text size of streets while a user is driving, emphasize points of interest tailored to a user’s preferences, or change your UI if users are at parks, trails, landmarks, or rivers.
Powerful data visualization
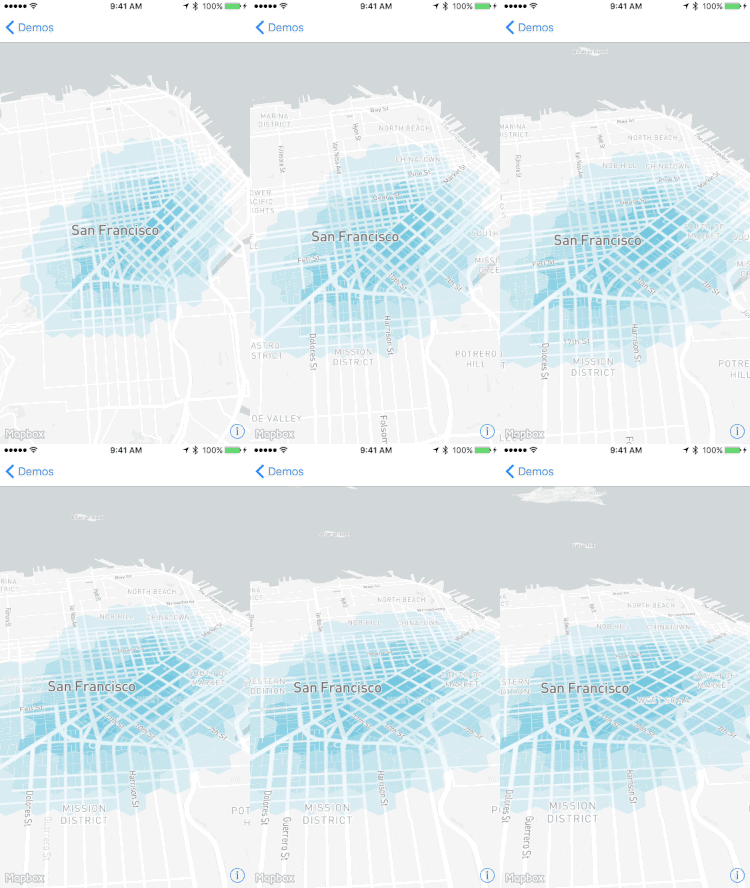
Mapbox maps are built on top of OpenGL and can support rendering data without the traditional overhead of UIView-based map annotations.
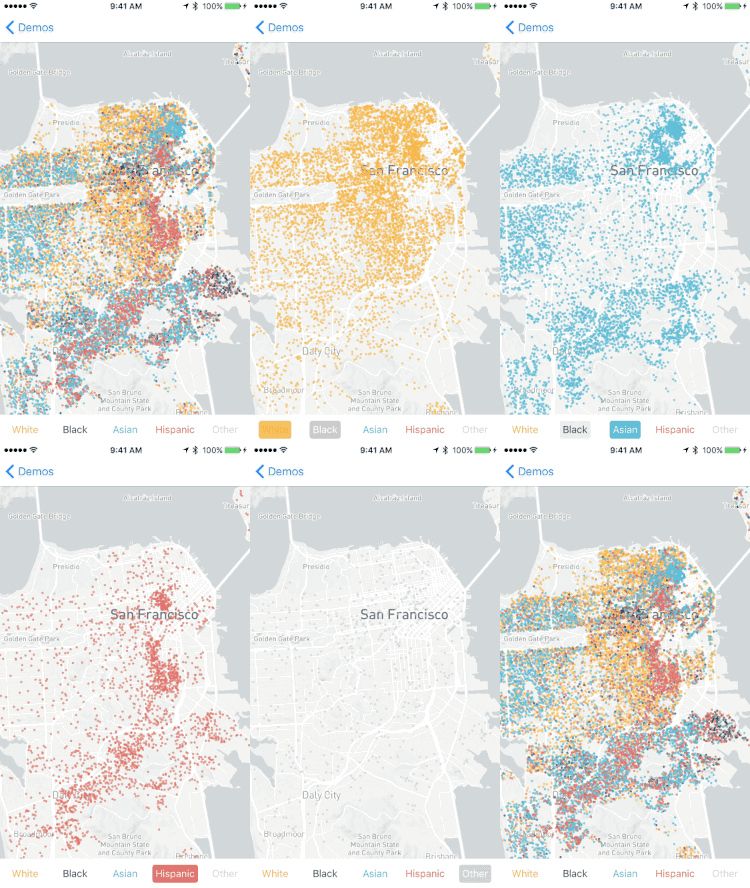
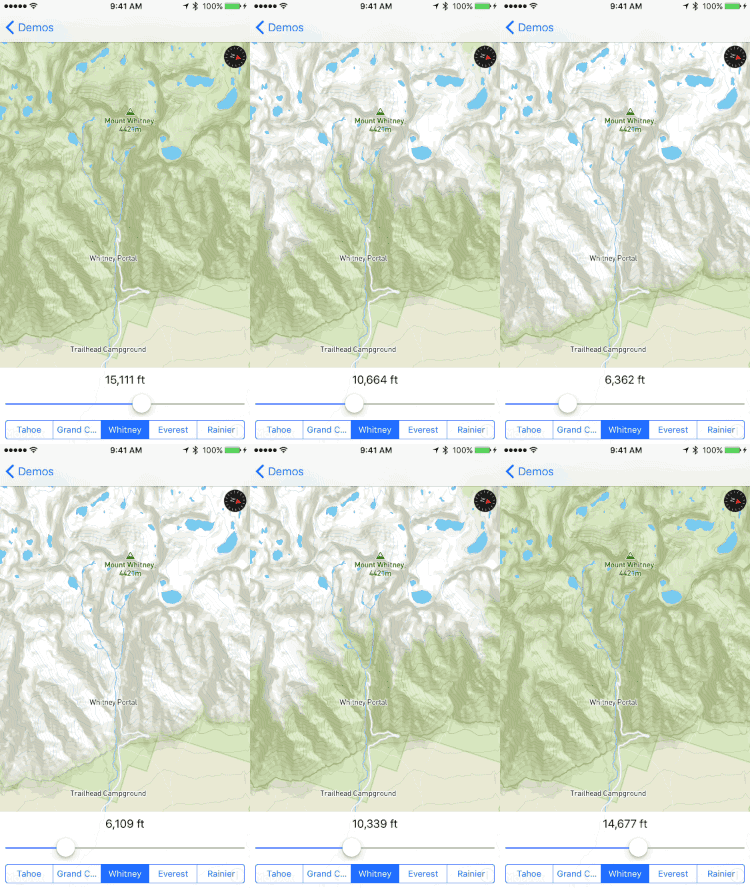
Mapbox can support data visualizations that were slow or impossible with traditional map SDKs. Render heatmaps, visualize population density, or even go so far as updating the snow levels in the mountains to match recent snowfall.
Powerful annotations
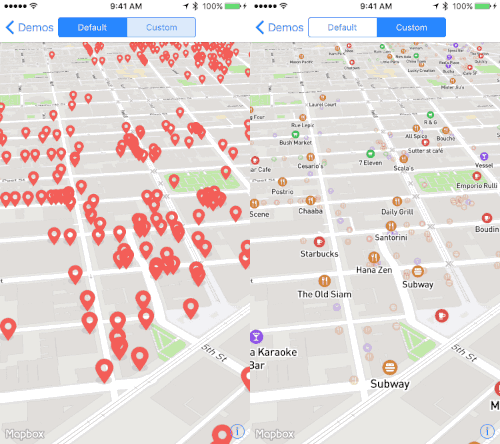
The Mapbox SDK gives you access to all of the same tools we use to render our default map styles. Instead of using generic pin markers, enrich your place data or custom polygons with icons and labels that make your maps stand out.
Custom shapes
Draw custom shapes on the map the same way you would a custom UIView or CALayer. These shapes keep their geographic scale and are perfect for visualizing everything from indoor floor plans to metro systems to hurricane tracks.
Next steps
Check out the iOS code examples to learn more about how to use runtime styling in your own apps.
 Install in Dash
 Runtime Styling Reference