Working with large GeoJSON sources in Mapbox GL JS
Mapbox GL GeoJSON sources are turned into Mapbox vector tiles on-the-fly by the client (web browser or mobile device). The purpose of this guide is to show best practices for how to efficiently load and render large GeoJSON sources.
For tips on optimizing the performance of a Mapbox GL JS map by separating static and dynamic features into separate GeoJSON sources, see our Improve the performance of Mapbox GL JS maps troubleshooting guide.
Adjusting the buffer
The buffer option creates an area around tiles that contains extra data that will carry over to the tiles surrounding it. Buffers create heavier tiles but ultimately help with the rendering of features across tile boundaries. If your data contains only points of small circles that will be rendered completely inside one tile, then the buffer option likely isn't necessary. If this is the case for your data, consider setting the buffer option on your GeoJSON source to 0.
If you see rendering bugs around tile boundaries, increase the buffer setting to a value between 0 and 128, the default for a Mapbox GL JS GeoJSON source. Ultimately smaller buffers are faster because they make the vector tiles smaller.
Clustering
At low zoom levels, consider clustering dense point data sources. This makes tiles smaller and faster to load, layers faster to render, and data easier to understand. For more information on how to cluster your data, explore the cluster documentation and the accompanying Mapbox GL JS example.
Zoom levels
Set the maxzoom option on the GeoJSON source to a value less than the default of 18. This setting will increase map performance while panning and zooming past the specified maxzoom level. For most point sources, a value of 12 is a good balance between precision and speed.
Set the minzoom layer property on the layer referencing the GeoJSON source to a value greater than 0. The minzoom property setting prevents the map from trying to load and render tiles at low zoom levels. Seeing every feature of your large dataset isn't useful at low zoom levels because there are not enough pixels on the screen. Adjusting this will result in a faster map load and an increase in render performance.
Cleaning up your data
Within your GeoJSON source, prune out any data properties that are not necessary for a visualization and use a maximum of 6-decimal precision for coordinate values. The data from the Make a heatmap with Mapbox GL JS tutorial was initially 19.3 MB. As shown in the snippet below, there are several properties in the data that are not being used and the precision of the coordinates are unnecessarily extended to ten decimal places.
{
  "type": "FeatureCollection",
  "features": [
    {
      "type": "Feature",
      "properties": {
        "objectid": 1,
        "id": 1,
        "uniqueid": "1695.00",
        "address": "230",
        "suffix": " ",
        "street": "Stratford Ave",
        "onstr": "Friendship Ave",
        "fromstr": "Stratford Ave",
        "tostr": "Fairmount St /S",
        "side": "Side",
        "site": "1",
        "spp": "Acer platanoides",
        "dbh": 5,
        "cond": "Good",
        "trunks": 1,
        "mt": "Training Prune",
        "observe": "None",
        "hardscape": "N",
        "inspect": "N",
        "klir": "Vehicle",
        "utilities": "Y",
        "grow": "Tree Lawn",
        "spacesize": 2,
        "loctype": "Street",
        "pghdbsdeTree_Keeperarea": 8,
        "staff": "Kara Masak",
        "inv_date": "2005-02-14T00:00:00.000Z",
        "inv_time": " ",
        "inspect_dt": "2005-02-14T00:00:00.000Z",
        "inspect_tm": "10:18:32",
        "active": 1
      },
      "geometry": {
        "type": "Point",
        "coordinates": [-79.9334671524, 40.4611126031]
      }
    }
    // additional features
  ]
}
After using tools like geojson-pick to remove unused properties and geojson-precision to limit the number of decimal places for coordinates, the file is reduced to 3.3MB. Not only is the file much smaller, but the map rendering is noticeably quicker and smoother. Below is the same feature shown above after this process. Because the heatmap is only showing the location of the tree and its diameter at breast height (dbh), no other properties are necessary.
{
  "type": "FeatureCollection",
  "features": [
    {
      "type": "Feature",
      "properties": {
        "dbh": 5
      },
      "geometry": {
        "type": "Point",
        "coordinates": [-79.93345, 40.46111]
      }
    }
  ]
}
As a final step, minify your GeoJSON with a tool of your choice to remove whitespace and decrease the file size.
{
  "type": "FeatureCollection",
  "features": [
    {
      "type": "Feature",
      "properties": { "dbh": 5 },
      "geometry": { "type": "Point", "coordinates": [-79.93345, 40.46111] }
    }
  ]
}
Store GeoJSON at URL
If possible, consider loading your GeoJSON from a data URL instead of holding it in a JavaScript object and passing to a Mapbox GL GeoJSON Source. This reduces client memory overhead. There are many different places where you can store your data. For GitHub files, you can use GitHub Pages to store and link to your data. Adding this data to your project with Mapbox GL JS should look something like the code below:
map.addSource('some id', {
  type: 'geojson',
  data: 'https://mydomain.mydata.geojson'
});
Symbol layers
For unclustered symbol layers with GeoJSON as the source, set the layout property icon-allow-overlap to true (below, left). This improves the speed of rendering while panning and zooming for really dense point data sets. This results in much faster layer render and interaction time than if setting icon-allow-overlap to false (below, right).
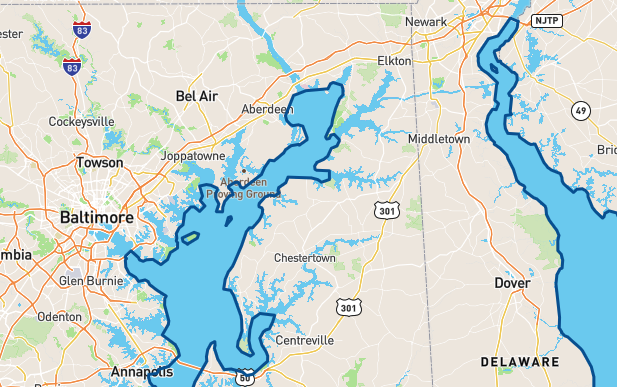
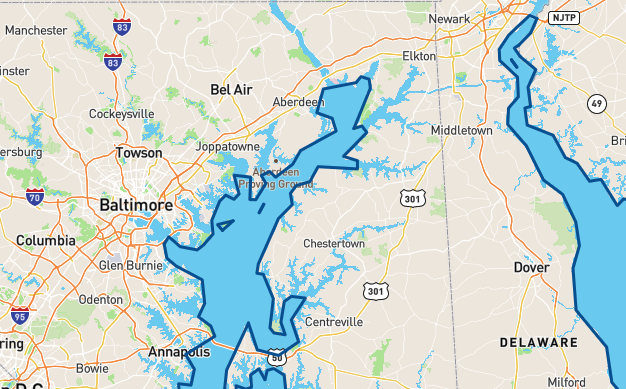
Tolerance
The tolerance option of a GeoJSON source can be increased to simplify linestrings and polygons. This option implements the Douglas–Peucker algorithm and can be used to improve performance. The first image below shows tolerance set to its default of 0.375 and the one on the right shows it set to 3.5.
Even bigger data
If your source data starts to get really large (over 500,000 data points), there are a couple other techniques you can use to improve speed.
Source splitting
You can split your GeoJSON source into two or three parts, effectively doubling or tripling your ability to load and render more data. Tools like geojsplit make the process of breaking up GeoJSON sources manageable. Once the data has been divided, each source can be added to the map using addSource() and addLayer(). If you are interested, this practical example demonstrates how to add a split source to a map. Note that source splitting will not do much to increase performance on mobile browsers.
Tiling on the server
The easiest way to do tiling on the server is to upload the data to Mapbox using Mapbox Tiling Service (MTS). You can also use the Uploads API, but unlike MTS, the Uploads API does not allow you to customize how your data is tiled. For more information, see the Uploading new data getting started guide.