✨ Learn how Boston Children's Hospital uses Mapbox to create Vaccines.gov →
Over 1 million square kilometers of recent, high-resolution imagery covering the most populous areas
By
Bill Morris
-
Apr 23, 2024
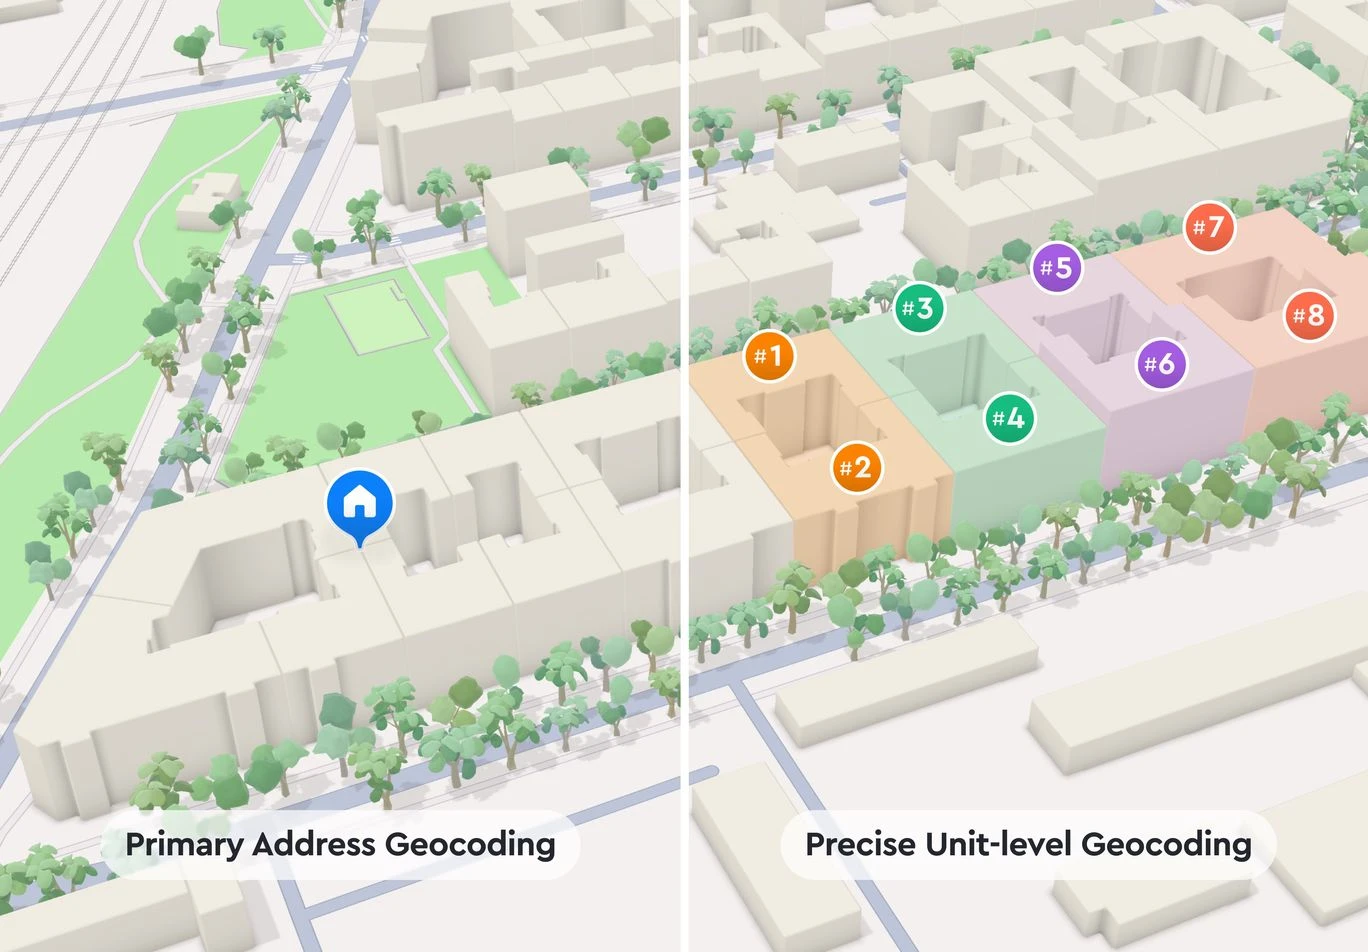
Power your business with unit-level geocoding and advanced features for high-volume geocoding & analysis
Robert Florance
Mapbox
Apr 22, 2024
Mapbox now offers full platform support for raster weather data to more efficiently process and render dynamic, engaging weather visualizations
Alistair Miller
Apr 18, 2024
Mar 13, 2024
Mar 6, 2024
Mapbox announces the General Availability of Search Box API, the all-in-one location service search for your apps
Murat Bahar
Mar 5, 2024
How Mapbox Helps On-Demand Logistics Leaders Scale
Bing Peng
Mar 4, 2024
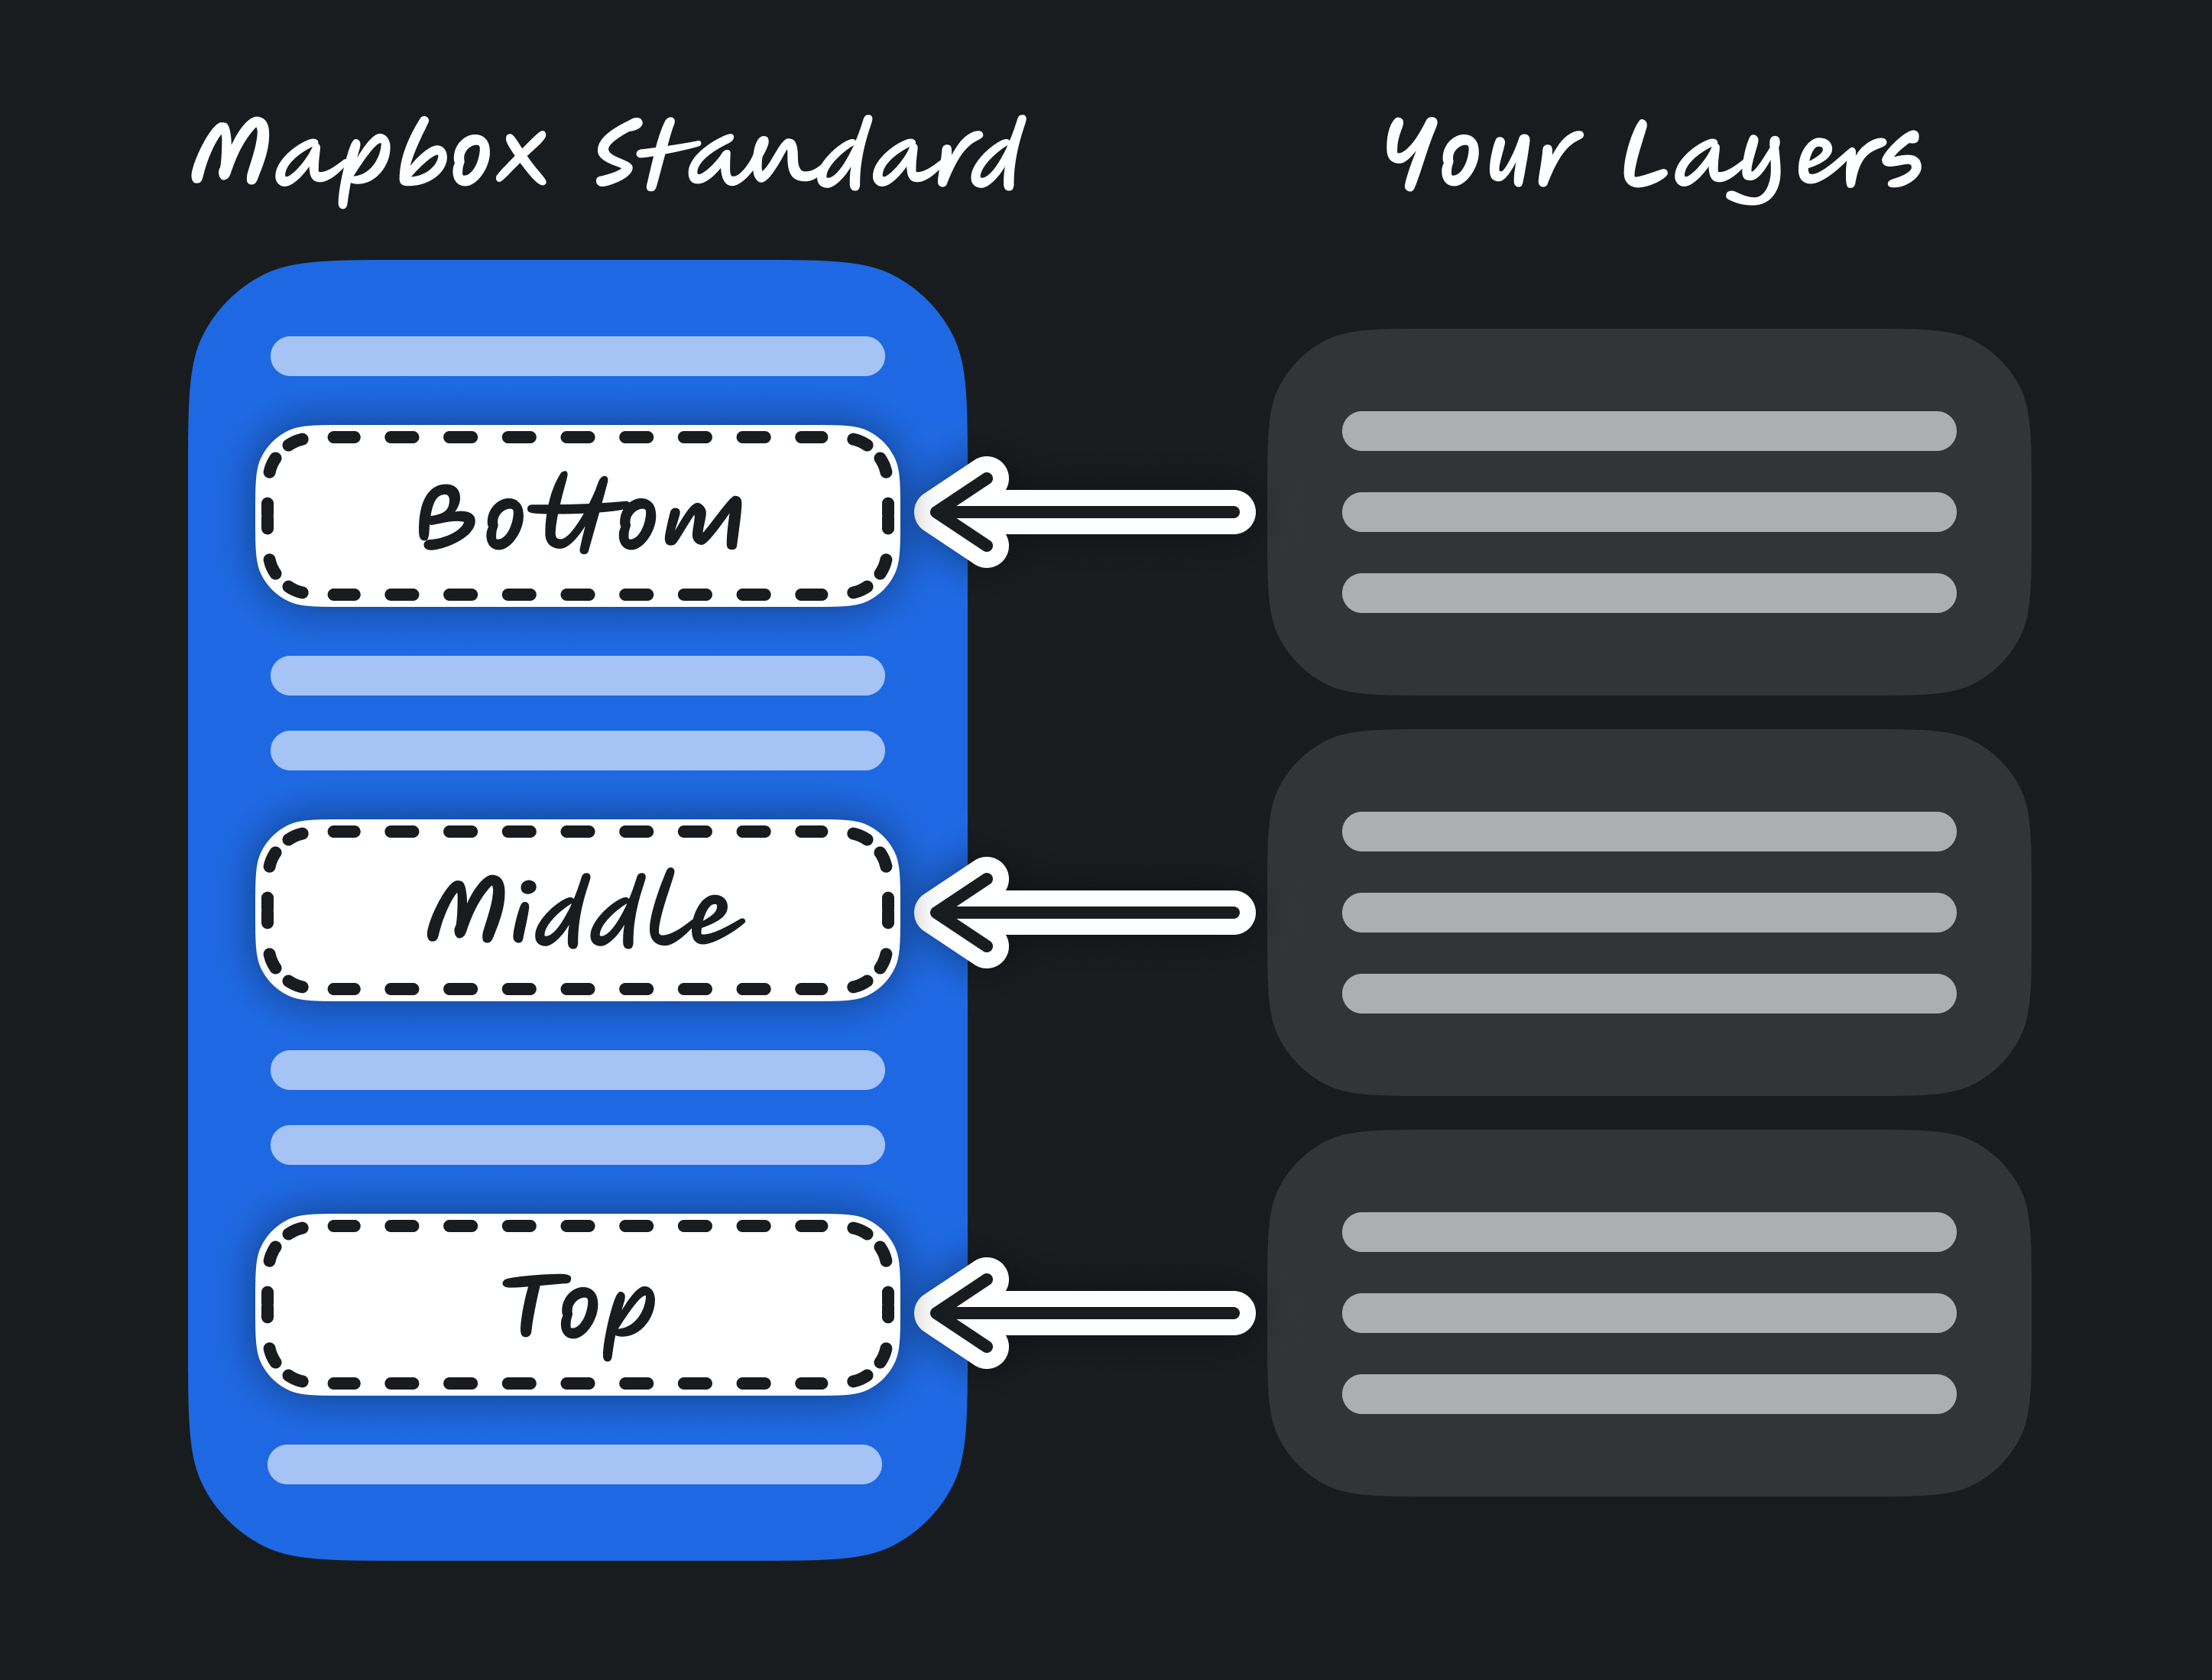
The Mapbox Standard style offers an immersive urban experience with detailed 3D landmarks for over 80 cities, and more being added each month.
Andrei Sapsaliou
Feb 16, 2024
30,000+ new and updated geographic boundary data coverage for Africa, Oceania, and Island States
Cris Byers
Dec 18, 2023
Marena Smith
Nov 7, 2023
Discover ways to use location technologies to power business value and innovation, in conversation with Mapbox leaders and product teams
Nov 1, 2023
Konstantin Käfer
Oct 24, 2023
Sofia Heisler
Apr 10, 2024
Mapbox empowers users with seamless address, places, and POI (Points of Interest) search, even when they are offline
Apr 3, 2024
Kieran McCann
Mar 28, 2024
by
Daniel Eke
Mar 25, 2024
Introducing Mapbox Isochrones with depart_at functionality
Ryan Leidigh
Oct 10, 2023
Annual awards recognize innovation in global automotive and transportation technologies
Oct 5, 2023
The new map service provides increased road coverage and daily updates for autopilot systems.
Lina Shiryaeva
Oct 4, 2023
Combine Probable Futures tilesets with Mapbox applications
Peter Croce
Sep 6, 2023
Mathew Antony
Aug 28, 2023
A Mapbox Base Map Update
Aug 15, 2023


.png)
